Every problem in the chapter beside the book’s answer, a chapter at a time as you scroll.
Chapter 3: Functions
346 problems · 130 figuresTry It #1 §3.1 source ↗
Table 21 lists the five greatest baseball players of all time in order of rank.
| Player | Rank |
|---|---|
| Babe Ruth | 1 |
| Willie Mays | 2 |
| Ty Cobb | 3 |
| Walter Johnson | 4 |
| Hank Aaron | 5 |
ⓐIs the rank a function of the player name?
ⓑIs the player name a function of the rank?
Answer
ⓐyes
ⓑ yes (Note: If two players had been tied for, say, 4th place, then the name would not have been a function of rank.)
Try It #2 §3.1 source ↗
Answer
Try It #3 §3.1 source ↗
Does Table 9 represent a function?
| Input | Output |
|---|---|
| 1 | 10 |
| 2 | 100 |
| 3 | 1000 |
Answer
Try It #4 §3.1 source ↗
Answer
Try It #5 §3.1 source ↗
Answer
Try It #6 §3.1 source ↗
Answer
Try It #7 §3.1 source ↗
Answer
Try It #8 §3.1 source ↗
Answer
Try It #9 §3.1 source ↗
ⓐ Is a balance a function of the bank account number?
ⓑ Is a bank account number a function of the balance?
ⓒ Is a balance a one-to-one function of the bank account number?
Answer
ⓐ yes, because each bank account has a single balance at any given time;
ⓑ no, because several bank account numbers may have the same balance;
ⓒ no, because the same output may correspond to more than one input.
Try It #10 §3.1 source ↗
ⓐ If each percent grade earned in a course translates to one letter grade, is the letter grade a function of the percent grade?
ⓑ If so, is the function one-to-one?
Answer
ⓐ Yes, letter grade is a function of percent grade;
ⓑ No, it is not one-to-one. There are 100 different percent numbers we could get but only about five possible letter grades, so there cannot be only one percent number that corresponds to each letter grade.
Try It #11 §3.1 source ↗
Does the graph in Figure 11 represent a function?
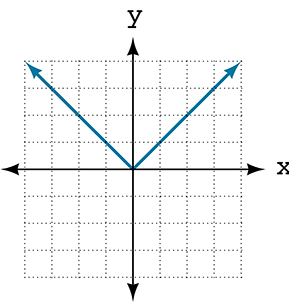 Figure 11
Answer
Try It #12 §3.1 source ↗
Answer
3.1-1 §3.1 source ↗
Answer
3.1-3 §3.1 source ↗
Answer
3.1-5 §3.1 source ↗
Answer
3.1-7 §3.1 source ↗
For the following exercises, determine whether the relation represents a function.
Answer
3.1-9 §3.1 source ↗
For the following exercises, determine whether the relation represents as a function of
Answer
3.1-11 §3.1 source ↗
For the following exercises, determine whether the relation represents as a function of
Answer
3.1-13 §3.1 source ↗
For the following exercises, determine whether the relation represents as a function of
Answer
3.1-15 §3.1 source ↗
For the following exercises, determine whether the relation represents as a function of
Answer
3.1-17 §3.1 source ↗
For the following exercises, determine whether the relation represents as a function of
Answer
3.1-19 §3.1 source ↗
For the following exercises, determine whether the relation represents as a function of
Answer
3.1-21 §3.1 source ↗
For the following exercises, determine whether the relation represents as a function of
Answer
3.1-23 §3.1 source ↗
For the following exercises, determine whether the relation represents as a function of
Answer
3.1-25 §3.1 source ↗
For the following exercises, determine whether the relation represents as a function of
Answer
3.1-27 §3.1 source ↗
For the following exercises, evaluate
Answer
3.1-29 §3.1 source ↗
For the following exercises, evaluate
Answer
3.1-31 §3.1 source ↗
For the following exercises, evaluate
Answer
3.1-33 §3.1 source ↗
For the following exercises, evaluate
Given the function evaluate
Answer
3.1-35 §3.1 source ↗
For the following exercises, evaluate
Given the function
ⓐ Evaluate
ⓑ Solve
Answer
3.1-37 §3.1 source ↗
For the following exercises, evaluate
Given the function
ⓐ Evaluate
ⓑ Solve
Answer
3.1-39 §3.1 source ↗
For the following exercises, evaluate
Consider the relationship
ⓐ Write the relationship as a function
ⓑ Evaluate
ⓒ Solve
Answer
ⓐ
ⓑ
ⓒ
3.1-41 §3.1 source ↗
For the following exercises, use the vertical line test to determine which graphs show relations that are functions.
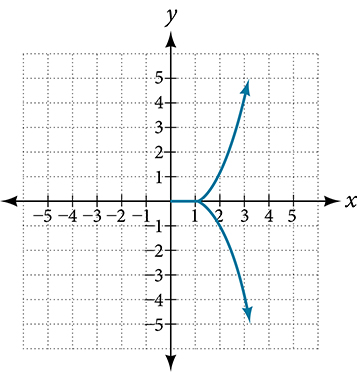
Answer
3.1-43 §3.1 source ↗
For the following exercises, use the vertical line test to determine which graphs show relations that are functions.
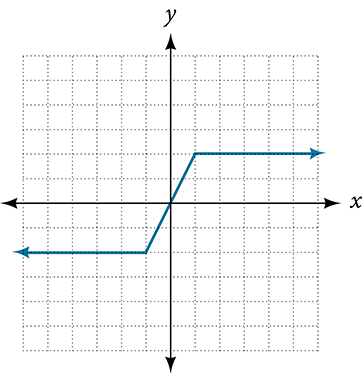
Answer
3.1-45 §3.1 source ↗
For the following exercises, use the vertical line test to determine which graphs show relations that are functions.
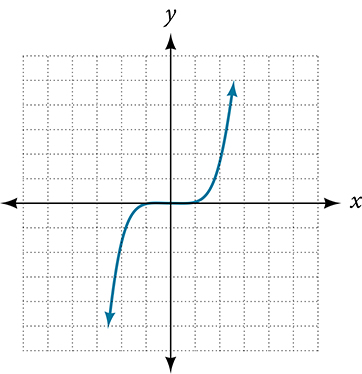
Answer
3.1-47 §3.1 source ↗
For the following exercises, use the vertical line test to determine which graphs show relations that are functions.
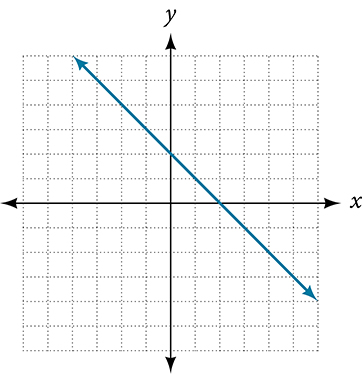
Answer
3.1-49 §3.1 source ↗
For the following exercises, use the vertical line test to determine which graphs show relations that are functions.
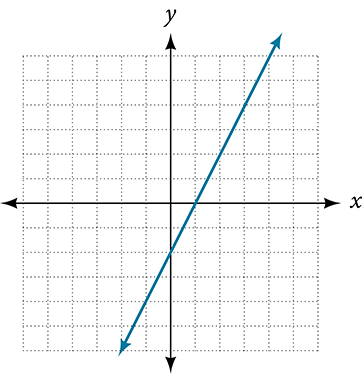
Answer
3.1-51 §3.1 source ↗
For the following exercises, use the vertical line test to determine which graphs show relations that are functions.
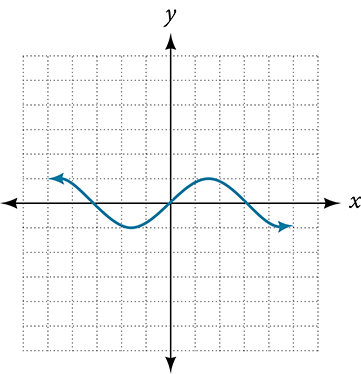
Answer
3.1-53 §3.1 source ↗
For the following exercises, use the vertical line test to determine which graphs show relations that are functions.
Given the following graph,
ⓐ Evaluate
ⓑ Solve for
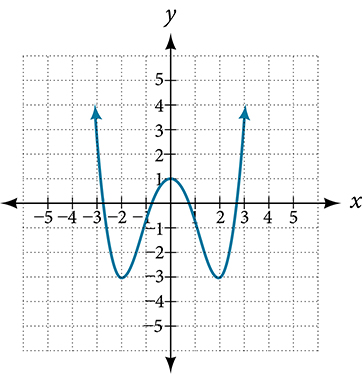
Answer
ⓐ
ⓑ or
3.1-55 §3.1 source ↗
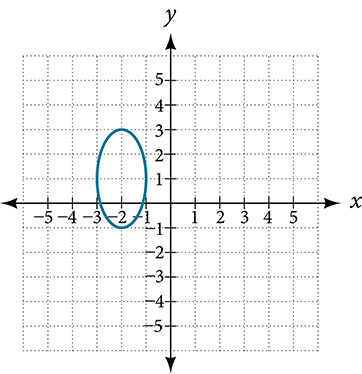
For the following exercises, determine if the given graph is a one-to-one function.
Answer
3.1-57 §3.1 source ↗
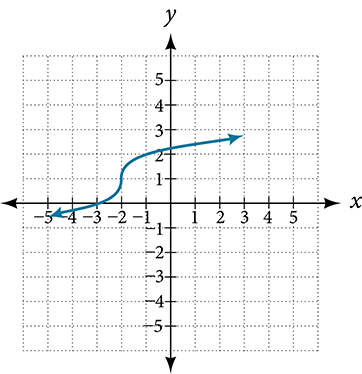
For the following exercises, determine if the given graph is a one-to-one function.
Answer
3.1-59 §3.1 source ↗
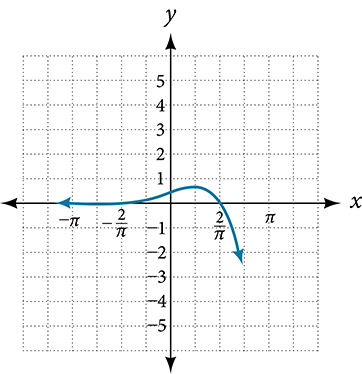
For the following exercises, determine if the given graph is a one-to-one function.
Answer
3.1-61 §3.1 source ↗
For the following exercises, determine whether the relation represents a function.
Answer
3.1-63 §3.1 source ↗
For the following exercises, determine if the relation represented in table form represents as a function of
| 5 | 10 | 15 | |
| 3 | 8 | 14 |
Answer
3.1-65 §3.1 source ↗
For the following exercises, determine if the relation represented in table form represents as a function of
| 5 | 10 | 10 | |
| 3 | 8 | 14 |
Answer
3.1-67 §3.1 source ↗
For the following exercises, use the function represented in the table below.
| 0 | 1 | 2 | 3 | 4 | 5 | 6 | 7 | 8 | 9 | |
| 74 | 28 | 1 | 53 | 56 | 3 | 36 | 45 | 14 | 47 |
Solve
Answer
3.1-69 §3.1 source ↗
For the following exercises, evaluate the function at the values and
Answer
3.1-71 §3.1 source ↗
For the following exercises, evaluate the function at the values and
Answer
3.1-73 §3.1 source ↗
For the following exercises, evaluate the function at the values and
Answer
3.1-75 §3.1 source ↗
For the following exercises, evaluate the expressions, given functions and
Answer
3.1-77 §3.1 source ↗
For the following exercises, graph on the given domain. Determine the corresponding range. Show each graph.
Answer
3.1-79 §3.1 source ↗
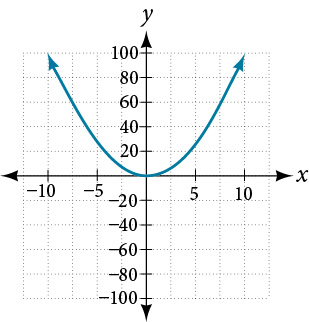
For the following exercises, graph on the given domain. Determine the corresponding range. Show each graph.
Answer
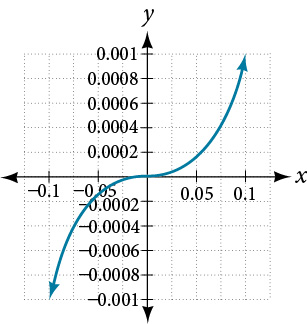
3.1-81 §3.1 source ↗
For the following exercises, graph on the given domain. Determine the corresponding range. Show each graph.
Answer
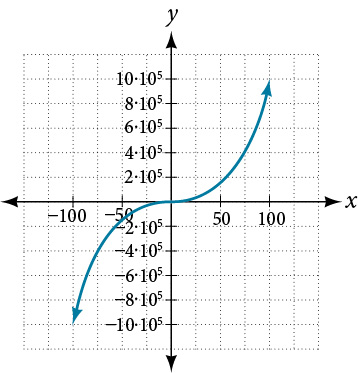
3.1-83 §3.1 source ↗
For the following exercises, graph on the given domain. Determine the corresponding range. Show each graph.
Answer
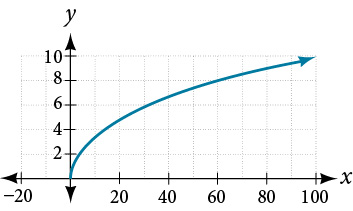
3.1-85 §3.1 source ↗
For the following exercises, graph on the given domain. Determine the corresponding range. Show each graph.
Answer
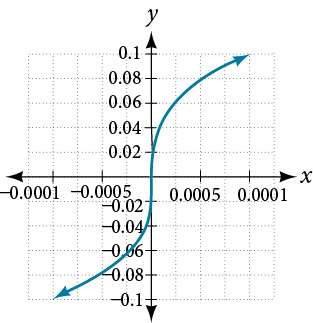
3.1-87 §3.1 source ↗
For the following exercises, graph on the given domain. Determine the corresponding range. Show each graph.
Answer
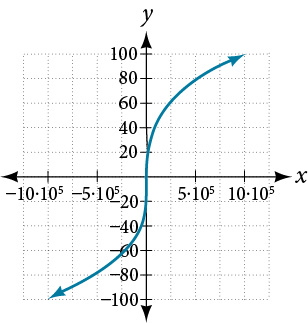
3.1-89 §3.1 source ↗
For the following exercises, graph on the given domain. Determine the corresponding range. Show each graph.
The number of cubic yards of dirt, needed to cover a garden with area square feet is given by
ⓐ A garden with area 5000 ft2 requires 50 yd3 of dirt. Express this information in terms of the function
ⓑ Explain the meaning of the statement
Answer
ⓐ
ⓑ The number of cubic yards of dirt required for a garden of 100 square feet is 1.
3.1-91 §3.1 source ↗
For the following exercises, graph on the given domain. Determine the corresponding range. Show each graph.
Let be the height above ground, in feet, of a rocket seconds after launching. Explain the meaning of each statement:
ⓐ
ⓑ
Answer
ⓐ The height of a rocket above ground after 1 second is 200 ft.
ⓑ The height of a rocket above ground after 2 seconds is 350 ft.
Try It #1 §3.2 source ↗
Find the domain of the function:
Answer
Try It #2 §3.2 source ↗
Answer
Try It #3 §3.2 source ↗
Answer
Try It #4 §3.2 source ↗
Answer
Try It #5 §3.2 source ↗
Given Figure 7, specify the graphed set in
ⓐ words
ⓑ set-builder notation
ⓒ interval notation
 Figure 7
Answer
ⓐ values that are less than or equal to –2, or values that are greater than or equal to –1 and less than 3
ⓑ
ⓒ
Try It #6 §3.2 source ↗
Given Figure 12, identify the domain and range using interval notation.
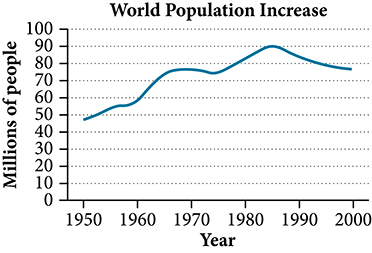 Figure 12
Answer
Try It #7 §3.2 source ↗
Answer
Try It #8 §3.2 source ↗
Graph the following piecewise function.
Answer
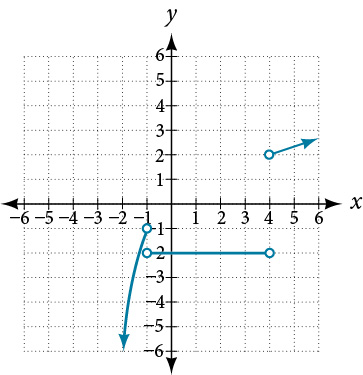
3.2-1 §3.2 source ↗
Answer
3.2-3 §3.2 source ↗
Answer
3.2-5 §3.2 source ↗
Answer
3.2-7 §3.2 source ↗
For the following exercises, find the domain of each function using interval notation.
Answer
3.2-9 §3.2 source ↗
For the following exercises, find the domain of each function using interval notation.
Answer
3.2-11 §3.2 source ↗
For the following exercises, find the domain of each function using interval notation.
Answer
3.2-13 §3.2 source ↗
For the following exercises, find the domain of each function using interval notation.
Answer
3.2-15 §3.2 source ↗
For the following exercises, find the domain of each function using interval notation.
Answer
3.2-17 §3.2 source ↗
For the following exercises, find the domain of each function using interval notation.
Answer
3.2-19 §3.2 source ↗
For the following exercises, find the domain of each function using interval notation.
Answer
3.2-21 §3.2 source ↗
For the following exercises, find the domain of each function using interval notation.
Answer
3.2-23 §3.2 source ↗
For the following exercises, find the domain of each function using interval notation.
Answer
3.2-25 §3.2 source ↗
For the following exercises, find the domain of each function using interval notation.
Answer
3.2-27 §3.2 source ↗
For the following exercises, write the domain and range of each function using interval notation.
![Graph of a function from (2, 8].](/media/25390f6c91a2470fba542396ab6173bd0ff36a0e0f31f7c706ed02235f0c6a8b)
Answer
3.2-29 §3.2 source ↗
For the following exercises, write the domain and range of each function using interval notation.
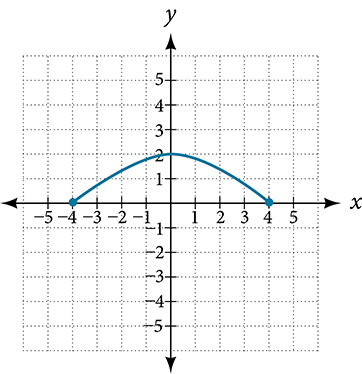
Answer
3.2-31 §3.2 source ↗
For the following exercises, write the domain and range of each function using interval notation.
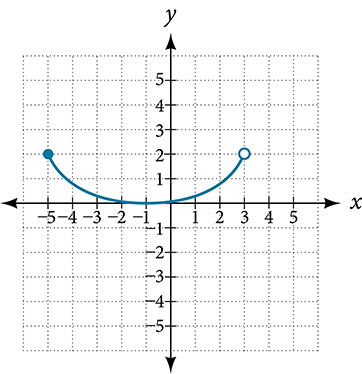
Answer
3.2-33 §3.2 source ↗
For the following exercises, write the domain and range of each function using interval notation.
![Graph of a function from (-infinity, 2].](/media/05ecc464a03e88a6dcb4724d03b5ab8e3fbae20d3f9b64943e8808d6db3f388f)
Answer
3.2-35 §3.2 source ↗
For the following exercises, write the domain and range of each function using interval notation.
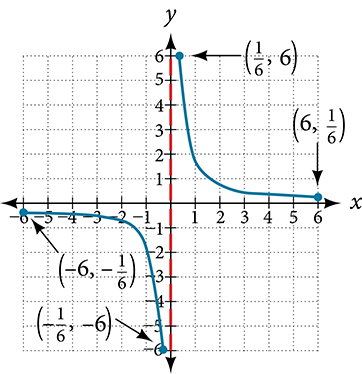
Answer
3.2-37 §3.2 source ↗
For the following exercises, write the domain and range of each function using interval notation.
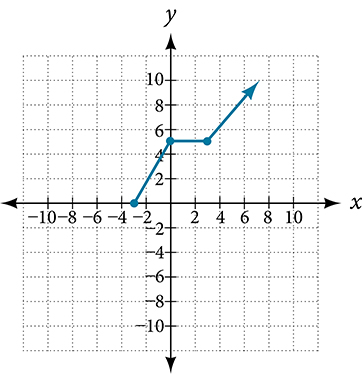
Answer
3.2-39 §3.2 source ↗
For the following exercises, sketch a graph of the piecewise function. Write the domain in interval notation.
Answer
domain:
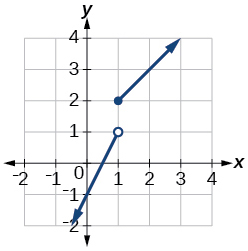
3.2-41 §3.2 source ↗
For the following exercises, sketch a graph of the piecewise function. Write the domain in interval notation.
Answer
domain:
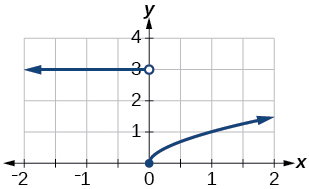
3.2-43 §3.2 source ↗
For the following exercises, sketch a graph of the piecewise function. Write the domain in interval notation.
Answer
domain:
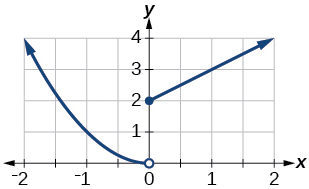
3.2-45 §3.2 source ↗
For the following exercises, sketch a graph of the piecewise function. Write the domain in interval notation.
Answer
domain:
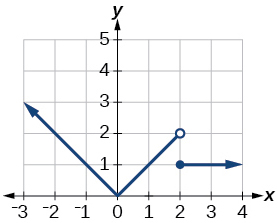
3.2-47 §3.2 source ↗
For the following exercises, given each function evaluate and
Answer
3.2-49 §3.2 source ↗
For the following exercises, given each function evaluate and
Answer
3.2-51 §3.2 source ↗
For the following exercises, given each function evaluate and
Answer
3.2-53 §3.2 source ↗
For the following exercises, write the domain for the piecewise function in interval notation.
Answer
3.2-55 §3.2 source ↗
For the following exercises, write the domain for the piecewise function in interval notation.
Graph on the viewing window and Determine the corresponding range for the viewing window. Show the graphs.
Answer
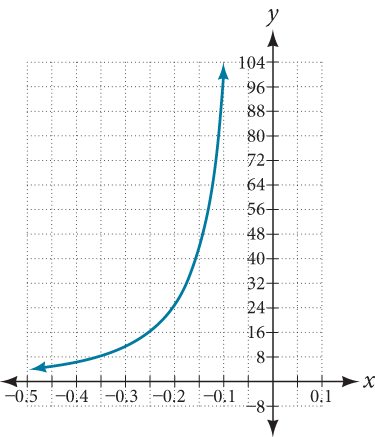
window: range:
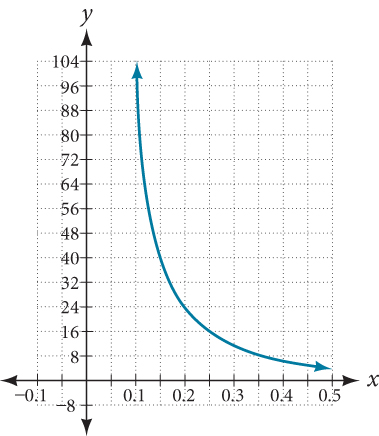
window: range:
3.2-57 §3.2 source ↗
For the following exercises, write the domain for the piecewise function in interval notation.
Suppose the range of a function is What is the range of
Answer
3.2-59 §3.2 source ↗
For the following exercises, write the domain for the piecewise function in interval notation.
Create a function in which the domain is
Answer
3.2-61 §3.2 source ↗
For the following exercises, write the domain for the piecewise function in interval notation.
The cost in dollars of making items is given by the function
ⓐThe fixed cost is determined when zero items are produced. Find the fixed cost for this item.
ⓑWhat is the cost of making 25 items?
ⓒSuppose the maximum cost allowed is $1500. What are the domain and range of the cost function,
Answer
ⓐ The fixed cost is $500.
ⓑ The cost of making 25 items is $750.
ⓒ The domain is [0, 100] and the range is [500, 1500].
Try It #1 §3.3 source ↗
Answer
Try It #2 §3.3 source ↗
Answer
Try It #3 §3.3 source ↗
Answer
Try It #4 §3.3 source ↗
Answer
The local maximum appears to occur at and the local minimum occurs at The function is increasing on and decreasing on
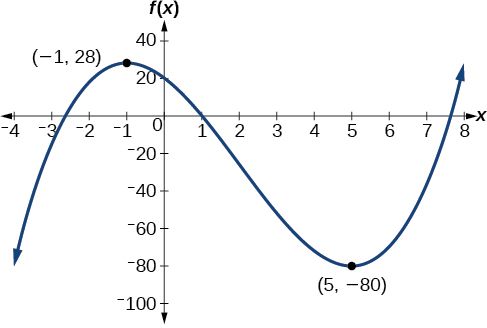
3.3-1 §3.3 source ↗
Answer
3.3-3 §3.3 source ↗
Answer
3.3-5 §3.3 source ↗
For the following exercises, find the average rate of change of each function on the interval specified for real numbers or in simplest form.
on
Answer
3.3-7 §3.3 source ↗
For the following exercises, find the average rate of change of each function on the interval specified for real numbers or in simplest form.
on
Answer
3.3-9 §3.3 source ↗
For the following exercises, find the average rate of change of each function on the interval specified for real numbers or in simplest form.
on
Answer
3.3-11 §3.3 source ↗
For the following exercises, find the average rate of change of each function on the interval specified for real numbers or in simplest form.
on
Answer
3.3-13 §3.3 source ↗
For the following exercises, find the average rate of change of each function on the interval specified for real numbers or in simplest form.
on
Answer
3.3-15 §3.3 source ↗
For the following exercises, find the average rate of change of each function on the interval specified for real numbers or in simplest form.
Find given on
Answer
3.3-17 §3.3 source ↗
For the following exercises, consider the graph of shown in Figure 15.
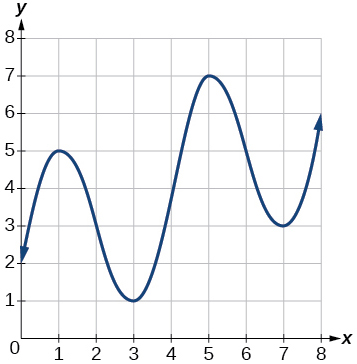 Figure 15
Estimate the average rate of change from to
Answer
3.3-19 §3.3 source ↗
For the following exercises, use the graph of each function to estimate the intervals on which the function is increasing or decreasing.
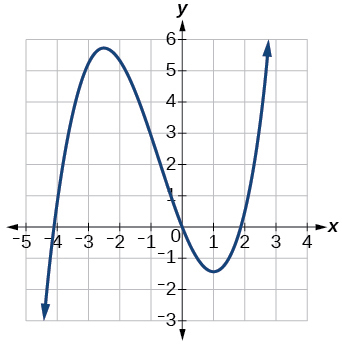
Answer
3.3-21 §3.3 source ↗
For the following exercises, use the graph of each function to estimate the intervals on which the function is increasing or decreasing.
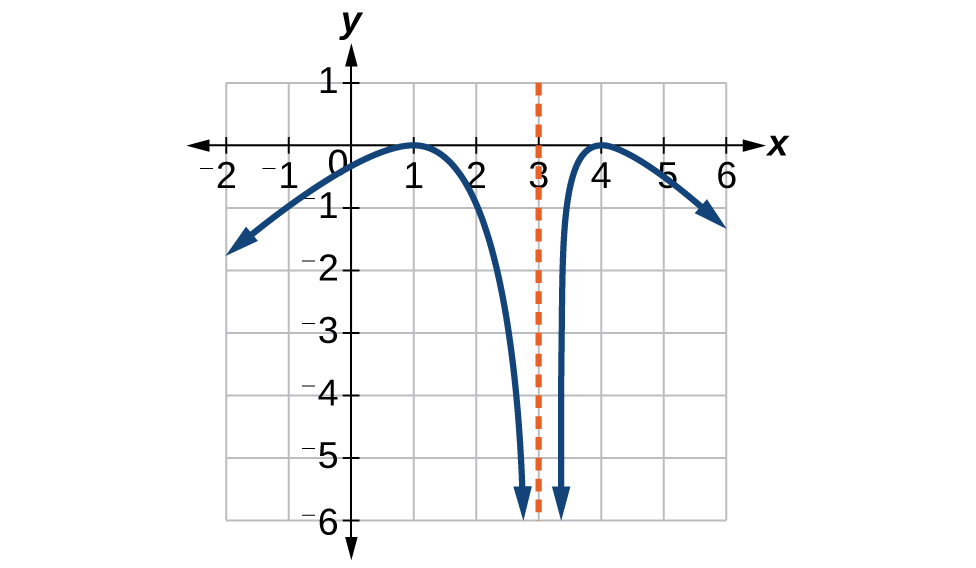
Answer
3.3-23 §3.3 source ↗
For the following exercises, consider the graph shown in Figure 16.
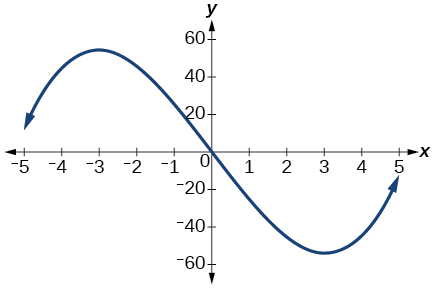 Figure 16
Estimate the point(s) at which the graph of has a local maximum or a local minimum.
Answer
3.3-25 §3.3 source ↗
For the following exercises, consider the graph in Figure 17.
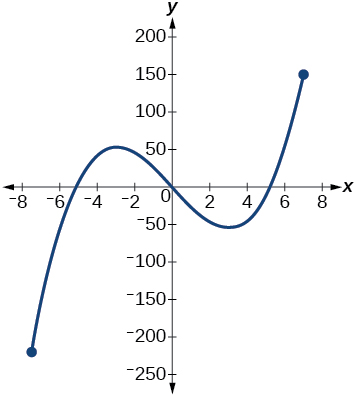 Figure 17
If the complete graph of the function is shown, estimate the absolute maximum and absolute minimum.
Answer
3.3-27 §3.3 source ↗
For the following exercises, consider the graph in Figure 17.
Figure 17 Table 4 gives the population of a town (in thousands) from 2000 to 2008. What was the average rate of change of population (a) between 2002 and 2004, and (b) between 2002 and 2006?
| Year | Population (thousands) |
|---|---|
| 2000 | 87 |
| 2001 | 84 |
| 2002 | 83 |
| 2003 | 80 |
| 2004 | 77 |
| 2005 | 76 |
| 2006 | 78 |
| 2007 | 81 |
| 2008 | 85 |
Answer
ⓐ –3000
ⓑ –1250
3.3-29 §3.3 source ↗
For the following exercises, find the average rate of change of each function on the interval specified.
on
Answer
3.3-31 §3.3 source ↗
For the following exercises, find the average rate of change of each function on the interval specified.
on
Answer
3.3-33 §3.3 source ↗
For the following exercises, find the average rate of change of each function on the interval specified.
on
Answer
3.3-35 §3.3 source ↗
For the following exercises, use a graphing utility to estimate the local extrema of each function and to estimate the intervals on which the function is increasing and decreasing.
Answer
3.3-37 §3.3 source ↗
For the following exercises, use a graphing utility to estimate the local extrema of each function and to estimate the intervals on which the function is increasing and decreasing.
Answer
3.3-39 §3.3 source ↗
For the following exercises, use a graphing utility to estimate the local extrema of each function and to estimate the intervals on which the function is increasing and decreasing.
Answer
3.3-41 §3.3 source ↗
For the following exercises, use a graphing utility to estimate the local extrema of each function and to estimate the intervals on which the function is increasing and decreasing.
The graph of the function is shown in Figure 18.
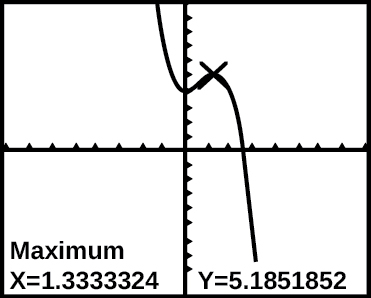 Figure 18
Based on the calculator screen shot, the point is which of the following?
ⓐa relative (local) maximum of the function
ⓑthe vertex of the function
ⓒthe absolute maximum of the function
ⓓa zero of the function
Answer
3.3-43 §3.3 source ↗
For the following exercises, use a graphing utility to estimate the local extrema of each function and to estimate the intervals on which the function is increasing and decreasing.
Let . Find the number such that the average rate of change of on the interval is
Answer
3.3-45 §3.3 source ↗
For the following exercises, use a graphing utility to estimate the local extrema of each function and to estimate the intervals on which the function is increasing and decreasing.
A driver of a car stopped at a gas station to fill up their gas tank. They looked at their watch, and the time read exactly 3:40 p.m. At this time, they started pumping gas into the tank. At exactly 3:44, the tank was full and the driver noticed that they had pumped 10.7 gallons. What is the average rate of flow of the gasoline into the gas tank?
Answer
3.3-47 §3.3 source ↗
For the following exercises, use a graphing utility to estimate the local extrema of each function and to estimate the intervals on which the function is increasing and decreasing.
The graph in Figure 19 illustrates the decay of a radioactive substance over days.
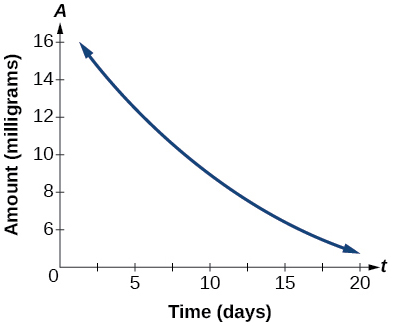 Figure 19
Use the graph to estimate the average decay rate from to
Answer
Try It #1 §3.4 source ↗
Find and simplify the functions and
Are they the same function?
Answer
No, the functions are not the same.
Try It #2 §3.4 source ↗
Answer
Try It #3 §3.4 source ↗
Answer
Try It #4 §3.4 source ↗
Answer
Try It #5 §3.4 source ↗
Given and evaluate
ⓐ
ⓑ
Answer
ⓐ 8
ⓑ 20
Try It #6 §3.4 source ↗
Find the domain of
Answer
Try It #7 §3.4 source ↗
Answer
Possible answer:
3.4-1 §3.4 source ↗
Answer
3.4-3 §3.4 source ↗
Answer
3.4-5 §3.4 source ↗
For the following exercises, determine the domain for each function in interval notation.
Given and find and
Answer
domain:
domain:
domain:
domain:
3.4-7 §3.4 source ↗
For the following exercises, determine the domain for each function in interval notation.
Given and find and
Answer
domain:
domain:
domain:
domain:
3.4-9 §3.4 source ↗
For the following exercises, determine the domain for each function in interval notation.
Given and find and
Answer
domain:
domain:
domain:
domain:
3.4-11 §3.4 source ↗
For the following exercises, determine the domain for each function in interval notation.
For the following exercise, find the indicated function given and
ⓐ
ⓑ
ⓒ
ⓓ
ⓔ
Answer
ⓐ
ⓑ
ⓒ
ⓓ
ⓔ
3.4-13 §3.4 source ↗
For the following exercises, use each pair of functions to find and Simplify your answers.
Answer
3.4-15 §3.4 source ↗
For the following exercises, use each pair of functions to find and Simplify your answers.
Answer
3.4-17 §3.4 source ↗
For the following exercises, use each pair of functions to find and Simplify your answers.
Answer
3.4-19 §3.4 source ↗
For the following exercises, use each set of functions to find Simplify your answers.
and
Answer
3.4-21 §3.4 source ↗
For the following exercises, use each set of functions to find Simplify your answers.
Given and find the following:
ⓐ
ⓑ the domain of in interval notation
Answer
ⓐ
ⓑ
3.4-23 §3.4 source ↗
For the following exercises, use each set of functions to find Simplify your answers.
Given functions and state the domain of each of the following functions using interval notation:
ⓐ
ⓑ
ⓒ
Answer
ⓐ
ⓑ
ⓒ
3.4-25 §3.4 source ↗
For the following exercises, use each set of functions to find Simplify your answers.
For and write the domain of in interval notation.
Answer
3.4-27 §3.4 source ↗
For the following exercises, find functions and so the given function can be expressed as
Answer
3.4-29 §3.4 source ↗
For the following exercises, find functions and so the given function can be expressed as
Answer
3.4-31 §3.4 source ↗
For the following exercises, find functions and so the given function can be expressed as
Answer
3.4-33 §3.4 source ↗
For the following exercises, find functions and so the given function can be expressed as
Answer
3.4-35 §3.4 source ↗
For the following exercises, find functions and so the given function can be expressed as
Answer
3.4-37 §3.4 source ↗
For the following exercises, find functions and so the given function can be expressed as
Answer
3.4-39 §3.4 source ↗
For the following exercises, find functions and so the given function can be expressed as
Answer
3.4-41 §3.4 source ↗
For the following exercises, find functions and so the given function can be expressed as
Answer
3.4-43 §3.4 source ↗
For the following exercises, use the graphs of shown in Figure 4, and shown in Figure 5, to evaluate the expressions.
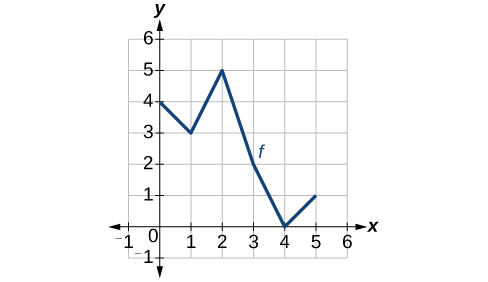 Figure 4
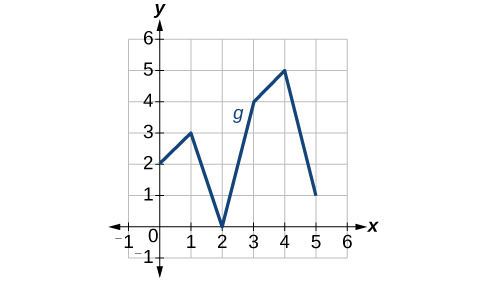 Figure 5
Answer
3.4-45 §3.4 source ↗
For the following exercises, use the graphs of shown in Figure 4, and shown in Figure 5, to evaluate the expressions.
Figure 4 Figure 5
Answer
3.4-47 §3.4 source ↗
For the following exercises, use the graphs of shown in Figure 4, and shown in Figure 5, to evaluate the expressions.
Figure 4 Figure 5
Answer
3.4-49 §3.4 source ↗
For the following exercises, use the graphs of shown in Figure 4, and shown in Figure 5, to evaluate the expressions.
Figure 4 Figure 5
Answer
3.4-51 §3.4 source ↗
For the following exercises, use graphs of shown in Figure 6, shown in Figure 7, and shown in Figure 8, to evaluate the expressions.
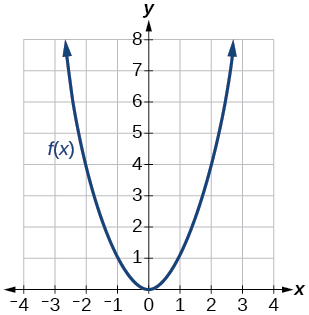 Figure 6
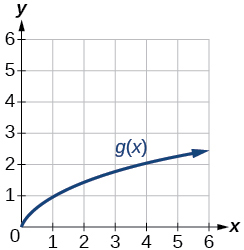 Figure 7
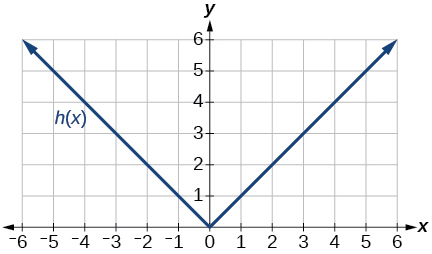 Figure 8
Answer
3.4-53 §3.4 source ↗
For the following exercises, use graphs of shown in Figure 6, shown in Figure 7, and shown in Figure 8, to evaluate the expressions.
Figure 6 Figure 7 Figure 8
Answer
3.4-55 §3.4 source ↗
For the following exercises, use graphs of shown in Figure 6, shown in Figure 7, and shown in Figure 8, to evaluate the expressions.
Figure 6 Figure 7 Figure 8
Answer
3.4-57 §3.4 source ↗
For the following exercises, use graphs of shown in Figure 6, shown in Figure 7, and shown in Figure 8, to evaluate the expressions.
Figure 6 Figure 7 Figure 8
Answer
3.4-59 §3.4 source ↗
For the following exercises, use the function values for shown in Table 3 to evaluate each expression.
| 0 | 7 | 9 |
| 1 | 6 | 5 |
| 2 | 5 | 6 |
| 3 | 8 | 2 |
| 4 | 4 | 1 |
| 5 | 0 | 8 |
| 6 | 2 | 7 |
| 7 | 1 | 3 |
| 8 | 9 | 4 |
| 9 | 3 | 0 |
Answer
3.4-61 §3.4 source ↗
For the following exercises, use the function values for shown in Table 3 to evaluate each expression.
| 0 | 7 | 9 |
| 1 | 6 | 5 |
| 2 | 5 | 6 |
| 3 | 8 | 2 |
| 4 | 4 | 1 |
| 5 | 0 | 8 |
| 6 | 2 | 7 |
| 7 | 1 | 3 |
| 8 | 9 | 4 |
| 9 | 3 | 0 |
Answer
3.4-63 §3.4 source ↗
For the following exercises, use the function values for shown in Table 3 to evaluate each expression.
| 0 | 7 | 9 |
| 1 | 6 | 5 |
| 2 | 5 | 6 |
| 3 | 8 | 2 |
| 4 | 4 | 1 |
| 5 | 0 | 8 |
| 6 | 2 | 7 |
| 7 | 1 | 3 |
| 8 | 9 | 4 |
| 9 | 3 | 0 |
Answer
3.4-65 §3.4 source ↗
For the following exercises, use the function values for shown in Table 3 to evaluate each expression.
| 0 | 7 | 9 |
| 1 | 6 | 5 |
| 2 | 5 | 6 |
| 3 | 8 | 2 |
| 4 | 4 | 1 |
| 5 | 0 | 8 |
| 6 | 2 | 7 |
| 7 | 1 | 3 |
| 8 | 9 | 4 |
| 9 | 3 | 0 |
Answer
3.4-67 §3.4 source ↗
For the following exercises, use the function values for shown in Table 4 to evaluate the expressions.
| 11 | ||
| 9 | ||
| 7 | 0 | |
| 0 | 5 | 1 |
| 1 | 3 | 0 |
| 2 | 1 | |
| 3 |
Answer
3.4-69 §3.4 source ↗
For the following exercises, use the function values for shown in Table 4 to evaluate the expressions.
| 11 | ||
| 9 | ||
| 7 | 0 | |
| 0 | 5 | 1 |
| 1 | 3 | 0 |
| 2 | 1 | |
| 3 |
Answer
3.4-71 §3.4 source ↗
For the following exercises, use the function values for shown in Table 4 to evaluate the expressions.
| 11 | ||
| 9 | ||
| 7 | 0 | |
| 0 | 5 | 1 |
| 1 | 3 | 0 |
| 2 | 1 | |
| 3 |
Answer
3.4-73 §3.4 source ↗
For the following exercises, use each pair of functions to find and
Answer
3.4-75 §3.4 source ↗
For the following exercises, use each pair of functions to find and
Answer
3.4-77 §3.4 source ↗
For the following exercises, use the functions and to evaluate or find the composite function as indicated.
Answer
3.4-79 §3.4 source ↗
For the following exercises, use the functions and to evaluate or find the composite function as indicated.
Answer
3.4-81 §3.4 source ↗
For the following exercises, use and
Find and
Answer
3.4-83 §3.4 source ↗
For the following exercises, use and
What is the domain of
Answer
3.4-85 §3.4 source ↗
For the following exercises, let and
True or False:
Answer
3.4-87 §3.4 source ↗
For the following exercises, find the composition when for all and
Answer
3.4-89 §3.4 source ↗
For the following exercises, find the composition when for all and
Answer
3.4-91 §3.4 source ↗
For the following exercises, find the composition when for all and
The function gives the pain level on a scale of 0 to 10 experienced by a patient with milligrams of a pain-reducing drug in her system. The milligrams of the drug in the patient’s system after minutes is modeled by Which of the following would you do in order to determine when the patient will be at a pain level of 4?
ⓐEvaluate
ⓑEvaluate
ⓒSolve
ⓓSolve
Answer
3.4-93 §3.4 source ↗
For the following exercises, find the composition when for all and
A rain drop hitting a lake makes a circular ripple. If the radius, in inches, grows as a function of time in minutes according to find the area of the ripple as a function of time. Find the area of the ripple at
Answer
3.4-95 §3.4 source ↗
For the following exercises, find the composition when for all and
Use the function you found in the previous exercise to find the total area burned after 5 minutes.
Answer
3.4-97 §3.4 source ↗
For the following exercises, find the composition when for all and
The number of bacteria in a refrigerated food product is given by where is the temperature of the food. When the food is removed from the refrigerator, the temperature is given by where is the time in hours.
ⓐFind the composite function
ⓑFind the time (round to two decimal places) when the bacteria count reaches 6752.
Answer
ⓐ
ⓑ 3.38 hours
Try It #1 §3.5 source ↗
Answer
Try It #2 §3.5 source ↗
Answer
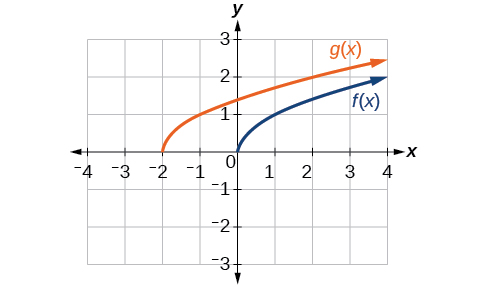
The graphs of and are shown below. The transformation is a horizontal shift. The function is shifted to the left by 2 units.
Try It #3 §3.5 source ↗
Answer
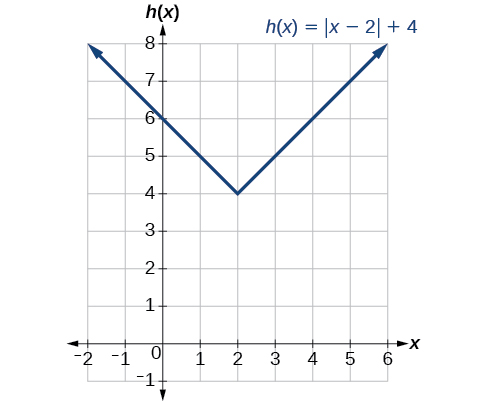
Try It #4 §3.5 source ↗
Answer
Try It #5 §3.5 source ↗
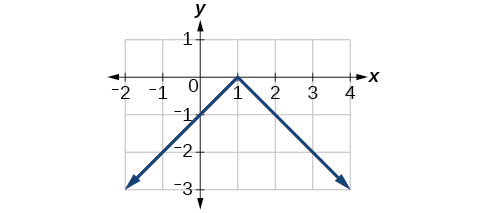
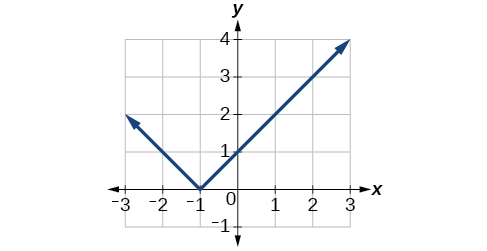
Answer
ⓐ 
ⓑ 
Try It #6 §3.5 source ↗
A function is given as Table 9. Create a table for the functions below.
ⓐ
ⓑ
| −2 | 0 | 2 | 4 | |
| 5 | 10 | 15 | 20 |
Answer
ⓐ
| -2 | 0 | 2 | 4 | |
ⓑ
| -2 | 0 | 2 | 4 | |
| 15 | 10 | 5 | unknown |
Try It #7 §3.5 source ↗
Answer
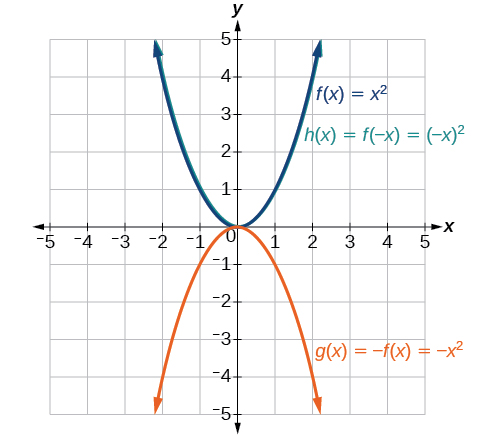
Notice: looks the same as .
Try It #8 §3.5 source ↗
Answer
Try It #9 §3.5 source ↗
A function is given as Table 12. Create a table for the function
| 2 | 4 | 6 | 8 | |
| 12 | 16 | 20 | 0 |
Answer
| 2 | 4 | 6 | 8 | |
| 9 | 12 | 15 | 0 |
Try It #10 §3.5 source ↗
Answer
Try It #11 §3.5 source ↗
Answer
3.5-1 §3.5 source ↗
Answer
3.5-3 §3.5 source ↗
Answer
3.5-5 §3.5 source ↗
Answer
3.5-7 §3.5 source ↗
For the following exercises, write a formula for the function obtained when the graph is shifted as described.
is shifted down 3 units and to the right 1 unit.
Answer
3.5-9 §3.5 source ↗
For the following exercises, write a formula for the function obtained when the graph is shifted as described.
is shifted up 2 units and to the left 4 units.
Answer
3.5-11 §3.5 source ↗
For the following exercises, describe how the graph of the function is a transformation of the graph of the original function
Answer
3.5-13 §3.5 source ↗
For the following exercises, describe how the graph of the function is a transformation of the graph of the original function
Answer
3.5-15 §3.5 source ↗
For the following exercises, describe how the graph of the function is a transformation of the graph of the original function
Answer
3.5-17 §3.5 source ↗
For the following exercises, describe how the graph of the function is a transformation of the graph of the original function
Answer
3.5-19 §3.5 source ↗
For the following exercises, describe how the graph of the function is a transformation of the graph of the original function
Answer
3.5-21 §3.5 source ↗
For the following exercises, determine the interval(s) on which the function is increasing and decreasing.
Answer
3.5-23 §3.5 source ↗
For the following exercises, determine the interval(s) on which the function is increasing and decreasing.
Answer
3.5-25 §3.5 source ↗
For the following exercises, use the graph of shown in Figure 31 to sketch a graph of each transformation of
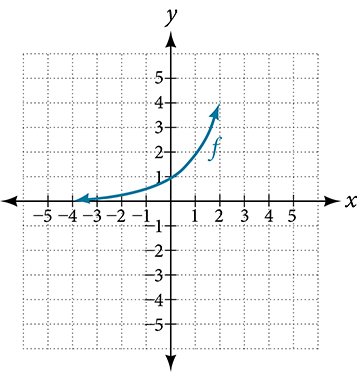 Figure 31
Answer
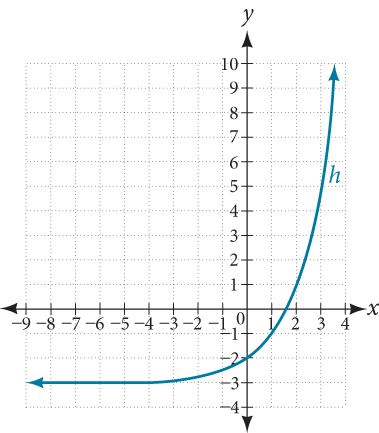
3.5-27 §3.5 source ↗
For the following exercises, sketch a graph of the function as a transformation of the graph of one of the toolkit functions.
Answer
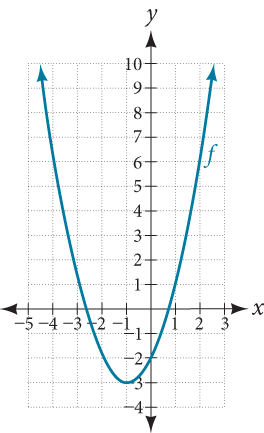
3.5-29 §3.5 source ↗
For the following exercises, sketch a graph of the function as a transformation of the graph of one of the toolkit functions.
Answer
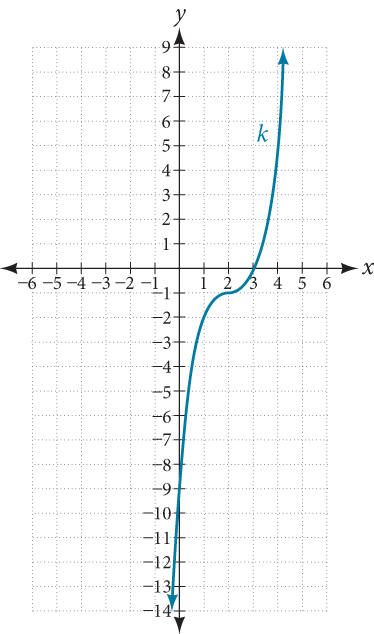
3.5-31 §3.5 source ↗
For the following exercises, sketch a graph of the function as a transformation of the graph of one of the toolkit functions.
Tabular representations for the functions and are given below. Write and as transformations of
| −2 | −1 | 0 | 1 | 2 | |
| −2 | −1 | −3 | 1 | 2 |
| −1 | 0 | 1 | 2 | 3 | |
| −2 | −1 | −3 | 1 | 2 |
| −2 | −1 | 0 | 1 | 2 | |
| −1 | 0 | −2 | 2 | 3 |
Answer
3.5-33 §3.5 source ↗
For the following exercises, write an equation for each graphed function by using transformations of the graphs of one of the toolkit functions.
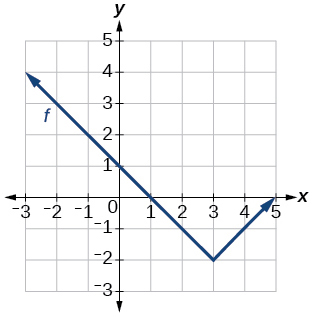
Answer
3.5-35 §3.5 source ↗
For the following exercises, write an equation for each graphed function by using transformations of the graphs of one of the toolkit functions.
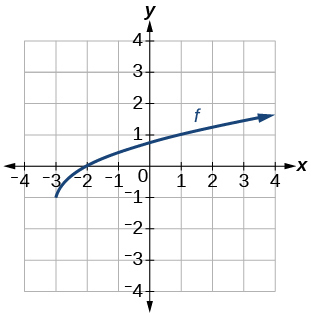
Answer
3.5-37 §3.5 source ↗
For the following exercises, write an equation for each graphed function by using transformations of the graphs of one of the toolkit functions.
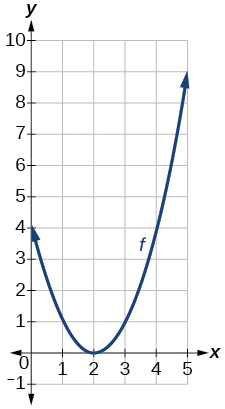
Answer
3.5-39 §3.5 source ↗
For the following exercises, write an equation for each graphed function by using transformations of the graphs of one of the toolkit functions.
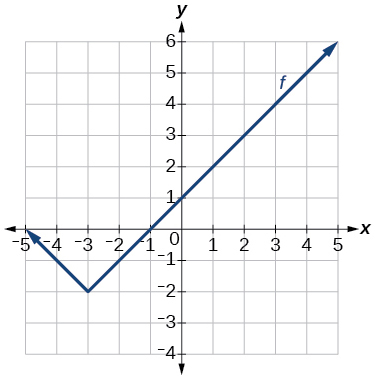
Answer
3.5-41 §3.5 source ↗
For the following exercises, use the graphs of transformations of the square root function to find a formula for each of the functions.
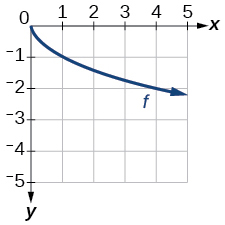
Answer
3.5-43 §3.5 source ↗
For the following exercises, use the graphs of the transformed toolkit functions to write a formula for each of the resulting functions.
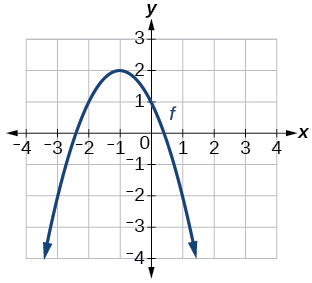
Answer
3.5-45 §3.5 source ↗
For the following exercises, use the graphs of the transformed toolkit functions to write a formula for each of the resulting functions.
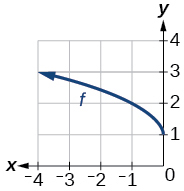
Answer
3.5-47 §3.5 source ↗
For the following exercises, determine whether the function is odd, even, or neither.
Answer
3.5-49 §3.5 source ↗
For the following exercises, determine whether the function is odd, even, or neither.
Answer
3.5-51 §3.5 source ↗
For the following exercises, determine whether the function is odd, even, or neither.
Answer
3.5-53 §3.5 source ↗
For the following exercises, describe how the graph of each function is a transformation of the graph of the original function
Answer
3.5-55 §3.5 source ↗
For the following exercises, describe how the graph of each function is a transformation of the graph of the original function
Answer
3.5-57 §3.5 source ↗
For the following exercises, describe how the graph of each function is a transformation of the graph of the original function
Answer
3.5-59 §3.5 source ↗
For the following exercises, describe how the graph of each function is a transformation of the graph of the original function
Answer
3.5-61 §3.5 source ↗
For the following exercises, describe how the graph of each function is a transformation of the graph of the original function
Answer
3.5-63 §3.5 source ↗
For the following exercises, write a formula for the function that results when the graph of a given toolkit function is transformed as described.
The graph of is reflected over the -axis and horizontally compressed by a factor of .
Answer
3.5-65 §3.5 source ↗
For the following exercises, write a formula for the function that results when the graph of a given toolkit function is transformed as described.
The graph of is vertically compressed by a factor of then shifted to the left 2 units and down 3 units.
Answer
3.5-67 §3.5 source ↗
For the following exercises, write a formula for the function that results when the graph of a given toolkit function is transformed as described.
The graph of is vertically compressed by a factor of then shifted to the right 5 units and up 1 unit.
Answer
3.5-69 §3.5 source ↗
For the following exercises, describe how the formula is a transformation of a toolkit function. Then sketch a graph of the transformation.
Answer
The graph of the function is shifted to the left 1 unit, stretched vertically by a factor of 4, and shifted down 5 units.
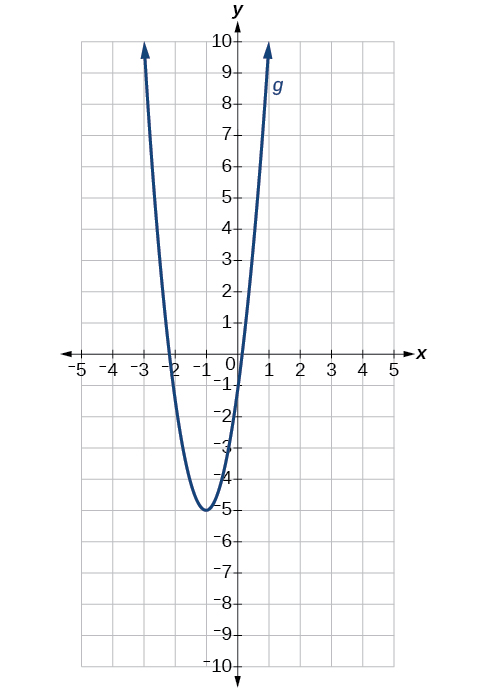
3.5-71 §3.5 source ↗
For the following exercises, describe how the formula is a transformation of a toolkit function. Then sketch a graph of the transformation.
Answer
The graph of is stretched vertically by a factor of 2, shifted horizontally 4 units to the right, reflected across the horizontal axis, and then shifted vertically 3 units up.
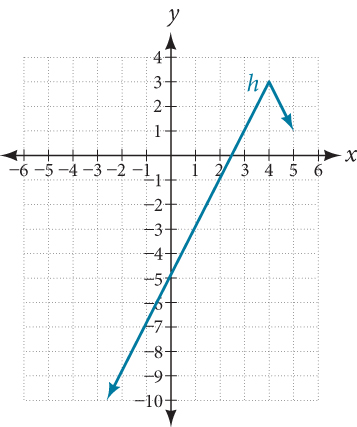
3.5-73 §3.5 source ↗
For the following exercises, describe how the formula is a transformation of a toolkit function. Then sketch a graph of the transformation.
Answer
The graph of the function is compressed vertically by a factor of
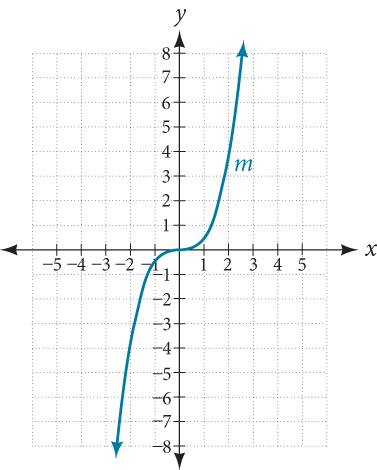
3.5-75 §3.5 source ↗
For the following exercises, describe how the formula is a transformation of a toolkit function. Then sketch a graph of the transformation.
Answer
The graph of the function is stretched horizontally by a factor of 3 and then shifted vertically downward by 3 units.
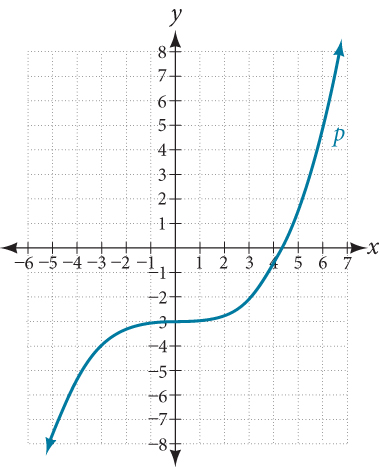
3.5-77 §3.5 source ↗
For the following exercises, describe how the formula is a transformation of a toolkit function. Then sketch a graph of the transformation.
Answer
The graph of is reflected across the y-axis and then shifted right 4 units.
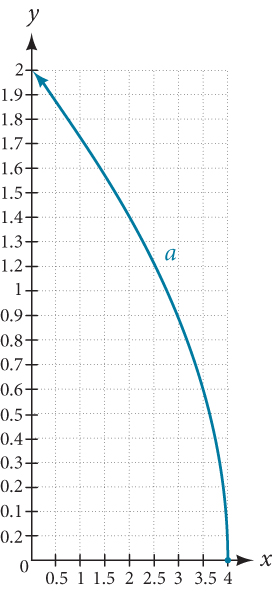
3.5-79 §3.5 source ↗
For the following exercises, use the graph in Figure 32 to sketch the given transformations.
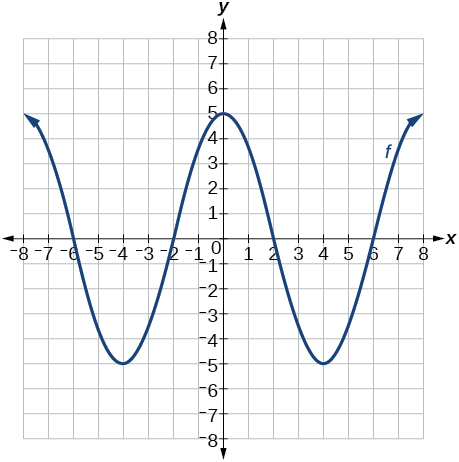 Figure 32
Answer
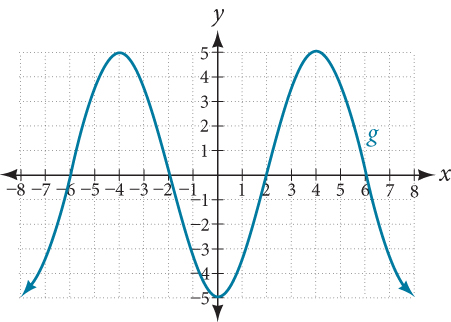
3.5-81 §3.5 source ↗
For the following exercises, use the graph in Figure 32 to sketch the given transformations.
Figure 32
Answer
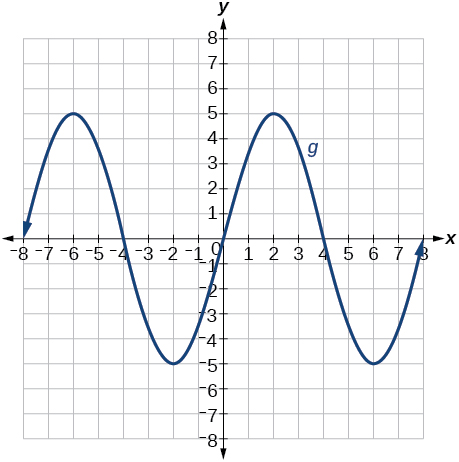
Try It #1 §3.6 source ↗
Answer
Try It #2 §3.6 source ↗
Answer
Try It #3 §3.6 source ↗
Answer
3.6-1 §3.6 source ↗
Answer
3.6-3 §3.6 source ↗
Answer
3.6-5 §3.6 source ↗
Answer
3.6-7 §3.6 source ↗
Answer
3.6-9 §3.6 source ↗
For the following exercises, find the x- and y-intercepts of the graphs of each function.
Answer
3.6-11 §3.6 source ↗
For the following exercises, find the x- and y-intercepts of the graphs of each function.
Answer
3.6-13 §3.6 source ↗
For the following exercises, find the x- and y-intercepts of the graphs of each function.
Answer
3.6-15 §3.6 source ↗
For the following exercises, find the x- and y-intercepts of the graphs of each function.
Answer
3.6-17 §3.6 source ↗
For the following exercises, graph the absolute value function. Plot at least five points by hand for each graph.
Answer
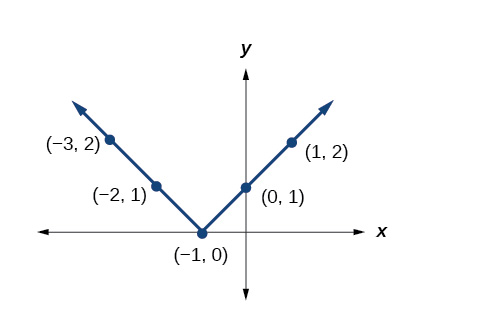
3.6-19 §3.6 source ↗
For the following exercises, graph the given functions by hand.
Answer
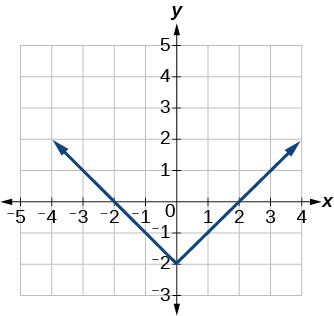
3.6-21 §3.6 source ↗
For the following exercises, graph the given functions by hand.
Answer
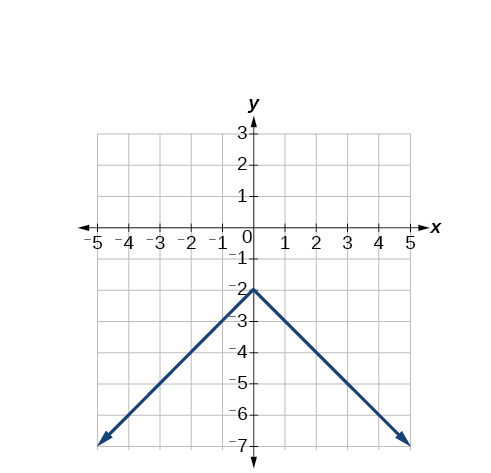
3.6-23 §3.6 source ↗
For the following exercises, graph the given functions by hand.
Answer
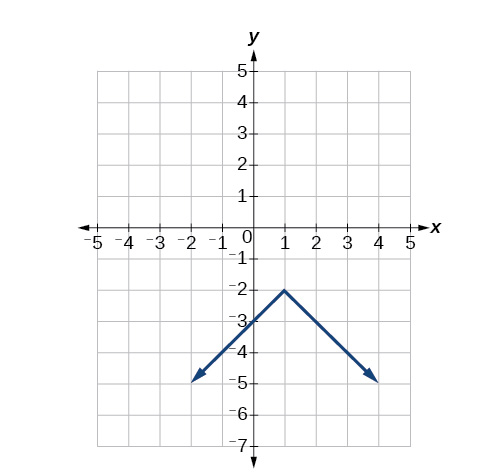
3.6-25 §3.6 source ↗
For the following exercises, graph the given functions by hand.
Answer
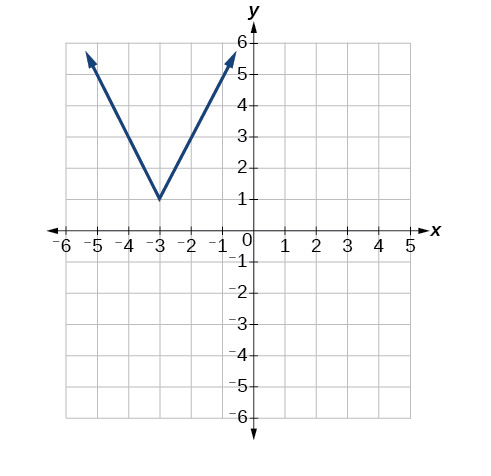
3.6-27 §3.6 source ↗
For the following exercises, graph the given functions by hand.
Answer
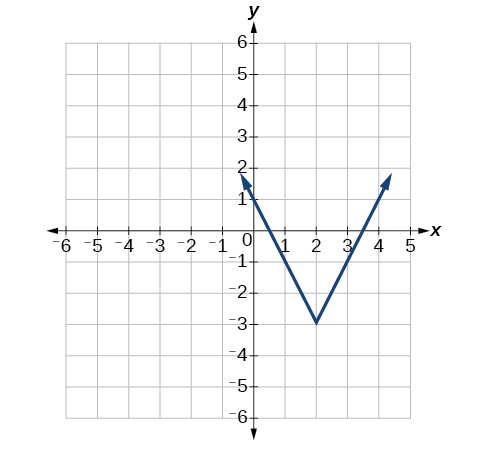
3.6-29 §3.6 source ↗
For the following exercises, graph the given functions by hand.
Answer
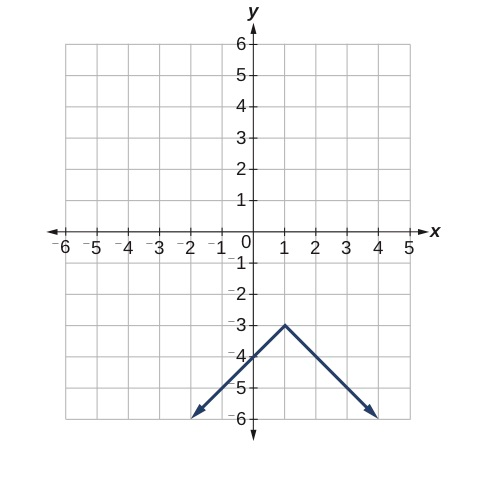
3.6-31 §3.6 source ↗
For the following exercises, graph the given functions by hand.
Answer
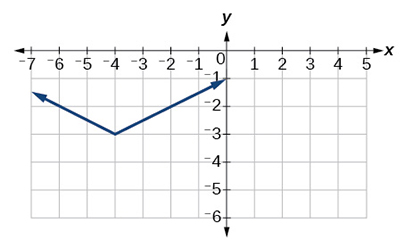
3.6-33 §3.6 source ↗
For the following exercises, graph the given functions by hand.
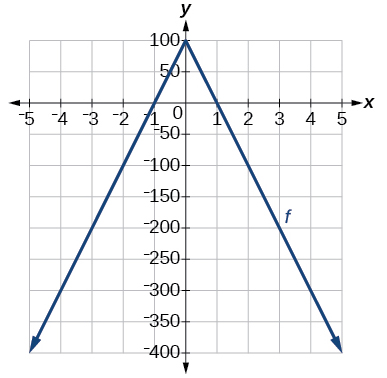
Use a graphing utility to graph on the viewing window Identify the corresponding range. Show the graph.
Answer
range:
3.6-35 §3.6 source ↗
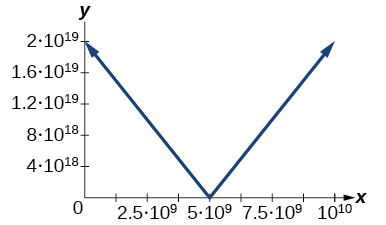
For the following exercises, graph each function using a graphing utility. Specify the viewing window.
Answer
3.6-37 §3.6 source ↗
For the following exercises, solve the inequality.
If possible, find all values of such that there are no -intercepts for
Answer
3.6-39 §3.6 source ↗
For the following exercises, solve the inequality.
The true proportion of people who give a favorable rating to Congress is 8% with a margin of error of 1.5%. Describe this statement using an absolute value equation.
Answer
3.6-41 §3.6 source ↗
For the following exercises, solve the inequality.
A machinist must produce a bearing that is within 0.01 inches of the correct diameter of 5.0 inches. Using as the diameter of the bearing, write this statement using absolute value notation.
Answer
Try It #1 §3.7 source ↗
Answer
Try It #2 §3.7 source ↗
Answer
Try It #3 §3.7 source ↗
Answer
Try It #4 §3.7 source ↗
Answer
Try It #5 §3.7 source ↗
Using Table 4, find and interpret ⓐ and ⓑ
| 30 | 50 | 60 | 70 | 90 | |
| 20 | 40 | 50 | 60 | 70 |
Answer
ⓐ In 60 minutes, 50 miles are traveled.
ⓑ To travel 60 miles, it will take 70 minutes.
Try It #6 §3.7 source ↗
Answer
ⓐ 3
ⓑ 5.6
Try It #7 §3.7 source ↗
Answer
Try It #8 §3.7 source ↗
Answer
Try It #9 §3.7 source ↗
Answer
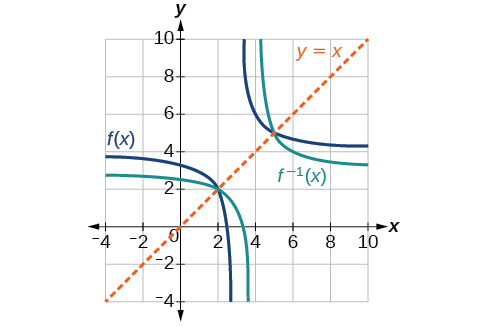
3.7-1 §3.7 source ↗
Answer
3.7-3 §3.7 source ↗
Answer
3.7-5 §3.7 source ↗
Answer
3.7-7 §3.7 source ↗
For the following exercises, find for each function.
Answer
3.7-9 §3.7 source ↗
For the following exercises, find for each function.
Answer
3.7-11 §3.7 source ↗
For the following exercises, find for each function.
Answer
3.7-13 §3.7 source ↗
For the following exercises, find a domain on which each function is one-to-one and non-decreasing. Write the domain in interval notation. Then find the inverse of restricted to that domain.
Answer
3.7-15 §3.7 source ↗
For the following exercises, find a domain on which each function is one-to-one and non-decreasing. Write the domain in interval notation. Then find the inverse of restricted to that domain.
Answer
3.7-16 §3.7 source ↗
For the following exercises, find a domain on which each function is one-to-one and non-decreasing. Write the domain in interval notation. Then find the inverse of restricted to that domain.
Given and
ⓐFind and
ⓑWhat does the answer tell us about the relationship between and
Answer
ⓐ and
ⓑThis tells us that and are inverse functions
3.7-17 §3.7 source ↗
For the following exercises, use function composition to verify that and are inverse functions.
and
Answer
3.7-19 §3.7 source ↗
For the following exercises, use a graphing utility to determine whether each function is one-to-one.
Answer
3.7-21 §3.7 source ↗
For the following exercises, use a graphing utility to determine whether each function is one-to-one.
Answer
3.7-23 §3.7 source ↗
For the following exercises, determine whether the graph represents a one-to-one function.
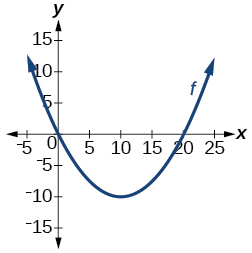
Answer
3.7-25 §3.7 source ↗
For the following exercises, use the graph of shown in Figure 11.
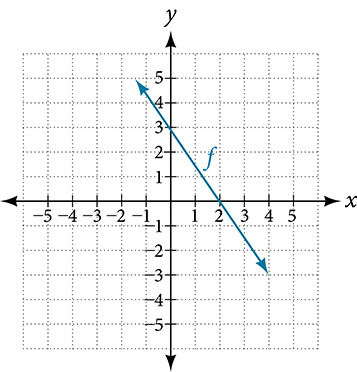 Figure 11
Find
Answer
3.7-27 §3.7 source ↗
For the following exercises, use the graph of shown in Figure 11.
Figure 11 Find
Answer
3.7-29 §3.7 source ↗
For the following exercises, use the graph of the one-to-one function shown in Figure 12.
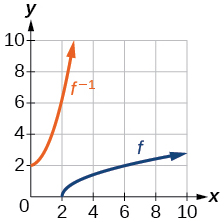
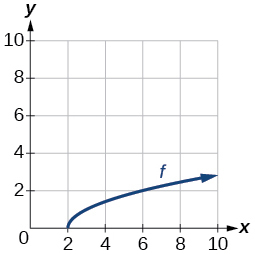 Figure 12
Sketch the graph of
Answer
3.7-31 §3.7 source ↗
For the following exercises, use the graph of the one-to-one function shown in Figure 12.
Figure 12 If the complete graph of is shown, find the domain of
Answer
3.7-33 §3.7 source ↗
For the following exercises, evaluate or solve, assuming that the function is one-to-one.
If find
Answer
3.7-35 §3.7 source ↗
For the following exercises, evaluate or solve, assuming that the function is one-to-one.
If find
Answer
3.7-37 §3.7 source ↗
For the following exercises, use the values listed in Table 6 to evaluate or solve.
| 0 | 1 | 2 | 3 | 4 | 5 | 6 | 7 | 8 | 9 | |
| 8 | 0 | 7 | 4 | 2 | 6 | 5 | 3 | 9 | 1 |
Find
Answer
3.7-39 §3.7 source ↗
For the following exercises, use the values listed in Table 6 to evaluate or solve.
| 0 | 1 | 2 | 3 | 4 | 5 | 6 | 7 | 8 | 9 | |
| 8 | 0 | 7 | 4 | 2 | 6 | 5 | 3 | 9 | 1 |
Find
Answer
3.7-41 §3.7 source ↗
For the following exercises, use the values listed in Table 6 to evaluate or solve.
| 0 | 1 | 2 | 3 | 4 | 5 | 6 | 7 | 8 | 9 | |
| 8 | 0 | 7 | 4 | 2 | 6 | 5 | 3 | 9 | 1 |
Use the tabular representation of in Table 7 to create a table for
| 3 | 6 | 9 | 13 | 14 | |
| 1 | 4 | 7 | 12 | 16 |
Answer
| 1 | 4 | 7 | 12 | 16 | |
| 3 | 6 | 9 | 13 | 14 |
3.7-43 §3.7 source ↗
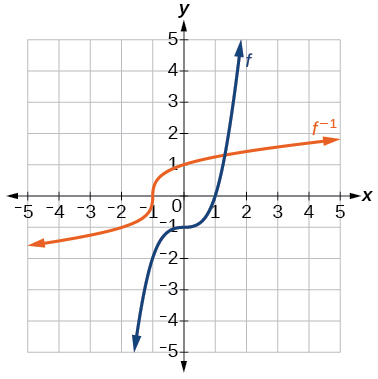
For the following exercises, find the inverse function. Then, graph the function and its inverse.
Answer
3.7-45 §3.7 source ↗
For the following exercises, find the inverse function. Then, graph the function and its inverse.
To convert from degrees Celsius to degrees Fahrenheit, we use the formula Find the inverse function, if it exists, and explain its meaning.
Answer
3.7-47 §3.7 source ↗
For the following exercises, find the inverse function. Then, graph the function and its inverse.
A car travels at a constant speed of 50 miles per hour. The distance the car travels in miles is a function of time, in hours given by Find the inverse function by expressing the time of travel in terms of the distance traveled. Call this function Find and interpret its meaning.
Answer
3.R-1 §3.R source ↗
For the following exercises, determine whether the relation is a function.
Answer
3.R-3 §3.R source ↗
For the following exercises, determine whether the relation is a function.
for the independent variable and the dependent variable
Answer
3.R-5 §3.R source ↗
For the following exercises, evaluate
Answer
3.R-7 §3.R source ↗
For the following exercises, determine whether the functions are one-to-one.
Answer
3.R-9 §3.R source ↗
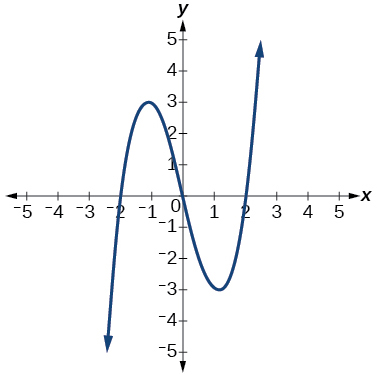
For the following exercises, use the vertical line test to determine if the relation whose graph is provided is a function.
Answer
3.R-11 §3.R source ↗
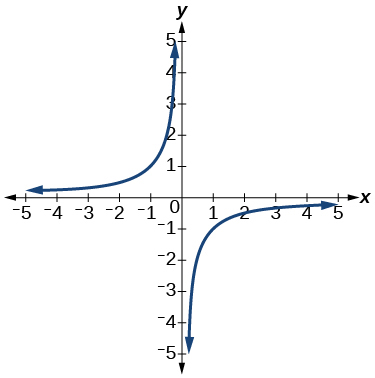
For the following exercises, use the vertical line test to determine if the relation whose graph is provided is a function.
Answer
3.R-13 §3.R source ↗
For the following exercises, graph the functions.
Answer
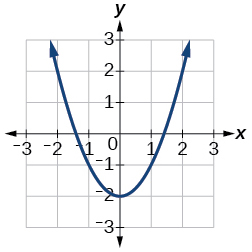
3.R-15 §3.R source ↗
For the following exercises, use Figure 2 to approximate the values.
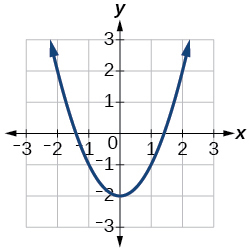 Figure 2
Answer
3.R-17 §3.R source ↗
For the following exercises, use Figure 2 to approximate the values.
Figure 2 If then solve for
Answer
3.R-19 §3.R source ↗
For the following exercises, use the function to find the values in simplest form.
Answer
3.R-21 §3.R source ↗
For the following exercises, find the domain of each function, expressing answers using interval notation.
Answer
3.R-23 §3.R source ↗
For the following exercises, find the domain of each function, expressing answers using interval notation.
Graph this piecewise function:
Answer
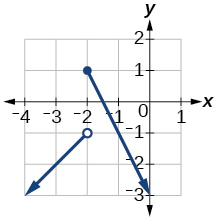
3.R-25 §3.R source ↗
For the following exercises, find the average rate of change of the functions from
Answer
3.R-27 §3.R source ↗
For the following exercises, use the graphs to determine the intervals on which the functions are increasing, decreasing, or constant.
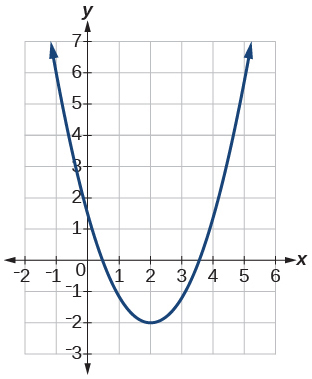
Answer
3.R-29 §3.R source ↗
For the following exercises, use the graphs to determine the intervals on which the functions are increasing, decreasing, or constant.
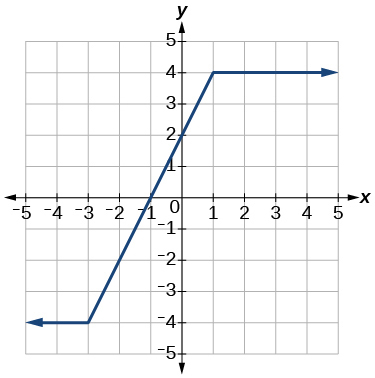
Answer
3.R-31 §3.R source ↗
For the following exercises, use the graphs to determine the intervals on which the functions are increasing, decreasing, or constant.
Find the local extrema for the function graphed in Exercise 3.28.
Answer
3.R-33 §3.R source ↗
For the following exercises, use the graphs to determine the intervals on which the functions are increasing, decreasing, or constant.
Find the absolute maximum of the function graphed in Figure 3.
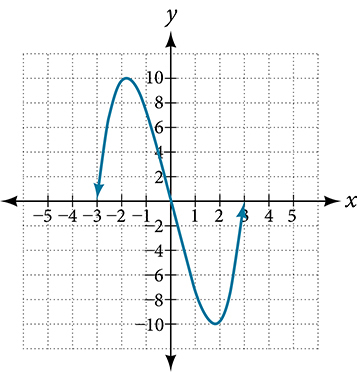 Figure 3
Answer
3.R-35 §3.R source ↗
For the following exercises, find and for each pair of functions.
Answer
3.R-37 §3.R source ↗
For the following exercises, find and for each pair of functions.
Answer
3.R-39 §3.R source ↗
For the following exercises, find and the domain for for each pair of functions.
Answer
3.R-41 §3.R source ↗
For the following exercises, find and the domain for for each pair of functions.
Answer
3.R-43 §3.R source ↗
For the following exercises, express each function as a composition of two functions and where
Answer
3.R-45 §3.R source ↗
For the following exercises, sketch a graph of the given function.
Answer
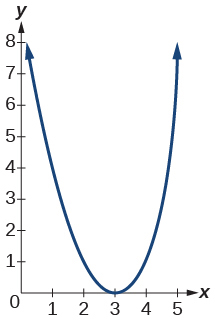
3.R-47 §3.R source ↗
For the following exercises, sketch a graph of the given function.
Answer
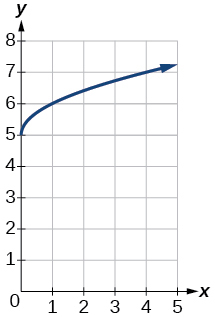
3.R-49 §3.R source ↗
For the following exercises, sketch a graph of the given function.
Answer
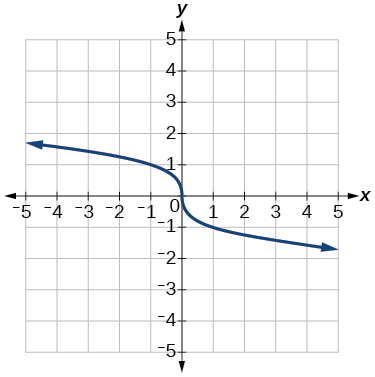
3.R-51 §3.R source ↗
For the following exercises, sketch a graph of the given function.
Answer
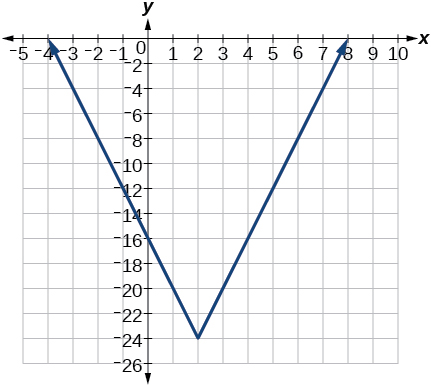
3.R-53 §3.R source ↗
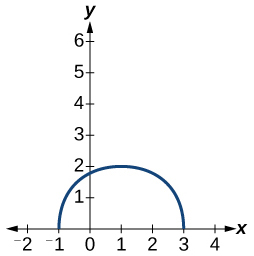
For the following exercises, sketch the graph of the function if the graph of the function is shown in Figure 4.
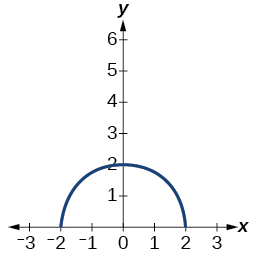 Figure 4
Answer
3.R-55 §3.R source ↗
For the following exercises, write the equation for the standard function represented by each of the graphs below.
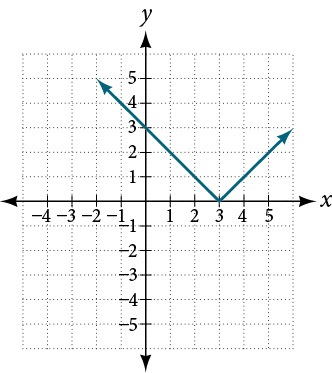
Answer
3.R-57 §3.R source ↗
For the following exercises, determine whether each function below is even, odd, or neither.
Answer
3.R-59 §3.R source ↗
For the following exercises, determine whether each function below is even, odd, or neither.
Answer
3.R-61 §3.R source ↗
For the following exercises, analyze the graph and determine whether the graphed function is even, odd, or neither.
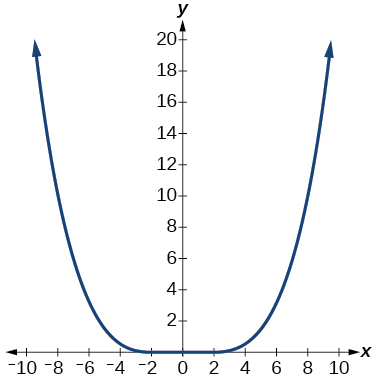
Answer
3.R-63 §3.R source ↗
For the following exercises, write an equation for the transformation of
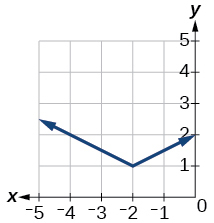
Answer
3.R-65 §3.R source ↗
For the following exercises, write an equation for the transformation of
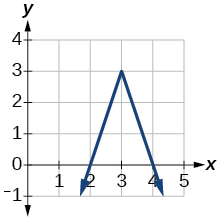
Answer
3.R-67 §3.R source ↗
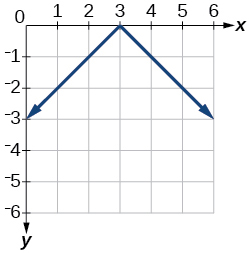
For the following exercises, graph the absolute value function.
Answer
3.R-69 §3.R source ↗
For the following exercises, find for each function.
Answer
3.R-71 §3.R source ↗
For the following exercise, find a domain on which the function is one-to-one and non-decreasing. Write the domain in interval notation. Then find the inverse of restricted to that domain.
Answer
3.R-73 §3.R source ↗
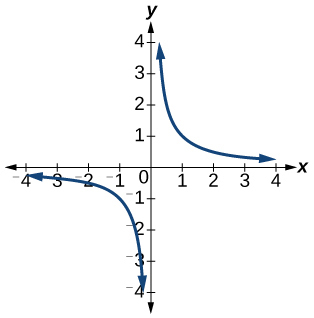
For the following exercises, use a graphing utility to determine whether each function is one-to-one.
Answer
The function is one-to-one.
3.R-75 §3.R source ↗
For the following exercises, use a graphing utility to determine whether each function is one-to-one.
If find
Answer
3.T-1 §3.T source ↗
For the following exercises, determine whether each of the following relations is a function.
Answer
3.T-3 §3.T source ↗
For the following exercises, evaluate the function at the given input.
Answer
3.T-5 §3.T source ↗
For the following exercises, evaluate the function at the given input.
Show that the function is not one-to-one.
Answer
3.T-7 §3.T source ↗
For the following exercises, evaluate the function at the given input.
Given find in simplest form.
Answer
3.T-9 §3.T source ↗
For the following exercises, evaluate the function at the given input.
Find the average rate of change of the function by finding in simplest form.
Answer
3.T-11 §3.T source ↗
For the following exercises, use the functions to find the composite functions.
Answer
3.T-13 §3.T source ↗
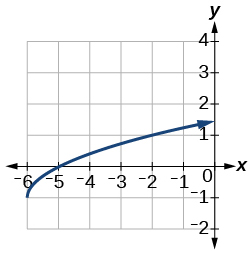
For the following exercises, graph the functions by translating, stretching, and/or compressing a toolkit function.
Answer
3.T-15 §3.T source ↗
For the following exercises, determine whether the functions are even, odd, or neither.
Answer
3.T-17 §3.T source ↗
For the following exercises, determine whether the functions are even, odd, or neither.
Answer
3.T-19 §3.T source ↗
For the following exercises, find the inverse of the function.
Answer
3.T-21 §3.T source ↗
For the following exercises, use the graph of shown in Figure 1.
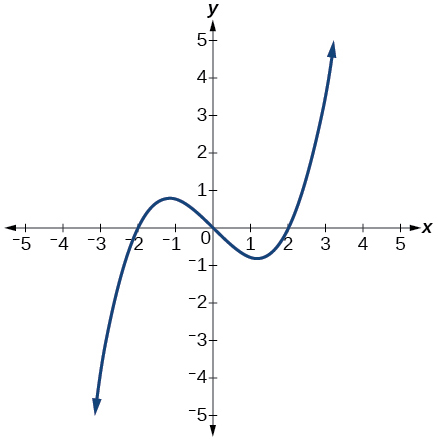 Figure 1
On what intervals is the function increasing?
Answer
3.T-23 §3.T source ↗
For the following exercises, use the graph of shown in Figure 1.
Figure 1 Approximate the local minimum of the function. Express the answer as an ordered pair. The ordered pair should include both the value as well as the value.
Answer
3.T-25 §3.T source ↗
For the following exercises, use the graph of the piecewise function shown in Figure 2.
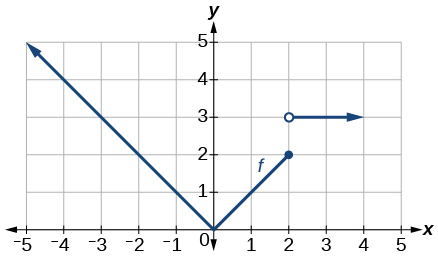 Figure 2
Find
Answer
3.T-27 §3.T source ↗
For the following exercises, use the graph of the piecewise function shown in Figure 2.
Figure 2 Write an equation for the piecewise function.
Answer
3.T-29 §3.T source ↗
For the following exercises, use the values listed in Table 1.
| 0 | 1 | 2 | 3 | 4 | 5 | 6 | 7 | 8 | |
| 1 | 3 | 5 | 7 | 9 | 11 | 13 | 15 | 17 |
Solve the equation
Answer
3.T-31 §3.T source ↗
For the following exercises, use the values listed in Table 1.
| 0 | 1 | 2 | 3 | 4 | 5 | 6 | 7 | 8 | |
| 1 | 3 | 5 | 7 | 9 | 11 | 13 | 15 | 17 |
Is the function represented by the graph one-to-one?
Answer
3.T-33 §3.T source ↗
For the following exercises, use the values listed in Table 1.
| 0 | 1 | 2 | 3 | 4 | 5 | 6 | 7 | 8 | |
| 1 | 3 | 5 | 7 | 9 | 11 | 13 | 15 | 17 |
Given find
Answer
Loading chapter 4…
Problems and answers are adapted from Algebra and Trigonometry 2e by Jay Abramson, OpenStax, and are used under the CC BY-NC-SA 4.0 licence. Access for free at https://openstax.org/books/algebra-and-trigonometry-2e/pages/1-introduction-to-prerequisites. Illustrations: Copyright Rice University, OpenStax, under CC BY-NC-SA 4.0 license. This adaptation is released under the same licence, is non-commercial, and is neither affiliated with nor endorsed by OpenStax or Rice University.