Every problem in the chapter beside the book’s answer, a chapter at a time as you scroll.

Chapter 11: Graphs

276 problems · 170 figures

Be Prepared 11.1 §11.1 source ↗

Evaluate: x+3 when x=−1.
If you missed this problem, review Example 3.23.
Example 3.23 in the book ↗

Answer

2

Be Prepared 11.2 §11.1 source ↗

Evaluate: 2x−5y when x=3,y=−2.
If you missed this problem, review Example 3.56.
Example 3.56 in the book ↗

Answer

16

Be Prepared 11.3 §11.1 source ↗

Solve for y:40−4y=20.
If you missed this problem, review Example 8.20.
Example 8.20 in the book ↗

Answer

5

Try It 11.1 §11.1 source ↗

Use the map in Figure 11.2.

ⓐ Find the grid section of Taylor Hall.

ⓑ What is located in section 3B?

Figure 11.2 in the book ↗

Answer

ⓐ 1C

ⓑ Engineering Building

Try It 11.2 §11.1 source ↗

Use the map in Figure 11.2.

ⓐ Find the grid section of the Parking Garage.

ⓑ What is located in section 2C?

Figure 11.2 in the book ↗

Answer

ⓐ 1A

ⓑ Library

Try It 11.3 §11.1 source ↗

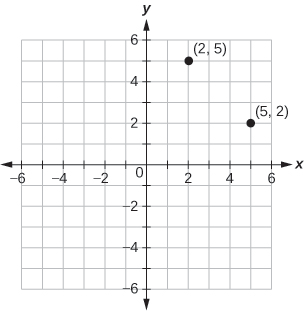
Plot each point on the same rectangular coordinate system: (5,2), (2,5).

Answer


This answer graph shows the x y-coordinate plane. The x and y-axis each run from -6 to 6. There are two labeled points: the first is ordered pair (5, 2), and the second is (2, 5)

Try It 11.4 §11.1 source ↗

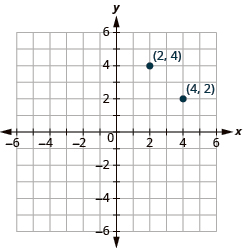
Plot each point on the same rectangular coordinate system: (4,2), (2,4).

Answer


This answer graph shows the x y-coordinate plane. The x and y-axis each run from -6 to 6. There are two labeled points: the first is ordered pair (2, 4), and the second is (4, 2)

Try It 11.5 §11.1 source ↗

Plot each point on a rectangular coordinate system and identify the quadrant in which the point is located.

ⓐ (−2,1)

ⓑ (−3,−1)

ⓒ (4,−4)

ⓓ (−4,32)

Answer

(a) Quadrant II, (b) Quadrant III, (c) Quadrant IV, (d) Quadrant II
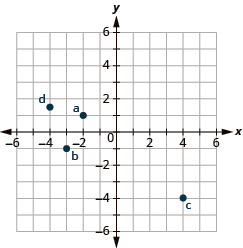

The graph shows the x y-coordinate plane. The x and y-axis each run from -6 to 6. The point “ordered pair -2, 1” is labeled “a”. The point “ordered pair -3, 1” is labeled “b”. The point “ordered pair 4, -4 is labeled “c”. The point “ordered pair -4, 3/2” is labeled “d”.

Try It 11.6 §11.1 source ↗

Plot each point on a rectangular coordinate system and identify the quadrant in which the point is located.

ⓐ (−4,1)

ⓑ (−2,3)

ⓒ (2,−5)

ⓓ (−3,52)

Answer

(a) Quadrant II, (b) Quadrant II, (c) Quadrant IV, (d) Quadrant II
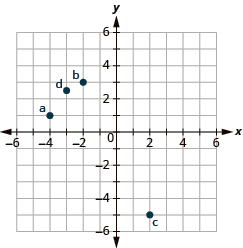

This image is an answer graph and shows the x y-coordinate plane. The x and y-axis each run from -6 to 6. The point “ordered pair -4, 1” is labeled “a”. The point “ordered pair -2, 3” is labeled “b”. The point “ordered pair 2, -5” is labeled “c”. The point “ordered pair -3, 5/2” is labeled “d”.

Try It 11.7 §11.1 source ↗

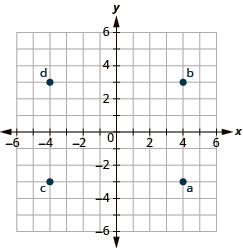
Plot each point:

ⓐ (4,−3)

ⓑ (4,3)

ⓒ (−4,−3)

ⓓ (−4,3)

Answer


This image is an answer graph and shows the x y-coordinate plane. The x and y-axis each run from -6 to 6. The point “ordered pair 4, -3” is labeled “a”. The point “ordered pair 4, 3” is labeled “b”. The point “ordered pair -4, -3” is labeled “c”. The point “ordered pair -4, 3” is labeled “d”.

Try It 11.8 §11.1 source ↗

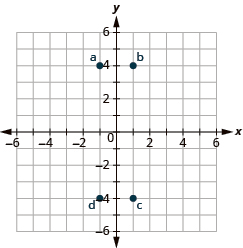
Plot each point:

ⓐ (−1,4)

ⓑ (1,4)

ⓒ (1,−4)

ⓓ (−1,−4)

Answer


This image is an answer graph and shows the x y-coordinate plane. The x and y-axis each run from -6 to 6. The point “ordered pair -1, -4” is labeled “a”. The point “ordered pair 1, 4” is labeled “b”. The point “ordered pair 1, -4” is labeled “c”. The point “ordered pair -1, -4” is labeled “d”.

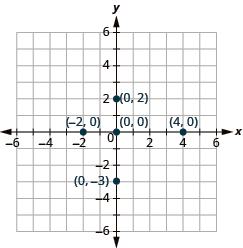
Try It 11.9 §11.1 source ↗

Plot each point on a coordinate grid:

ⓐ (4,0)

ⓑ (−2,0)

ⓒ (0,0)

ⓓ (0,2)

ⓔ (0,−3)

Answer


This image is an answer graph and shows the x y-coordinate plane. The x and y-axis each run from -6 to 6. The point for ordered pair 4, 0 is plotted. The point for ordered pair -2, 0 is plotted. The point for ordered pair 0,0 is plotted. The point for ordered pair 0, 2 is plotted. The point for ordered pair 0,-3 is plotted.

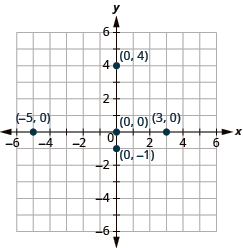
Try It 11.10 §11.1 source ↗

Plot each point on a coordinate grid:

ⓐ (−5,0)

ⓑ (3,0)

ⓒ (0,0)

ⓓ (0,−1)

ⓔ (0,4)

Answer


This image is an answer graph and shows the x y-coordinate plane. The x and y-axis each run from -6 to 6. The point for ordered pair -5, 0 is plotted. The point for ordered pair 3, 0 is plotted. The point for ordered pair 0,0 is plotted. The point for ordered pair 0, -1 is plotted. The point for ordered pair 0,4 is plotted.

Try It 11.11 §11.1 source ↗

Name the ordered pair of each point shown:
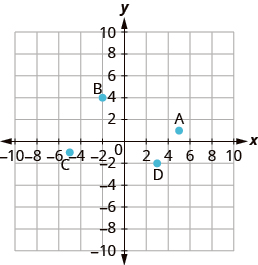
The graph shows the x y-coordinate plane. The x and y-axis each run from -7 to 7. The point “ordered pair 5, 1” is labeled A. The point “ordered pair -2, 4” is labeled B. The point “ordered pair -5, -1” is labeled C. The point “ordered pair 3, -2” is labeled D.

Answer

1. A: (5,1)

2. B: (−2,4)

3. C: (−5,−1)

4. D: (3,−2)

Try It 11.12 §11.1 source ↗

Name the ordered pair of each point shown:
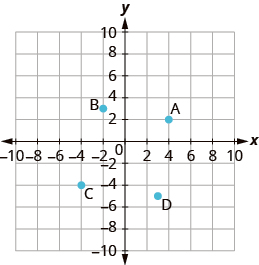
The graph shows the x y-coordinate plane. The x and y-axis each run from -7 to 7. The point “ordered pair 4, 2” is labeled A. The point “ordered pair -2, 3” is labeled B. The point “ordered pair -4, -4” is labeled C. The point “ordered pair 3, -5” is labeled D.

Answer

1. A: (4,2)

2. B: (−2,3)

3. C: (−4,−4)

4. D: (3,−5)

Try It 11.13 §11.1 source ↗

Name the ordered pair of each point shown:
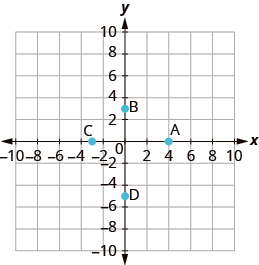
The graph shows the x y-coordinate plane. The x and y-axis each run from -7 to 7. The point “ordered pair 4, 0” is labeled A. The point “ordered pair 0, 3” is labeled B. The point “ordered pair -3, 0” is labeled C. The point “ordered pair 0, -5” is labeled D.

Answer

1. A: (4,0)

2. B: (0,3)

3. C: (−3,0)

4. D: (0,−5)

Try It 11.14 §11.1 source ↗

Name the ordered pair of each point shown:
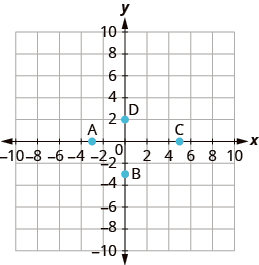
The graph shows the x y-coordinate plane. The x and y-axis each run from -7 to 7. The point “ordered pair 5, 0” is labeled C. The point “ordered pair 0, 2” is labeled D. The point “ordered pair -3, 0” is labeled A. The point “ordered pair 0,-3” is labeled B.

Answer

1. A: (−3,0)

2. B: (0,−3)

3. C: (5,0)

4. D: (0,2)

Try It 11.15 §11.1 source ↗

Determine which ordered pairs are solutions to the given equation: 2x+3y=6

ⓐ (3,0)

ⓑ (2,0)

ⓒ (6,−2)

Answer

ⓐ , ⓒ

Try It 11.16 §11.1 source ↗

Determine which ordered pairs are solutions to the given equation: 4x−y=8

ⓐ (0,8)

ⓑ (2,0)

ⓒ (1,−4)

Answer

ⓑ , ⓒ

Try It 11.17 §11.1 source ↗

Determine which ordered pairs are solutions of the given equation: y=4x−3

ⓐ (0,3)

ⓑ (1,1)

ⓒ (1,0)

Answer

ⓑ

Try It 11.18 §11.1 source ↗

Determine which ordered pairs are solutions of the given equation: y=−2x+6

ⓐ (0,6)

ⓑ (1,4)

ⓒ (−2,−2)

Answer

ⓐ , ⓑ

Try It 11.19 §11.1 source ↗

Complete the table to find three solutions to the equation: y=3x−1.

y=3x−1
x y (x,y)
0
−1
2

Answer

y=3x−1
x y (x,y)
0 −1 (0,−1)
−1 −4 (−1,−4)
2 5 (2,5)

Try It 11.20 §11.1 source ↗

Complete the table to find three solutions to the equation: y=6x+1

y=6x+1
x y (x,y)
0
1
−2

Answer

y=6x+1
x y (x,y)
0 1 (0,1)
1 7 (1,7)
−2 −11 (−2,−11)

Try It 11.21 §11.1 source ↗

Complete the table to find three solutions to the equation: 2x−5y=20.

2x−5y=20
x y (x,y)
0
0
−5

Answer

2x−5y=20
x y (x,y)
0 −4 (0,−4)
10 0 (10,0)
−5 −6 (−5,−6)

Try It 11.22 §11.1 source ↗

Complete the table to find three solutions to the equation: 3x−4y=12.

3x−4y=12
x y (x,y)
0
0
−4

Answer

3x−4y=12
x y (x,y)
0 −3 (0,−3)
4 0 (4,0)
−4 −6 (−4,−6)

Try It 11.23 §11.1 source ↗

Find a solution to the equation: 4x+3y=12.

Answer

Answers will vary.

Try It 11.24 §11.1 source ↗

Find a solution to the equation: 2x+4y=8.

Answer

Answers will vary.

Try It 11.25 §11.1 source ↗

Find three solutions to the equation: 2x+3y=6.

Answer

Answers will vary.

Try It 11.26 §11.1 source ↗

Find three solutions to the equation: 4x+2y=8.

Answer

Answers will vary.

Try It 11.27 §11.1 source ↗

Find three solutions to the equation: 4x+y=8.

Answer

Answers will vary.

Try It 11.28 §11.1 source ↗

Find three solutions to the equation: x+5y=10.

Answer

Answers will vary.

11.1-1 §11.1 source ↗

Plot Points on a Rectangular Coordinate System

In the following exercises, plot each point on a coordinate grid.

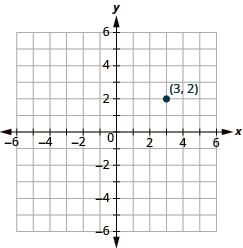
( 3 , 2 )

Answer


The graph shows the x y-coordinate plane. The x and y-axis each run from -6 to 6. The point “ordered pair 3, 2” is labeled

11.1-3 §11.1 source ↗

Plot Points on a Rectangular Coordinate System

In the following exercises, plot each point on a coordinate grid.

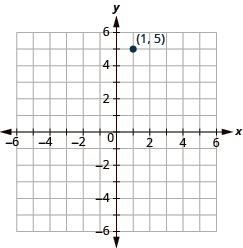
( 1 , 5 )

Answer


The graph shows the x y-coordinate plane. The x and y-axis each run from -6 to 6. The point “ordered pair 1, 5” is labeled

11.1-5 §11.1 source ↗

Plot Points on a Rectangular Coordinate System

In the following exercises, plot each point on a coordinate grid.

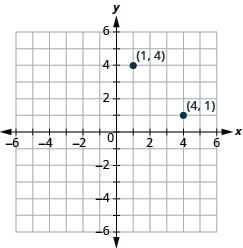
( 4 , 1 ) , ( 1 , 4 )

Answer


The graph shows the x y-coordinate plane. The x and y-axis each run from -6 to 6. The point “ordered pair 1, 4” is labeled. The point “ordered pair 4, 1” is labeled.

11.1-7 §11.1 source ↗

Plot Points on a Rectangular Coordinate System

In the following exercises, plot each point on a coordinate grid.

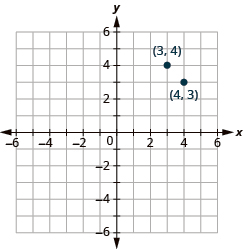
( 3 , 4 ) , ( 4 , 3 )

Answer


The graph shows the x y-coordinate plane. The x and y-axis each run from -6 to 6. The point “ordered pair 3, 4” is labeled. The point “ordered pair 4, 3” is labeled.

11.1-9 §11.1 source ↗

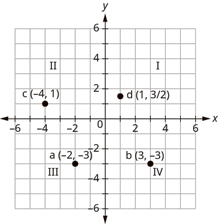
In the following exercises, plot each point on a coordinate grid and identify the quadrant in which the point is located.

ⓐ (−2,−3)

ⓑ (3,−3)

ⓒ (−4,1)

ⓓ (1,32)

Answer


The graph shows the x y-coordinate plane. The x and y-axis each run from -6 to 6. The quadrants are labeled I, II, III, and IV. The point (-1, 1) is labeled a, the point (-2, -1) is labeled b. The point (1, -4) is labeled c, and the point (3, 7/2) is labeled d.

11.1-11 §11.1 source ↗

In the following exercises, plot each point on a coordinate grid.

ⓐ (3,−2)

ⓑ (−3,2)

ⓒ (−3,−2)

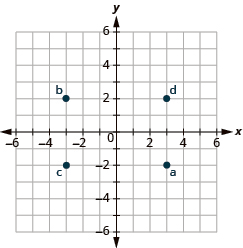
ⓓ (3,2)

Answer


The graph shows the x y-coordinate plane. The x and y-axis each run from -6 to 6. The point (3, -2) is labeled a, the point (-3, 2) is labeled b. The point (-3, -2) is labeled c, and the point (3, 2) is labeled d.

11.1-13 §11.1 source ↗

In the following exercises, plot each point on a coordinate grid.

ⓐ (−2,0)

ⓑ (−3,0)

ⓒ (0,4)

ⓓ (0,2)

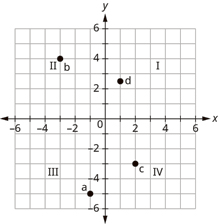
Answer


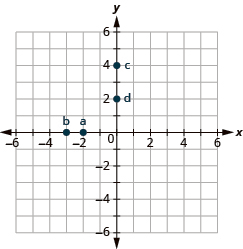
The graph shows the x y-coordinate plane. The x and y-axis each run from -6 to 6. The point (-2, 0) is labeled a, the point (-3, 0) is labeled b. The point (0, 4) is labeled c, and the point (0, 2) is labeled d.

11.1-15 §11.1 source ↗

Identify Points on a Graph

In the following exercises, name the ordered pair of each point shown.
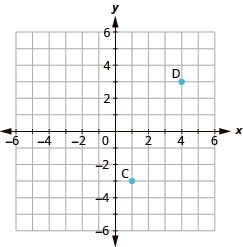
The graph shows the x y-coordinate plane. The x and y-axis each run from -6 to 6. The point “ordered pair 4, 3” is labeled “D”. The point “ordered pair 1, -3” is labeled “C”.

Answer

C(1, -3) D(4, 3)

11.1-17 §11.1 source ↗

Identify Points on a Graph

In the following exercises, name the ordered pair of each point shown.
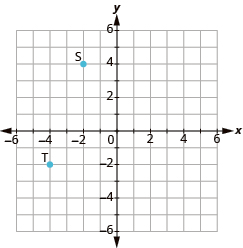
The graph shows the x y-coordinate plane. The x and y-axis each run from -6 to 6. The point “ordered pair -2, 4” is labeled “S”. The point “ordered pair -4, -2” is labeled “T”.

Answer

S(-2, 4) T(-4, -2)

11.1-19 §11.1 source ↗

Identify Points on a Graph

In the following exercises, name the ordered pair of each point shown.
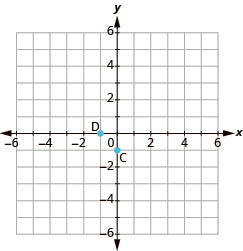
The graph shows the x y-coordinate plane. The x and y-axis each run from -6 to 6. The point “ordered pair -1, 0” is labeled “D”. The point “ordered pair 0, -1” is labeled “C”.

Answer

C(0, -1) D(-1, 0)

11.1-21 §11.1 source ↗

Verify Solutions to an Equation in Two Variables

In the following exercises, determine which ordered pairs are solutions to the given equation.

2 x + y = 6

ⓐ (1,4)

ⓑ (3,0)

ⓒ (2,3)

Answer

ⓐ , ⓑ

11.1-23 §11.1 source ↗

Verify Solutions to an Equation in Two Variables

In the following exercises, determine which ordered pairs are solutions to the given equation.

4 x − 2 y = 8

ⓐ (3,2)

ⓑ (1,4)

ⓒ (0,−4)

Answer

ⓐ , ⓒ

11.1-25 §11.1 source ↗

Verify Solutions to an Equation in Two Variables

In the following exercises, determine which ordered pairs are solutions to the given equation.

y = 4 x + 3

ⓐ (4,3)

ⓑ (−1,−1)

ⓒ (12,5)

Answer

ⓑ , ⓒ

11.1-27 §11.1 source ↗

Verify Solutions to an Equation in Two Variables

In the following exercises, determine which ordered pairs are solutions to the given equation.

y = 1 2 x − 1

ⓐ (2,0)

ⓑ (−6,−4)

ⓒ (−4,−1)

Answer

ⓐ , ⓑ

11.1-29 §11.1 source ↗

Find Solutions to Linear Equations in Two Variables

In the following exercises, complete the table to find solutions to each linear equation.

y = 2 x − 4

x y (x,y)
−1
0
2

Answer

x y (x,y)
−1 −6 (−1,−6)
0 −4 (0,−4)
2 0 (2,0)

11.1-31 §11.1 source ↗

Find Solutions to Linear Equations in Two Variables

In the following exercises, complete the table to find solutions to each linear equation.

y = − x + 5

x y (x,y)
−2
0
3

Answer

x y (x,y)
−2 7 (−2,7)
0 5 (0,5)
3 2 (3,2)

11.1-33 §11.1 source ↗

Find Solutions to Linear Equations in Two Variables

In the following exercises, complete the table to find solutions to each linear equation.

y = − 3 2 x − 2

x y (x,y)
−2
0
2

Answer

x y (x,y)
−2 1 (−2,1)
0 −2 (0,−2)
2 −5 (2,−5)

11.1-35 §11.1 source ↗

Find Solutions to Linear Equations in Two Variables

In the following exercises, complete the table to find solutions to each linear equation.

Weight of a baby Mackenzie recorded her baby’s weight every two months. The baby’s age, in months, and weight, in pounds, are listed in the table, and shown as an ordered pair in the third column.

ⓐ Plot the points on a coordinate grid.

Age Weight (x,y)
0 7 (0,7)
2 11 (2,11)
4 15 (4,15)
6 16 (6,16)
8 19 (8,19)
10 20 (10,20)
12 21 (12,21)

ⓑ Why is only Quadrant I needed?

Answer

ⓐ This figure shows points plot on the x y coordinate plane. There are 7 points graphed without labeled at approximately the points “ordered pair 0, 7”, “ordered pair 2, 11”, “ordered pair 4, 15”, “ordered pair 6, 16”, “ordered pair 8, 19”, “ordered pair 10, 20”, “ordered pair 12, 21”.
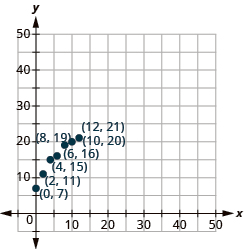
ⓑ Age and weight are only positive.

11.1-37 §11.1 source ↗

Find Solutions to Linear Equations in Two Variables

In the following exercises, complete the table to find solutions to each linear equation.

Have you ever used a map with a rectangular coordinate system? Describe the map and how you used it.

Answer

Answers may vary.

Be Prepared 11.4 §11.2 source ↗

Evaluate: 3x+2 when x=−1.
If you missed this problem, review Example 3.56.
Example 3.56 in the book ↗

Answer

− 1

Be Prepared 11.5 §11.2 source ↗

Solve the formula: 5x+2y=20 for y.
If you missed this problem, review Example 9.62.
Example 9.62 in the book ↗

Answer

y = 20 − 5 x 2

Be Prepared 11.6 §11.2 source ↗

Simplify: 38(−24).
If you missed this problem, review Example 4.28.
Example 4.28 in the book ↗

Answer

− 9

Try It 11.29 §11.2 source ↗

The graph of y=3x−1 is shown.

For each ordered pair, decide

ⓐ is the ordered pair a solution to the equation?

ⓑ is the point on the line?
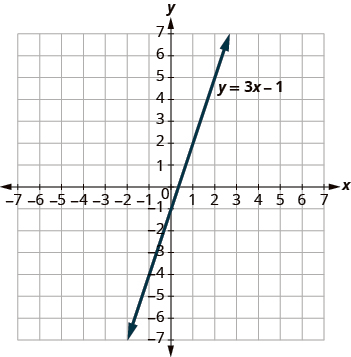
A two-dimensional graph displays the linear function y = 3x - 1. The line ascends from left to right, intersecting the y-axis at -1.

1. (0,−1)

2. (2,2)

3. (3,−1)

4. (−1,−4)

Answer

ⓐ yes ⓑ yes

ⓐ no ⓑ no

ⓐ no ⓑ no

ⓐ yes ⓑ yes

Try It 11.30 §11.2 source ↗

Graph the equation by plotting points: y=−4x.

Answer


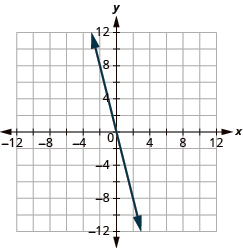
The graph shows the x y-coordinate plane. The x and y-axis each run from -12 to 12. A line passes through the points “ordered pair 0, 0” and “ordered pair 4, -4”.

Try It 11.31 §11.2 source ↗

Graph the equation by plotting points: y=x.

Answer


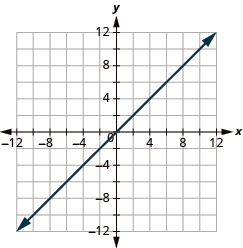
The graph shows the x y-coordinate plane. The x and y-axis each run from -12 to 12. A line passes through the points “ordered pair 0, 0” and “ordered pair 1, -4”.

Try It 11.32 §11.2 source ↗

Graph the equation: y=13x−1.

Answer


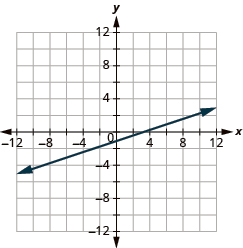
The graph shows the x y-coordinate plane. The x and y-axis each run from -12 to 12. A line passes through the points “ordered pair 0, -1” and “ordered pair 3, 0”.

Try It 11.33 §11.2 source ↗

Graph the equation: y=14x+2.

Answer


The graph shows the x y-coordinate plane. The x and y-axis each run from -12 to 12. A line passes through the points “ordered pair 0, 2” and “ordered pair -12, 0”.

Try It 11.34 §11.2 source ↗

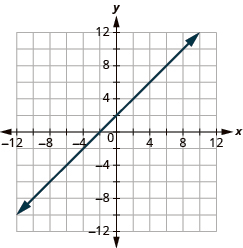
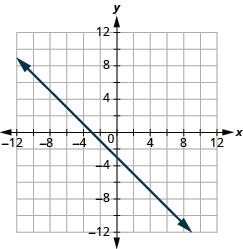
Graph the equation: x+y=−2.

Answer


This answer graph shows the x y-coordinate plane. The x and y-axis each run from -12 to 12. The equation x plus y equals -2 is shown. A line passes through the intercepts with coordinates 0, –2 and –2, 0.

Try It 11.35 §11.2 source ↗

Graph the equation: x−y=6.

Answer


The graph shows the x y-coordinate plane. The x and y-axis each run from -7 to 7. A line passes through the points “ordered pair 6, 0” and “ordered pair 0, -6”.

Try It 11.36 §11.2 source ↗

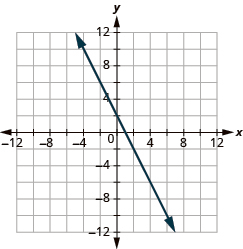
Graph each equation: 2x+y=2.

Answer


The graph shows the x y-coordinate plane. The x and y-axis each run from -7 to 7. A line passes through three labeled points, “ordered pair -1, 2”, “ordered pair 0, -1”, and ordered pair 1, -4”. The line is labeled 3 x + y = -1.

Try It 11.37 §11.2 source ↗

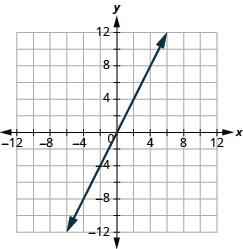
Graph each equation: 4x+y=−3.

Answer


The graph shows the x y-coordinate plane. The x and y-axis each run from -12 to 12. A line passes through the points “ordered pair -1, 4” and “ordered pair 0, -3”.

Try It 11.38 §11.2 source ↗

Graph the equation: x=5.

Answer


The graph shows the x y-coordinate plane. The x and y-axis each run from -12 to 12. A vertical line passes through the points “ordered pair 5, 0” and “ordered pair 5, 1”.

Try It 11.39 §11.2 source ↗

Graph the equation: x=−2.

Answer


The graph shows the x y-coordinate plane. The x and y-axis each run from -12 to 12. A vertical line passes through the points “ordered pair 5, 0” and “ordered pair 5, 1”.

Try It 11.40 §11.2 source ↗

Graph the equation: y=−4.

Answer


The graph shows the x y-coordinate plane. The x and y-axis each run from -12 to 12. A horizontal line passes through the points “ordered pair 0, -4” and “ordered pair 1, -4”.

Try It 11.41 §11.2 source ↗

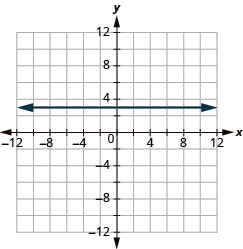
Graph the equation: y=3.

Answer


The graph shows the x y-coordinate plane. The x and y-axis each run from -12 to 12. A horizontal line passes through the points “ordered pair 0, 3” and “ordered pair 1, 3”.

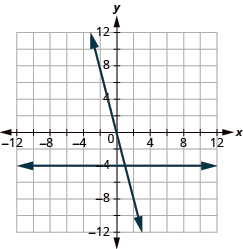
Try It 11.42 §11.2 source ↗

Graph the equations in the same rectangular coordinate system: y=−4x and y=−4.

Answer


The graph shows the x y-coordinate plane. The x and y-axis each run from -12 to 12. A horizontal line passes through “ordered pair 0, -4” and “ordered pair 1, -4” . A second line passes through “ordered pair 0, 0” and “ordered pair 1, -4” . The two lines intersect at “ordered pair 1, -4”.

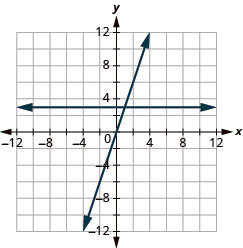
Try It 11.43 §11.2 source ↗

Graph the equations in the same rectangular coordinate system: y=3 and y=3x.

Answer


The graph shows the x y-coordinate plane. The x and y-axis each run from -12 to 12. A horizontal line passes through “ordered pair 0, 3” and “ordered pair 1, 3” . A second line passes through “ordered pair 0, 0” and “ordered pair 1, 3” . The two lines intersect at “ordered pair 1, 3”.

11.2-39 §11.2 source ↗

Recognize the Relation Between the Solutions of an Equation and its Graph

In each of the following exercises, an equation and its graph is shown. For each ordered pair, decide
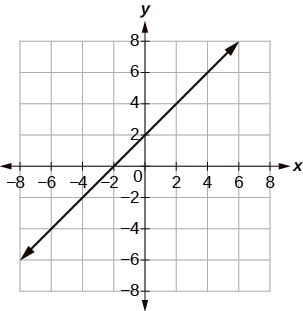
y=x+2

A graph with both x- and y-axis ranging from –8 to 8. A line runs upwards, intercepting the x-axis at (–2, 0) and the y-axis at (0, 2).

1. (0,2)

2. (1,2)

3. (−1,1)

4. ( − 3 , 1 )

Answer

ⓐ yes ⓑ yes

ⓐ no ⓑ no

ⓐ yes ⓑ yes

ⓐ no ⓑ no

11.2-41 §11.2 source ↗

Recognize the Relation Between the Solutions of an Equation and its Graph

In each of the following exercises, an equation and its graph is shown. For each ordered pair, decide
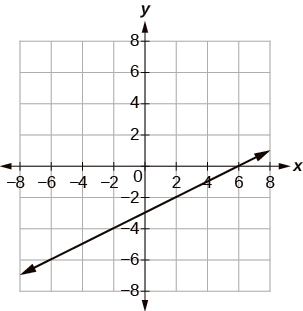
y=12x−3

A graph with both x- and y-axis running from –8 to 8. A line is drawn that intercepts the y-axis at (0, –3) and the x-axis at (6, 0)

1. (0,−3)

2. (2,−2)

3. (−2,−4)

4. ( 4 , 1 )

Answer

ⓐ yes ⓑ yes

ⓐ yes ⓑ yes

ⓐ yes ⓑ yes

ⓐ no ⓑ no

11.2-43 §11.2 source ↗

Graph a Linear Equation by Plotting Points

In the following exercises, graph by plotting points.

y = 3 x − 1

Answer


The graph shows the x y-coordinate plane. The x and y-axis each run from -12 to 12. A line passes through the points “ordered pair 0, -1” and “ordered pair 1/3, 0”.

11.2-45 §11.2 source ↗

Graph a Linear Equation by Plotting Points

In the following exercises, graph by plotting points.

y = −2 x + 2

Answer


The graph shows the x y-coordinate plane. The x and y-axis each run from -12 to 12. A line passes through the points “ordered pair 0, 4” and “ordered pair 1, 0”.

11.2-47 §11.2 source ↗

Graph a Linear Equation by Plotting Points

In the following exercises, graph by plotting points.

y = x + 2

Answer


The graph shows the x y-coordinate plane. The x and y-axis each run from -12 to 12. A line passes through the points “ordered pair 0, 2” and “ordered pair 2, 4”.

11.2-49 §11.2 source ↗

Graph a Linear Equation by Plotting Points

In the following exercises, graph by plotting points.

y = − x − 3

Answer


The graph shows the x y-coordinate plane. The x and y-axis each run from -12 to 12. A line passes through the points “ordered pair 0, -3” and “ordered pair 1, -4”.

11.2-51 §11.2 source ↗

Graph a Linear Equation by Plotting Points

In the following exercises, graph by plotting points.

y = 2 x

Answer


The graph shows the x y-coordinate plane. The x and y-axis each run from -12 to 12. A line passes through the points “ordered pair 0, 0” and “ordered pair 2, 4”.

11.2-53 §11.2 source ↗

Graph a Linear Equation by Plotting Points

In the following exercises, graph by plotting points.

y = −4 x

Answer


The graph shows the x y-coordinate plane. The x and y-axis each run from -12 to 12. A line passes through the points “ordered pair 0, 0” and “ordered pair 1, -4”.

11.2-55 §11.2 source ↗

Graph a Linear Equation by Plotting Points

In the following exercises, graph by plotting points.

y = 1 2 x + 2

Answer


The graph shows the x y-coordinate plane. The x and y-axis each run from -12 to 12. A line passes through the points “ordered pair 0, 2” and “ordered pair 4, 4”.

11.2-57 §11.2 source ↗

Graph a Linear Equation by Plotting Points

In the following exercises, graph by plotting points.

y = 4 3 x − 5

Answer


The graph shows the x y-coordinate plane. The x and y-axis each run from -12 to 12. A line passes through the points “ordered pair 0, 5” and “ordered pair 4, 2”.

11.2-59 §11.2 source ↗

Graph a Linear Equation by Plotting Points

In the following exercises, graph by plotting points.

y = − 2 5 x + 1

Answer


The graph shows the x y-coordinate plane. The x and y-axis each run from -12 to 12. A line passes through the points “ordered pair 0, 1” and “ordered pair 8, -2”.

11.2-61 §11.2 source ↗

Graph a Linear Equation by Plotting Points

In the following exercises, graph by plotting points.

y = − 3 2 x + 2

Answer


The graph shows the x y-coordinate plane. The x and y-axis each run from -12 to 12. A line passes through the points “ordered pair 0, 2” and “ordered pair 4, -4”.

11.2-63 §11.2 source ↗

Graph a Linear Equation by Plotting Points

In the following exercises, graph by plotting points.

x + y = 6

Answer


The graph shows the x y-coordinate plane. The x and y-axis each run from -12 to 12. A line passes through the points “ordered pair 0, 6” and “ordered pair 6, 0”.

11.2-65 §11.2 source ↗

Graph a Linear Equation by Plotting Points

In the following exercises, graph by plotting points.

x + y = −3

Answer


The graph shows the x y-coordinate plane. The x and y-axis each run from -12 to 12. A line passes through the points “ordered pair 0, -3” and “ordered pair -3, 0”.

11.2-67 §11.2 source ↗

Graph a Linear Equation by Plotting Points

In the following exercises, graph by plotting points.

x − y = 2

Answer


The graph shows the x y-coordinate plane. The x and y-axis each run from -12 to 12. A line passes through the points “ordered pair 0, -2” and “ordered pair 2, 0”.

11.2-69 §11.2 source ↗

Graph a Linear Equation by Plotting Points

In the following exercises, graph by plotting points.

x − y = −1

Answer


The graph shows the x y-coordinate plane. The x and y-axis each run from -12 to 12. A line passes through the points “ordered pair 0, 1” and “ordered pair 8, 8”.

11.2-71 §11.2 source ↗

Graph a Linear Equation by Plotting Points

In the following exercises, graph by plotting points.

− x + y = 4

Answer


The graph shows the x y-coordinate plane. The x and y-axis each run from -12 to 12. A line passes through the points “ordered pair -4, 0” and “ordered pair 0, 4”.

11.2-73 §11.2 source ↗

Graph a Linear Equation by Plotting Points

In the following exercises, graph by plotting points.

− x − y = 5

Answer


The graph shows the x y-coordinate plane. The x and y-axis each run from -12 to 12. A line passes through the points “ordered pair -5, 0” and “ordered pair 0, -5”.

11.2-75 §11.2 source ↗

Graph a Linear Equation by Plotting Points

In the following exercises, graph by plotting points.

3 x + y = 7

Answer


The graph shows the x y-coordinate plane. The x and y-axis each run from -12 to 12. A line passes through the points “ordered pair 4, -4” and “ordered pair 0, 8”.

11.2-77 §11.2 source ↗

Graph a Linear Equation by Plotting Points

In the following exercises, graph by plotting points.

2 x + y = −3

Answer


The graph shows the x y-coordinate plane. The x and y-axis each run from -12 to 12. A line passes through the points “ordered pair 0, -3” and “ordered pair 2, -7”.

11.2-79 §11.2 source ↗

Graph a Linear Equation by Plotting Points

In the following exercises, graph by plotting points.

2 x + 3 y = 12

Answer


The graph shows the x y-coordinate plane. The x and y-axis each run from -12 to 12. A line passes through the points “ordered pair 0, 4” and “ordered pair 6, 0”.

11.2-81 §11.2 source ↗

Graph a Linear Equation by Plotting Points

In the following exercises, graph by plotting points.

1 3 x + y = 2

Answer


The graph shows the x y-coordinate plane. The x and y-axis each run from -12 to 12. A line passes through the points “ordered pair 0, 2” and “ordered pair 6, 0”.

11.2-83 §11.2 source ↗

Graph Vertical and Horizontal lines

In the following exercises, graph the vertical and horizontal lines.

x = 4

Answer


The graph shows the x y-coordinate plane. The x and y-axis each run from -12 to 12. A vertical line passes through the points “ordered pair 4, 0” and “ordered pair 4, 1”.

11.2-85 §11.2 source ↗

Graph Vertical and Horizontal lines

In the following exercises, graph the vertical and horizontal lines.

x = −2

Answer


The graph shows the x y-coordinate plane. The x and y-axis each run from -12 to 12. A vertical line passes through the points “ordered pair -2, 0” and “ordered pair -2, 1”.

11.2-87 §11.2 source ↗

Graph Vertical and Horizontal lines

In the following exercises, graph the vertical and horizontal lines.

y = 3

Answer


The graph shows the x y-coordinate plane. The x and y-axis each run from -12 to 12. A horizontal line passes through the points “ordered pair 0, 3” and “ordered pair 1, 3”.

11.2-89 §11.2 source ↗

Graph Vertical and Horizontal lines

In the following exercises, graph the vertical and horizontal lines.

y = −5

Answer


The graph shows the x y-coordinate plane. The x and y-axis each run from -12 to 12. A horizontal line passes through the points “ordered pair 0, -5” and “ordered pair 1, -5”.

11.2-91 §11.2 source ↗

Graph Vertical and Horizontal lines

In the following exercises, graph the vertical and horizontal lines.

x = 7 3

Answer


The graph shows the x y-coordinate plane. The x and y-axis each run from -12 to 12. A vertical line passes through the points “ordered pair 7 over 3, 0” and “ordered pair 7 over 3 , 1”.

11.2-93 §11.2 source ↗

In the following exercises, graph each pair of equations in the same rectangular coordinate system.

y=−12x and y=−12

Answer


A Cartesian coordinate system displays a dark blue line that passes through the origin (0,0). The line has a negative slope, intersecting points like (-4, 2) and (4, -2).

11.2-95 §11.2 source ↗

In the following exercises, graph each pair of equations in the same rectangular coordinate system.

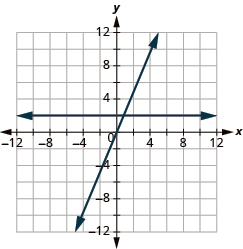
y=2x and y=2

Answer


The graph shows the x y-coordinate plane. The x and y-axis each run from -12 to 12. A horizontal line passes through “ordered pair 0, 2” and “ordered pair 1, 2” . A second line passes through “ordered pair 0, 0” and “ordered pair 1, 2” . The two lines intersect at “ordered pair 1, 2”.

11.2-97 §11.2 source ↗

Mixed Practice

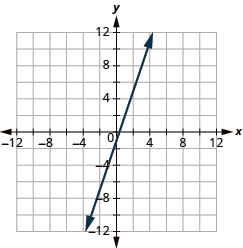
In the following exercises, graph each equation.

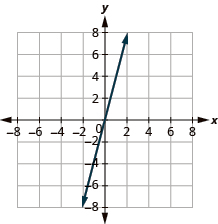
y=4x

Answer


A coordinate plane shows a straight line passing through the origin (0,0) and the points (1,4) and (-1,-4), indicating a positive slope of 4.

11.2-99 §11.2 source ↗

Mixed Practice

In the following exercises, graph each equation.

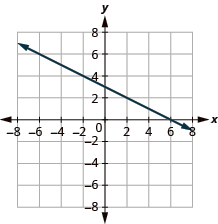
y=−12x+3

Answer


A graph displays a blue line with a negative slope on a Cartesian coordinate plane. The line intersects the y-axis at approximately 3.5 and the x-axis at approximately 7.

11.2-101 §11.2 source ↗

Mixed Practice

In the following exercises, graph each equation.

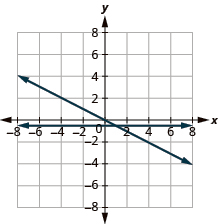
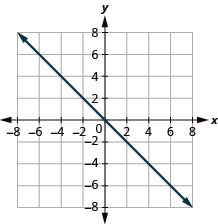
y=−x

Answer

A line graph on a Cartesian plane showing a straight line passing through the origin (0,0) with a negative slope. The x and y axes range from -8 to 8.

11.2-103 §11.2 source ↗

Mixed Practice

In the following exercises, graph each equation.

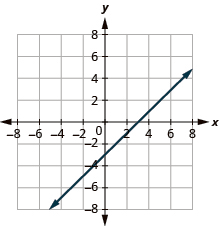
x−y=3

Answer

A graph showing a straight line on a Cartesian coordinate plane. The line has a positive slope, intersecting the y-axis at -3 and the x-axis at 4.5. It represents a linear function.

11.2-105 §11.2 source ↗

Mixed Practice

In the following exercises, graph each equation.

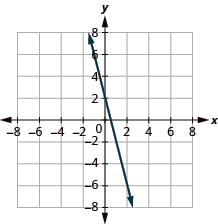
4x+y=2

Answer

A graph shows a linear function, represented by a solid downward-sloping line, plotted on a Cartesian coordinate system. The line intersects the y-axis at (0, 2) and the x-axis at (1, 0), extending infinitely in both directions as indicated by arrows.

11.2-107 §11.2 source ↗

Mixed Practice

In the following exercises, graph each equation.

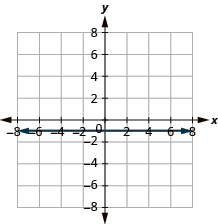
y=−1

Answer

A Cartesian coordinate system with a grid. The x and y axes are labeled from -8 to 8. A horizontal double-headed arrow is drawn along the x-axis, indicating the entire range.

11.2-109 §11.2 source ↗

Mixed Practice

In the following exercises, graph each equation.

2x+6y=12

Answer

A graph on a coordinate plane shows a downward-sloping line. The line intersects the y-axis at (0, 2) and the x-axis at (6, 0), extending infinitely in both directions.

11.2-111 §11.2 source ↗

Mixed Practice

In the following exercises, graph each equation.

x=3

Answer

A graph with x- and y- axis both ranging from –8 to 8. A line is drawn to demonstrate x = 3.

11.2-113 §11.2 source ↗

Mixed Practice

In the following exercises, graph each equation.

Motor home cost The Robinsons rented a motor home for one week to go on vacation. It cost them $594 plus $0.32 per mile to rent the motor home, so the linear equation y=594+0.32x gives the cost, y, for driving x miles. Calculate the rental cost for driving 400, 800, and1,200 miles, and then graph the line.

Answer
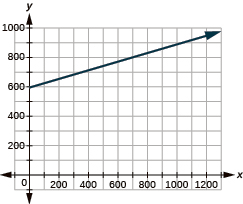

The graph shows the x y-coordinate plane. The x-axis runs from 0 to 1000. The y-axis runs from 0 to 1200. A line passes through the points “ordered pair 0, 594” and “ordered pair 800, 850”.


$722, $850, $978

11.2-115 §11.2 source ↗

Mixed Practice

In the following exercises, graph each equation.

Explain how you would choose three x-values to make a table to graph the line y=15x−2.

Answer

Answers will vary.

Be Prepared 11.7 §11.3 source ↗

Solve: 3x+4y=−12 for x when y=0.
If you missed this problem, review Example 9.62.
Example 9.62 in the book ↗

Answer

− 4

Be Prepared 11.8 §11.3 source ↗

Is the point (0,−5) on the x-axis or y-axis?
If you missed this problem, review Example 11.5.
Example 11.5 in the book ↗

Answer

y -axis

Be Prepared 11.9 §11.3 source ↗

Which ordered pairs are solutions to the equation 2x−y=6?
ⓐ (6,0)ⓑ (0,−6)ⓒ (4,−2).
If you missed this problem, review Example 11.8.
Example 11.8 in the book ↗

Answer

b

Try It 11.44 §11.3 source ↗

Find the x- and y-intercepts of the graph: x−y=2.

The graph shows the x y-coordinate plane. The x and y-axis each run from -7 to 7. A line passes through the points “ordered pair 0, 2” and “ordered pair 2, 0”.

Answer

x-intercept (2,0): y-intercept (0,−2)

Try It 11.45 §11.3 source ↗

Find the x- and y-intercepts of the graph: 2x+3y=6.

The graph shows the x y-coordinate plane. The x and y-axis each run from -7 to 7. A line passes through the points “ordered pair 0, 2” and “ordered pair 3, 0”.

Answer

x-intercept (3,0); y-intercept (0,2)

Try It 11.46 §11.3 source ↗

Find the intercepts: 3x+y=12

Answer

(4,0) and (0,12)

Try It 11.47 §11.3 source ↗

Find the intercepts: x+4y=8

Answer

(8,0) and (0,2)

Try It 11.48 §11.3 source ↗

Find the intercepts of the line: 3x−4y=12.

Answer

x-intercept (4,0); y-intercept: (0,−3)

Try It 11.49 §11.3 source ↗

Find the intercepts of the line: 2x−4y=8.

Answer

x-intercept (4,0); y-intercept: (0,−2)

Try It 11.50 §11.3 source ↗

Graph the line using the intercepts: x−2y=4.

Answer


The graph shows the x y-coordinate plane. The x and y-axis each run from -12 to 12. A line passes through the points “ordered pair 0, -2” and “ordered pair 4, 0”.

Try It 11.51 §11.3 source ↗

Graph the line using the intercepts: −x+3y=6.

Answer


The graph shows the x y-coordinate plane. The x and y-axis each run from -12 to 12. A line passes through the points “ordered pair 0, 2” and “ordered pair -6, 0”.

Try It 11.52 §11.3 source ↗

Graph the line using the intercepts: 5x−2y=10.

Answer


The graph shows the x y-coordinate plane. The x and y-axis each run from -7 to 7. A line passes through the points “ordered pair 0, -5” and “ordered pair 2, 0”.

Try It 11.53 §11.3 source ↗

Graph the line using the intercepts: 3x−4y=12.

Answer


The graph shows the x y-coordinate plane. The x and y-axis each run from -7 to 7. A line passes through the points “ordered pair 0, -3” and “ordered pair 4, 0”.

Try It 11.54 §11.3 source ↗

Graph using the intercepts: y=4x.

Answer


The graph shows the x y-coordinate plane. The x and y-axis each run from -12 to 12. A line passes through the points “ordered pair 0, 0” and “ordered pair 1, 3”.

Try It 11.55 §11.3 source ↗

Graph using the intercepts: y=−x.

Answer


The graph shows the x y-coordinate plane. The x and y-axis each run from -12 to 12. A line passes through the points “ordered pair 0, 0” and “ordered pair 1, -1”.

Try It 11.56 §11.3 source ↗

Identify the most convenient method to graph each line:

ⓐ 3x+2y=12

ⓑ y=4

ⓒ y=15x−4

ⓓ x=−7

Answer

ⓐ intercepts

ⓑ horizontal line

ⓒ plotting points

ⓓ vertical line

Try It 11.57 §11.3 source ↗

Identify the most convenient method to graph each line:

ⓐ x=6

ⓑ y=−34x+1

ⓒ y=−8

ⓓ 4x−3y=−1

Answer

ⓐ vertical line

ⓑ plotting points

ⓒ horizontal line

ⓓ intercepts

11.3-117 §11.3 source ↗

Identify the Intercepts on a Graph

In the following exercises, find the x- and y- intercepts.

The graph shows the x y-coordinate plane. The axes run from -10 to 10. A line passes through the points “ordered pair 0, 3” and “ordered pair 3, 0”.

Answer

(3,0),(0,3)

11.3-119 §11.3 source ↗

Identify the Intercepts on a Graph

In the following exercises, find the x- and y- intercepts.

The graph shows the x y-coordinate plane. The x and y-axis each run from -10 to 10. A line passes through the points “ordered pair 0, -5” and “ordered pair 5, 0”.

Answer

(5,0),(0,−5)

11.3-121 §11.3 source ↗

Identify the Intercepts on a Graph

In the following exercises, find the x- and y- intercepts.

The graph shows the x y-coordinate plane. The x and y-axis each run from -10 to 10. A line passes through the points “ordered pair 0, -2” and “ordered pair -2, 0”.

Answer

(−2,0),(0,−2)

11.3-123 §11.3 source ↗

Identify the Intercepts on a Graph

In the following exercises, find the x- and y- intercepts.

The graph shows the x y-coordinate plane. The x and y-axis each run from -10 to 10. A line passes through the points “ordered pair 0, 1” and “ordered pair -1, 0”.

Answer

(−1,0),(0,1)

11.3-125 §11.3 source ↗

Identify the Intercepts on a Graph

In the following exercises, find the x- and y- intercepts.

The graph shows the x y-coordinate plane. The x and y-axis each run from -7 to 7. A line passes through the points “ordered pair 0, 0” and “ordered pair 4, 2”.

Answer

(0,0)

11.3-127 §11.3 source ↗

Find the x and y Intercepts from an Equation of a Line

In the following exercises, find the intercepts.

x + y = 4

Answer

(4,0),(0,4)

11.3-129 §11.3 source ↗

Find the x and y Intercepts from an Equation of a Line

In the following exercises, find the intercepts.

x + y = −2

Answer

(−2,0),(0,−2)

11.3-131 §11.3 source ↗

Find the x and y Intercepts from an Equation of a Line

In the following exercises, find the intercepts.

x − y = 5

Answer

(5,0),(0,−5)

11.3-133 §11.3 source ↗

Find the x and y Intercepts from an Equation of a Line

In the following exercises, find the intercepts.

x − y = −3

Answer

(−3,0),(0,3)

11.3-135 §11.3 source ↗

Find the x and y Intercepts from an Equation of a Line

In the following exercises, find the intercepts.

x + 2 y = 8

Answer

(8,0),(0,4)

11.3-137 §11.3 source ↗

Find the x and y Intercepts from an Equation of a Line

In the following exercises, find the intercepts.

3 x + y = 6

Answer

(2,0),(0,6)

11.3-139 §11.3 source ↗

Find the x and y Intercepts from an Equation of a Line

In the following exercises, find the intercepts.

x −3 y = 12

Answer

(12,0),(0,−4)

11.3-141 §11.3 source ↗

Find the x and y Intercepts from an Equation of a Line

In the following exercises, find the intercepts.

4 x − y = 8

Answer

(2,0),(0,−8)

11.3-143 §11.3 source ↗

Find the x and y Intercepts from an Equation of a Line

In the following exercises, find the intercepts.

2 x + 5 y = 10

Answer

(5,0),(0,2)

11.3-145 §11.3 source ↗

Find the x and y Intercepts from an Equation of a Line

In the following exercises, find the intercepts.

3 x −2 y = 12

Answer

(4,0),(0,−6)

11.3-147 §11.3 source ↗

Find the x and y Intercepts from an Equation of a Line

In the following exercises, find the intercepts.

y = 1 3 x −1

Answer

(3,0),(0,−1)

11.3-149 §11.3 source ↗

Find the x and y Intercepts from an Equation of a Line

In the following exercises, find the intercepts.

y = 1 5 x + 2

Answer

(−10,0),(0,2)

11.3-151 §11.3 source ↗

Find the x and y Intercepts from an Equation of a Line

In the following exercises, find the intercepts.

y = 3 x

Answer

(0,0)

11.3-153 §11.3 source ↗

Find the x and y Intercepts from an Equation of a Line

In the following exercises, find the intercepts.

y = −4 x

Answer

(0,0)

11.3-155 §11.3 source ↗

Graph a Line Using the Intercepts

In the following exercises, graph using the intercepts.

− x + 5 y = 10

Answer


The graph shows the x y-coordinate plane. The x and y-axis each run from -12 to 12. A line passes through the points “ordered pair 0, 2” and “ordered pair -10, 0”.

11.3-157 §11.3 source ↗

Graph a Line Using the Intercepts

In the following exercises, graph using the intercepts.

x + 2 y = 4

Answer


The graph shows the x y-coordinate plane. The x and y-axis each run from -12 to 12. A line passes through the points “ordered pair 0, 2” and “ordered pair 4, 0”.

11.3-159 §11.3 source ↗

Graph a Line Using the Intercepts

In the following exercises, graph using the intercepts.

x + y = 2

Answer


The graph shows the x y-coordinate plane. The x and y-axis each run from -12 to 12. A line passes through the points “ordered pair 0, 2” and “ordered pair 2, 0”.

11.3-161 §11.3 source ↗

Graph a Line Using the Intercepts

In the following exercises, graph using the intercepts.

x + y = 3

Answer


The graph shows the x y-coordinate plane. The x and y-axis each run from -12 to 12. A line passes through the points “ordered pair 0, 3” and “ordered pair 3, 0”.

11.3-163 §11.3 source ↗

Graph a Line Using the Intercepts

In the following exercises, graph using the intercepts.

x − y = 1

Answer


The graph shows the x y-coordinate plane. The x and y-axis each run from -12 to 12. A line passes through the points “ordered pair 0, -1” and “ordered pair 1, 0”.

11.3-165 §11.3 source ↗

Graph a Line Using the Intercepts

In the following exercises, graph using the intercepts.

x − y = −4

Answer


The graph shows the x y-coordinate plane. The x and y-axis each run from -12 to 12. A line passes through the points “ordered pair 0, 4” and “ordered pair -4, 0”.

11.3-167 §11.3 source ↗

Graph a Line Using the Intercepts

In the following exercises, graph using the intercepts.

4 x + y = 4

Answer


The graph shows the x y-coordinate plane. The x and y-axis each run from -12 to 12. A line passes through the points “ordered pair 0, 4” and “ordered pair 1, 0”.

11.3-169 §11.3 source ↗

Graph a Line Using the Intercepts

In the following exercises, graph using the intercepts.

3 x − y = −6

Answer


The graph shows the x y-coordinate plane. The x and y-axis each run from -12 to 12. A line passes through the points “ordered pair 0, 6” and “ordered pair -2, 0”.

11.3-171 §11.3 source ↗

Graph a Line Using the Intercepts

In the following exercises, graph using the intercepts.

2 x + 4 y = 12

Answer

The graph shows the x y-coordinate plane. The x and y-axis each run from -12 to 12. A line passes through the points “ordered pair 0, 3” and “ordered pair 6, 0”.

11.3-173 §11.3 source ↗

Graph a Line Using the Intercepts

In the following exercises, graph using the intercepts.

3 x −2 y = 6

Answer


The graph shows the x y-coordinate plane. The x and y-axis each run from -12 to 12. A line passes through the points “ordered pair 0, -3” and “ordered pair 2, 0”.

11.3-175 §11.3 source ↗

Graph a Line Using the Intercepts

In the following exercises, graph using the intercepts.

2 x −5 y = −20

Answer


The graph shows the x y-coordinate plane. The x and y-axis each run from -12 to 12. A line passes through the points “ordered pair 0, 4” and “ordered pair -10, 0”.

11.3-177 §11.3 source ↗

Graph a Line Using the Intercepts

In the following exercises, graph using the intercepts.

y = −2 x

Answer


The graph shows the x y-coordinate plane. The x and y-axis each run from -12 to 12. A line passes through the points “ordered pair 0, 0” and “ordered pair 2, -4”.

11.3-179 §11.3 source ↗

Graph a Line Using the Intercepts

In the following exercises, graph using the intercepts.

y = x

Answer


The graph shows the x y-coordinate plane. The x and y-axis each run from -12 to 12. A line passes through the points “ordered pair 0, 0” and “ordered pair 2, 2”.

11.3-181 §11.3 source ↗

Choose the Most Convenient Method to Graph a Line

In the following exercises, identify the most convenient method to graph each line.

x = 2

Answer

vertical line

11.3-183 §11.3 source ↗

Choose the Most Convenient Method to Graph a Line

In the following exercises, identify the most convenient method to graph each line.

y = 5

Answer

horizontal line

11.3-185 §11.3 source ↗

Choose the Most Convenient Method to Graph a Line

In the following exercises, identify the most convenient method to graph each line.

y = −3 x + 4

Answer

plotting points

11.3-187 §11.3 source ↗

Choose the Most Convenient Method to Graph a Line

In the following exercises, identify the most convenient method to graph each line.

x − y = 5

Answer

intercepts

11.3-189 §11.3 source ↗

Choose the Most Convenient Method to Graph a Line

In the following exercises, identify the most convenient method to graph each line.

y = 2 3 x −1

Answer

plotting points

11.3-191 §11.3 source ↗

Choose the Most Convenient Method to Graph a Line

In the following exercises, identify the most convenient method to graph each line.

y = −3

Answer

horizontal line

11.3-193 §11.3 source ↗

Choose the Most Convenient Method to Graph a Line

In the following exercises, identify the most convenient method to graph each line.

3 x −2 y = −12

Answer

intercepts

11.3-195 §11.3 source ↗

Choose the Most Convenient Method to Graph a Line

In the following exercises, identify the most convenient method to graph each line.

y = − 1 4 x + 3

Answer

plotting points

11.3-197 §11.3 source ↗

Choose the Most Convenient Method to Graph a Line

In the following exercises, identify the most convenient method to graph each line.

Road trip Damien is driving from Chicago to Denver, a distance of 1,000 miles. The x-axis on the graph below shows the time in hours since Damien left Chicago. The y-axis represents the distance he has left to drive.
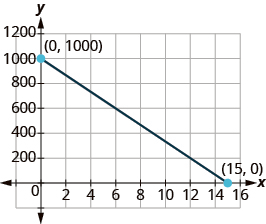
The graph shows the x y-coordinate plane. The x and y-axis each run from - to . A line passes through the labeled points “ordered pair 0, 1000” and “ordered pair 15, 0”.

ⓐ Find the x- and y- intercepts

ⓑ Explain what the x- and y- intercepts mean for Damien.

Answer

ⓐ (0,1,000),(15,0). ⓑ At (0,1,000) he left Chicago 0 hours ago and has 1,000 miles left to drive. At (15,0) he left Chicago 15 hours ago and has 0 miles left to drive.

11.3-199 §11.3 source ↗

Choose the Most Convenient Method to Graph a Line

In the following exercises, identify the most convenient method to graph each line.

How do you find the x-intercept of the graph of 3x−2y=6?

Answer

Answers will vary.

11.3-201 §11.3 source ↗

Choose the Most Convenient Method to Graph a Line

In the following exercises, identify the most convenient method to graph each line.

Do you prefer to graph the equation 4x+y=−4 by plotting points or intercepts? Why?

Answer

Answers will vary.

Be Prepared 11.10 §11.4 source ↗

Simplify: 1−48−2.
If you missed this problem, review Example 4.49.
Example 4.49 in the book ↗

Answer

− 1 2

Be Prepared 11.11 §11.4 source ↗

Divide: 04,40.
If you missed this problem, review Example 7.37.
Example 7.37 in the book ↗

Answer

0, undefined

Be Prepared 11.12 §11.4 source ↗

Simplify: 15−3, −153, −15−3.
If you missed this problem, review Example 4.47.
Example 4.47 in the book ↗

Answer

− 5 , − 5 , 5

Try It 11.58 §11.4 source ↗

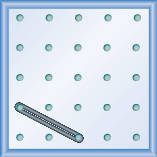
What is the slope of the line on the geoboard shown?
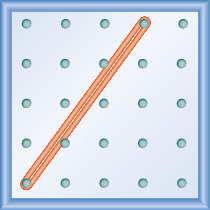
The figure shows a grid of evenly spaced dots. There are 5 rows and 5 columns. There is a rubber band style loop connecting the point in column 1 row 5 and the point in column 4 row 1.

Answer

4 3

Try It 11.59 §11.4 source ↗

What is the slope of the line on the geoboard shown?
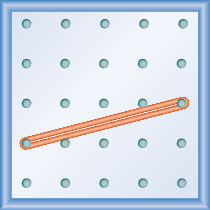
The figure shows a grid of evenly spaced dots. There are 5 rows and 5 columns. There is a rubber band style loop connecting the point in column 1 row 4 and the point in column 5 row 3.

Answer

1 4

Try It 11.60 §11.4 source ↗

What is the slope of the line on the geoboard?
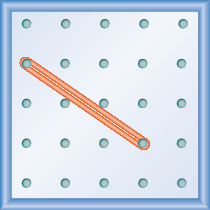
The figure shows a grid of evenly spaced dots. There are 5 rows and 5 columns. There is a rubber band style loop connecting the point in column 1 row 2 and the point in column 4 row 4.

Answer

− 2 3

Try It 11.61 §11.4 source ↗

What is the slope of the line on the geoboard?
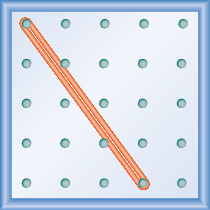
The figure shows a grid of evenly spaced dots. There are 5 rows and 5 columns. There is a rubber band style loop connecting the point in column 1 row 1 and the point in column 4 row 5.

Answer

− 4 3

Try It 11.62 §11.4 source ↗

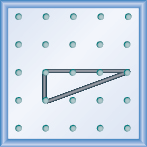
Use a geoboard to model a line with the given slope: m=13.

Answer


The figure shows a grid of evenly spaced dots. There are 5 rows and 5 columns. There is a rubber band style triangle connecting three of the three points at column 2 row 3, column 2 row 4,and column 5 row 3.

Try It 11.63 §11.4 source ↗

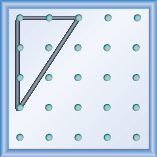
Use a geoboard to model a line with the given slope: m=32.

Answer


The figure shows a grid of evenly spaced dots. There are 5 rows and 5 columns. There is a rubber band style triangle connecting three of the three points at column 1 row 1, column 1 row 4,and column 3 row 1.

Try It 11.64 §11.4 source ↗

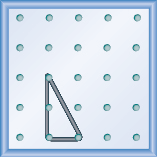
Use a geoboard to model a line with the given slope: m=−21.

Answer


The figure shows a grid of evenly spaced dots. There are 5 rows and 5 columns. There is a rubber band style triangle connecting three of the three points at column 2 row 3, column 2 row 5,and column 3 row 5.

Try It 11.65 §11.4 source ↗

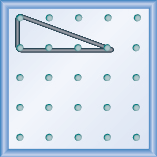
Use a geoboard to model a line with the given slope: m=−13.

Answer


The figure shows a grid of evenly spaced dots. There are 5 rows and 5 columns. There is a rubber band style triangle connecting three of the three points at column 1 row 1, column 1 row 2,and column 4 row 2.

Try It 11.66 §11.4 source ↗

Find the slope of the line:
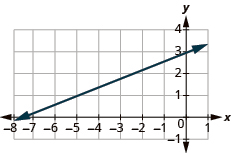
The graph shows the x y-coordinate plane. The x-axis runs from -8 to 1. The y-axis runs from -1 to 4. A line passes through the points “ordered pair -8, 1” and “ordered pair 0, 3”.

Answer

2 5

Try It 11.67 §11.4 source ↗

Find the slope of the line:
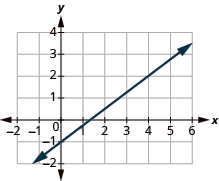
The graph shows the x y-coordinate plane. The x-axis runs from -2 to 6. The y-axis runs from -2 to 4. A line passes through the points “ordered pair 4, 2” and “ordered pair 0, -1”.

Answer

3 4

Try It 11.68 §11.4 source ↗

Find the slope of the line:
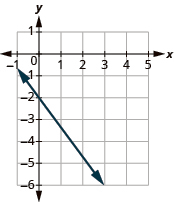
The graph shows the x y-coordinate plane. The x-axis runs from -1 to 5. The y-axis runs from -6 to 1. A line passes through the points “ordered pair 3, -6” and “ordered pair 0, -2”.

Answer

− 4 3

Try It 11.69 §11.4 source ↗

Find the slope of the line:
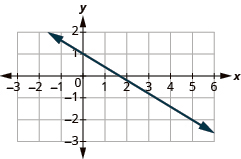
The graph shows the x y-coordinate plane. The x-axis runs from -3 to 6. The y-axis runs from -3 to 2. A line passes through the points “ordered pair 5, -2” and “ordered pair 0, 1”.

Answer

− 3 5

Try It 11.70 §11.4 source ↗

Find the slope of the line:
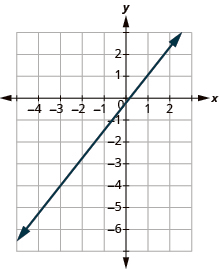
The graph shows the x y-coordinate plane. The x-axis runs from -4 to 2. The y-axis runs from -5 to 2. A line passes through the points “ordered pair -3, -4” and “ordered pair 1, 1”.

Answer

5 4

Try It 11.71 §11.4 source ↗

Find the slope of the line:
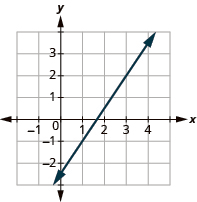
The graph shows the x y-coordinate plane. The x-axis runs from -1 to 4. The y-axis runs from -2 to 3. A line passes through the points “ordered pair 3, 2” and “ordered pair 1, -1”.

Answer

3 2

Try It 11.72 §11.4 source ↗

Find the slope of the line: x=−4.

Answer

undefined

Try It 11.73 §11.4 source ↗

Find the slope of the line: y=7.

Answer

0

Try It 11.74 §11.4 source ↗

Find the slope of the line through the given points: (8,5) and (6,3).

Answer

1

Try It 11.75 §11.4 source ↗

Find the slope of the line through the given points: (1,5) and (5,9).

Answer

1

Try It 11.76 §11.4 source ↗

Find the slope of the line through the pair of points: (−3,4) and (2,−1).

Answer

−1

Try It 11.77 §11.4 source ↗

Find the slope of the line through the pair of points: (−2,6) and (−3,−4).

Answer

10

Try It 11.78 §11.4 source ↗

Graph the line passing through the point with the given slope:

(2,−2),m=43

Answer


The graph shows the x y-coordinate plane. The x-axis runs from -12 to 12. The y-axis runs from -12 to 12. A line passes through the points “ordered pair -2, 3” and “ordered pair 8, 6”.

Try It 11.79 §11.4 source ↗

Graph the line passing through the point with the given slope:

(−2,3),m=14

Answer


The graph shows the x y-coordinate plane. The x-axis runs from -12 to 12. The y-axis runs from -12 to 12. A line passes through the points “ordered pair -2, 3” and “ordered pair 2, 4”.

Try It 11.80 §11.4 source ↗

Graph the line with the given intercept and slope:

y-intercept 4,m=−52

Answer


The graph shows the x y-coordinate plane. The x-axis runs from -12 to 12. The y-axis runs from -12 to 12. A line passes through the points “ordered pair 0, 4” and “ordered pair 4, -6”.

Try It 11.81 §11.4 source ↗

Graph the line with the given intercept and slope:

x-intercept −3,m=−34

Answer


The graph shows the x y-coordinate plane. The x-axis runs from -12 to 12. The y-axis runs from -12 to 12. A line passes through the points “ordered pair -3, 0” and “ordered pair 8, -8”.

Try It 11.82 §11.4 source ↗

Graph the line passing through the point (−2,1) and with slope m=3.

Answer


The graph shows the x y-coordinate plane. The x-axis runs from -7 to 7. The y-axis runs from -7 to 7. A line passes through the points “ordered pair -2, 1” and “ordered pair 0, 7”.

Try It 11.83 §11.4 source ↗

Graph the line passing through the point (4,−2) and with slope m=−2.

Answer


The graph shows the x y-coordinate plane. The x-axis runs from -7 to 7. The y-axis runs from -7 to 7. A line passes through the points “ordered pair 0, 6” and “ordered pair 0, 3”.

Try It 11.84 §11.4 source ↗

Find the slope given rise and run: A roof with a rise =14 and run =24.

Answer

7 12

Try It 11.85 §11.4 source ↗

Find the slope given rise and run: A roof with a rise =15 and run =36.

Answer

5 12

Try It 11.86 §11.4 source ↗

Find the slope of the pipe: The pipe slopes down 13 inch per foot.

Answer

− 1 36

Try It 11.87 §11.4 source ↗

Find the slope of the pipe: The pipe slopes down 34 inch per yard.

Answer

− 1 48

11.4-203 §11.4 source ↗

Use Geoboards to Model Slope

In the following exercises, find the slope modeled on each geoboard.
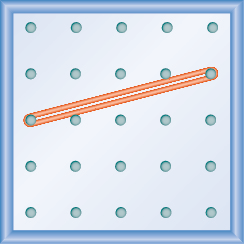
The figure shows a grid of evenly spaced dots. There are 5 rows and 5 columns. There is a rubber band style loop connecting the point in column 1 row 3 and the point in column 5 row 2.

Answer

1 4

11.4-205 §11.4 source ↗

Use Geoboards to Model Slope

In the following exercises, find the slope modeled on each geoboard.
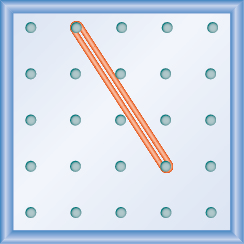
The figure shows a grid of evenly spaced dots. There are 5 rows and 5 columns. There is a rubber band style loop connecting the point in column 2 row 1 and the point in column 4 row 4.

Answer

− 3 2

11.4-207 §11.4 source ↗

In the following exercises, model each slope. Draw a picture to show your results.

2 3

Answer


The figure shows a grid of evenly spaced dots. There are 5 rows and 5 columns. There is a rubber band style loop connecting the point in column 2 row 5 and the point in column 5 row 3.

11.4-209 §11.4 source ↗

In the following exercises, model each slope. Draw a picture to show your results.

1 4

Answer


The figure shows a grid of evenly spaced dots. There are 5 rows and 5 columns. There is a rubber band style loop connecting the point in column 1 row 4 and the point in column 5 row 3.

11.4-211 §11.4 source ↗

In the following exercises, model each slope. Draw a picture to show your results.

− 1 2

Answer


The figure shows a grid of evenly spaced dots. There are 5 rows and 5 columns. There is a rubber band style loop connecting the point in column 1 row 4 and the point in column 3 row 5.

11.4-213 §11.4 source ↗

In the following exercises, model each slope. Draw a picture to show your results.

− 2 3

Answer


The figure shows a grid of evenly spaced dots. There are 5 rows and 5 columns. There is a rubber band style loop connecting the point in column 1 row 2 and the point in column 4 row 4.

11.4-215 §11.4 source ↗

Find the Slope of a Line from its Graph

In the following exercises, find the slope of each line shown.
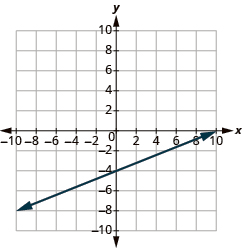
The graph shows the x y-coordinate plane. The x-axis runs from -10 to 10. The y-axis runs from -10 to 10. A line passes through the points “ordered pair 0, -4” and “ordered pair 10, 0”.

Answer

2 5

11.4-217 §11.4 source ↗

Find the Slope of a Line from its Graph

In the following exercises, find the slope of each line shown.
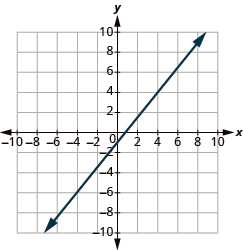
The graph shows the x y-coordinate plane. The x-axis runs from -12 to 12. The y-axis runs from -12 to 12. A line passes through the points “ordered pair 0, -1” and “ordered pair 1, 0”.

Answer

5 4

11.4-219 §11.4 source ↗

Find the Slope of a Line from its Graph

In the following exercises, find the slope of each line shown.
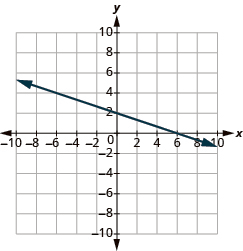
The graph shows the x y-coordinate plane. The x-axis runs from -10 to 10. The y-axis runs from -10 to 10. A line passes through the points “ordered pair 0, 2” and “ordered pair 6, 0”.

Answer

− 1 3

11.4-221 §11.4 source ↗

Find the Slope of a Line from its Graph

In the following exercises, find the slope of each line shown.
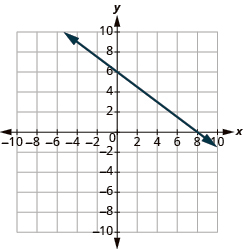
The graph shows the x y-coordinate plane. The x-axis runs from -10 to 10. The y-axis runs from -10 to 10. A line passes through the points “ordered pair 0, 6” and “ordered pair 8, 0”.

Answer

− 3 4

11.4-223 §11.4 source ↗

Find the Slope of a Line from its Graph

In the following exercises, find the slope of each line shown.
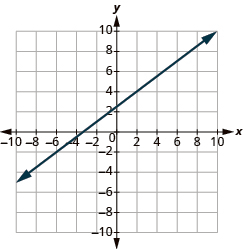
The graph shows the x y-coordinate plane. The x-axis runs from -10 to 10. The y-axis runs from -10 to 10. A line passes through the points “ordered pair -4, 0” and “ordered pair -4, 6”.

Answer

3 4

11.4-225 §11.4 source ↗

Find the Slope of a Line from its Graph

In the following exercises, find the slope of each line shown.
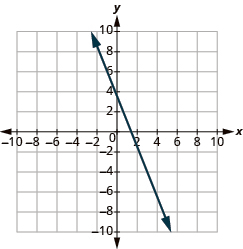
The graph shows the x y-coordinate plane. The x-axis runs from -10 to 10. A line passes through the points “ordered pair 0, 4” and “ordered pair 4, -6”.

Answer

− 5 2

11.4-227 §11.4 source ↗

Find the Slope of a Line from its Graph

In the following exercises, find the slope of each line shown.
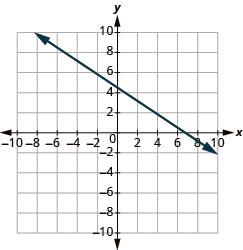
The graph shows the x y-coordinate plane. The x-axis runs from -10 to 10. A line passes through the points “ordered pair 1, 4” and “ordered pair 7, 0”.

Answer

− 2 3

11.4-229 §11.4 source ↗

Find the Slope of a Line from its Graph

In the following exercises, find the slope of each line shown.
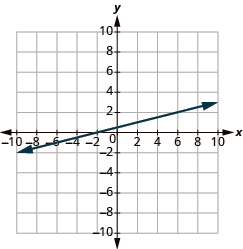
The graph shows the x y-coordinate plane. The x-axis runs from -10 to 10. A line passes through the points “ordered pair 2, 0” and “ordered pair 10, 4”.

Answer

1 4

11.4-231 §11.4 source ↗

Find the Slope of Horizontal and Vertical Lines

In the following exercises, find the slope of each line.

y = 3

Answer

0

11.4-233 §11.4 source ↗

Find the Slope of Horizontal and Vertical Lines

In the following exercises, find the slope of each line.

x = 4

Answer

undefined

11.4-235 §11.4 source ↗

Find the Slope of Horizontal and Vertical Lines

In the following exercises, find the slope of each line.

y = −2

Answer

0

11.4-237 §11.4 source ↗

Find the Slope of Horizontal and Vertical Lines

In the following exercises, find the slope of each line.

x = −5

Answer

undefined

11.4-239 §11.4 source ↗

Use the Slope Formula to find the Slope of a Line between Two Points

In the following exercises, use the slope formula to find the slope of the line between each pair of points.

( 1 , 4 ) , ( 3 , 9 )

Answer

5 2

11.4-241 §11.4 source ↗

Use the Slope Formula to find the Slope of a Line between Two Points

In the following exercises, use the slope formula to find the slope of the line between each pair of points.

( 0 , 3 ) , ( 4 , 6 )

Answer

3 4

11.4-243 §11.4 source ↗

Use the Slope Formula to find the Slope of a Line between Two Points

In the following exercises, use the slope formula to find the slope of the line between each pair of points.

( 2 , 5 ) , ( 4 , 0 )

Answer

− 5 2

11.4-245 §11.4 source ↗

Use the Slope Formula to find the Slope of a Line between Two Points

In the following exercises, use the slope formula to find the slope of the line between each pair of points.

(−3,3), (2,−5)

Answer

− 8 5

11.4-247 §11.4 source ↗

Use the Slope Formula to find the Slope of a Line between Two Points

In the following exercises, use the slope formula to find the slope of the line between each pair of points.

(−1,−2), (2,5)

Answer

7 3

11.4-249 §11.4 source ↗

Use the Slope Formula to find the Slope of a Line between Two Points

In the following exercises, use the slope formula to find the slope of the line between each pair of points.

(4,−5), (1,−2)

Answer

−1

11.4-251 §11.4 source ↗

Graph a Line Given a Point and the Slope

In the following exercises, graph the line given a point and the slope.

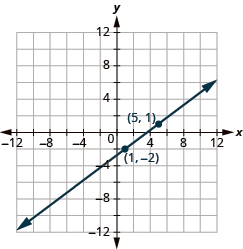
( 1 , −2 ) ; m = 3 4

Answer


The graph shows the x y-coordinate plane. The x-axis runs from -12 to 12. The y-axis runs from 12 to -12. A line passes through the points “ordered pair 5, 1” and “ordered pair 1, -2”

11.4-253 §11.4 source ↗

Graph a Line Given a Point and the Slope

In the following exercises, graph the line given a point and the slope.

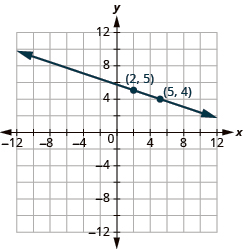
( 2 , 5 ) ; m = − 1 3

Answer


The graph shows the x y-coordinate plane. The x-axis runs from -12 to 12. The y-axis runs from 12 to -12. A line passes through the points “ordered pair 2, 5” and “ordered pair 5, 4”.

11.4-255 §11.4 source ↗

Graph a Line Given a Point and the Slope

In the following exercises, graph the line given a point and the slope.

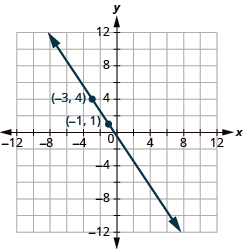
(−3,4); m= − 3 2

Answer


The graph shows the x y-coordinate plane. The x-axis runs from -12 to 12. The y-axis runs from 12 to -12. A line passes through the points “ordered pair -3, 4” and “ordered pair -1, 1”.

11.4-257 §11.4 source ↗

Graph a Line Given a Point and the Slope

In the following exercises, graph the line given a point and the slope.

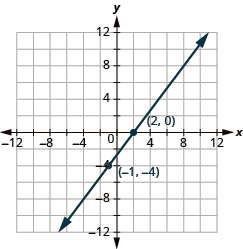
(−1,−4); m= 4 3

Answer


The graph shows the x y-coordinate plane. The x-axis runs from -12 to 12. The y-axis runs from 12 to -12. A line passes through the points “ordered pair 2,0” and “ordered pair -1, -4”.

11.4-259 §11.4 source ↗

Graph a Line Given a Point and the Slope

In the following exercises, graph the line given a point and the slope.

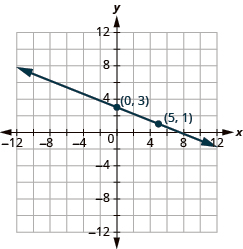
( 0 , 3 ) ; m = − 2 5

Answer


The graph shows the x y-coordinate plane. The x-axis runs from -12 to 12. The y-axis runs from 12 to -12. A line passes through the points “ordered pair 0, 3” and “ordered pair 5, 1”.

11.4-261 §11.4 source ↗

Graph a Line Given a Point and the Slope

In the following exercises, graph the line given a point and the slope.

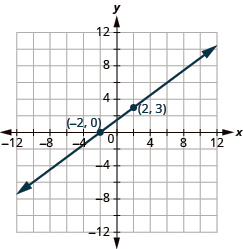
( −2 , 0 ) ; m = 3 4

Answer


The graph shows the x y-coordinate plane. The x-axis runs from -12 to 12. The y-axis runs from 12 to -12. A line passes through the points “ordered pair -2,0” and “ordered pair 2, 3”.

11.4-263 §11.4 source ↗

Graph a Line Given a Point and the Slope

In the following exercises, graph the line given a point and the slope.

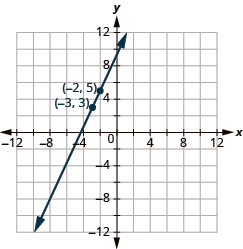
( −3 , 3 ) ; m = 2

Answer


The graph shows the x y-coordinate plane. The x-axis runs from -12 to 12. The y-axis runs from 12 to -12. A line passes through the points “ordered pair -3, 3” and “ordered pair -2, 5”.

11.4-265 §11.4 source ↗

Graph a Line Given a Point and the Slope

In the following exercises, graph the line given a point and the slope.

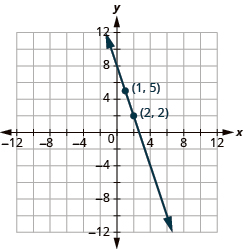
( 1 , 5 ) ; m = −3

Answer


The graph shows the x y-coordinate plane. The x-axis runs from -12 to 12. The y-axis runs from 12 to -12. A line passes through the points “ordered pair 1, 5” and “ordered pair 2, 2”.

11.4-267 §11.4 source ↗

Solve Slope Applications

In the following exercises, solve these slope applications.

Slope of a roof A fairly easy way to determine the slope is to take a 12-inch level and set it on one end on the roof surface. Then take a tape measure or ruler, and measure from the other end of the level down to the roof surface. You can use these measurements to calculate the slope of the roof. What is the slope of the roof in this picture?
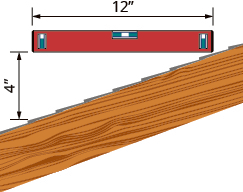
The figure shows a wood board at a diagonal representing a side-view slice of a pitched roof. A vertical line segment with arrows on both ends measures the vertical change in height of the roof and is labeled “4 inches”. A level tool is in a horizontal position above the board and above it is a line segment with arrows on both ends labeled “12 inches”.The figure shows a wood board at a diagonal representing a side-view slice of a pitched roof. A vertical line segment with arrows on both ends measures the vertical change in height of the roof and is labeled “4 inches”. A level tool is in a horizontal position above the board and above it is a line segment with arrows on both ends labeled “12 inches”.

Answer

1 3

11.4-269 §11.4 source ↗

Solve Slope Applications

In the following exercises, solve these slope applications.

Road grade A local road has a grade of 6%. The grade of a road is its slope expressed as a percent.

ⓐ Find the slope of the road as a fraction and then simplify the fraction.

ⓑ What rise and run would reflect this slope or grade?

Answer

ⓐ 350ⓑ rise= 3; run= 50

11.4-271 §11.4 source ↗

Solve Slope Applications

In the following exercises, solve these slope applications.

Wheelchair ramp The rules for wheelchair ramps require a maximum 1 inch rise for a 12 inch run.

ⓐ What run must the ramp have to accommodate a 24-inch rise to the door?

ⓑ Draw a model of this ramp.

Answer

ⓐ 288 inches (24 feet)

ⓑ Models will vary.

11.4-273 §11.4 source ↗

Solve Slope Applications

In the following exercises, solve these slope applications.

What does the sign of the slope tell you about a line?

Answer

Answers will vary.

11.4-275 §11.4 source ↗

Solve Slope Applications

In the following exercises, solve these slope applications.

Why is the slope of a vertical line undefined?

Answer

Answers will vary.

11.R-277 §11.R source ↗

Plot Points in a Rectangular Coordinate System

In the following exercises, plot each point in a rectangular coordinate system.

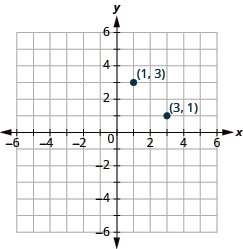
( 1 , 3 ) , ( 3 , 1 )

Answer


The graph shows the x y-coordinate plane. The x-axis runs from -6 to 6. The y-axis runs from 6 to -6. The points “ordered pair 1,3” and “ordered pair 3,1” are plotted.

11.R-279 §11.R source ↗

In the following exercises, plot each point in a rectangular coordinate system and identify the quadrant in which the point is located.

ⓐ (−1,−5)

ⓑ (−3,4)

ⓒ (2,−3)

ⓓ (1,52)

Answer

ⓐ III

ⓑ II

ⓒ IV

ⓐ I


A Cartesian coordinate plane, also known as an xy-grid, displays four quadrants (I, II, III, IV) and four distinct points labeled a, b, c, and d, plotted within these quadrants.

11.R-281 §11.R source ↗

Identify Points on a Graph

In the following exercises, name the ordered pair of each point shown in the rectangular coordinate system.
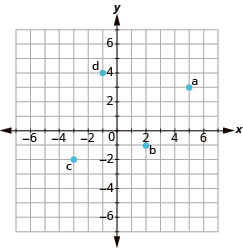
The graph shows the x y-coordinate plane. The axes run from -7 to 7. “a” is plotted at 5, 3, “b” at 2, -1, “c” at -3,-2, and “d” at -1,4.

Answer

ⓐ (5,3)

ⓑ (2,−1)

ⓒ (−3,−2)

ⓓ (−1,4)

11.R-283 §11.R source ↗

Identify Points on a Graph

In the following exercises, name the ordered pair of each point shown in the rectangular coordinate system.
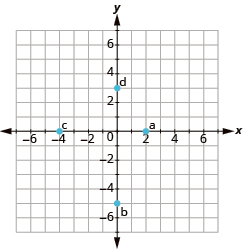
The graph shows the x y-coordinate plane. The axes run from -7 to 7. “a” is plotted at 2, 0, “b” at 0, -5, “c” at -4,0, and “d” at 0,3.

Answer

ⓐ (2,0)

ⓑ (0,−5)

ⓒ (−4,0)

ⓓ (0,3)

11.R-285 §11.R source ↗

Verify Solutions to an Equation in Two Variables

In the following exercises, find the ordered pairs that are solutions to the given equation.

5 x + y = 10

ⓐ (5,1)

ⓑ (2,0)

ⓒ (4,−10)

Answer

ⓑ (2, 0),ⓒ (4, –10)

11.R-287 §11.R source ↗

Complete a Table of Solutions to a Linear Equation in Two Variables

In the following exercises, complete the table to find solutions to each linear equation.

y = 4 x − 1

x y (x,y)
0
1
−2

Answer

x y (x,y)
0 −1 (0,−1)
1 3 (1,3)
−2 −9 (−2,−9)

11.R-289 §11.R source ↗

Complete a Table of Solutions to a Linear Equation in Two Variables

In the following exercises, complete the table to find solutions to each linear equation.

x + 2 y = 5

x y (x,y)
0
1
−1

Answer

x y (x,y)
5 0 (5,0)
1 2 (1,2)
−1 3 (−1,3)

11.R-291 §11.R source ↗

Find Solutions to a Linear Equation in Two Variables

In the following exercises, find three solutions to each linear equation.

x + y = 3

Answer

Answers will vary.

11.R-293 §11.R source ↗

Find Solutions to a Linear Equation in Two Variables

In the following exercises, find three solutions to each linear equation.

y = 3 x + 1

Answer

Answers will vary.

11.R-295 §11.R source ↗

Recognize the Relation Between the Solutions of an Equation and its Graph

In each of the following exercises, an equation and its graph is shown. For each ordered pair, decide
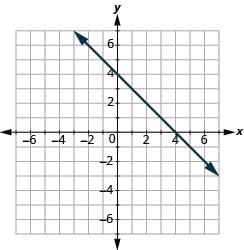
y=−x+4

The graph shows the x y-coordinate plane. The axes run from -7 to 7. A line passes through the points “ordered pair 0, 4” and “ordered pair 4, 0”.

1. (0,4)

2. (−1,3)

3. (2,2)

4. (−2,6)

Answer

ⓐ yes ⓑ yes

ⓐ no ⓑ no

ⓐ yes ⓑ yes

ⓐ yes ⓑ yes

11.R-297 §11.R source ↗

Graph a Linear Equation by Plotting Points

In the following exercises, graph by plotting points.

y = 4 x − 3

Answer


The graph shows the x y-coordinate plane. Each axis runs from -6 to 6. A line passes through the points “ordered pair 1, 1” and “ordered pair 0, -3”.

11.R-299 §11.R source ↗

Graph a Linear Equation by Plotting Points

In the following exercises, graph by plotting points.

2 x + y = 7

Answer


The graph shows the x y-coordinate plane. Each axis runs from -6 to 6. A line passes through the points “ordered pair 1, 5” and “ordered pair 0, 7”.

11.R-301 §11.R source ↗

Graph Vertical and Horizontal lines

In the following exercises, graph the vertical or horizontal lines.

x = 3

Answer


The graph shows the x y-coordinate plane. Each axis runs from -6 to 6. A vertical line passes through the point “ordered pair 0, 3”.

11.R-303 §11.R source ↗

Identify the Intercepts on a Graph

In the following exercises, find the x- and y-intercepts.

The graph shows the x y-coordinate plane. The x-axis runs from -1 to 6. The y-axis runs from -4 to 2. A line passes through the points “ordered pair 5, 1” and “ordered pair 0, -3”.

Answer

(0,3) (3,0)

11.R-305 §11.R source ↗

Find the Intercepts from an Equation of a Line

In the following exercises, find the intercepts.

x − y = −1

Answer

(−1,0) (0,1)

11.R-307 §11.R source ↗

Find the Intercepts from an Equation of a Line

In the following exercises, find the intercepts.

y = 3 x

Answer

(0,0)

11.R-309 §11.R source ↗

Graph a Line Using the Intercepts

In the following exercises, graph using the intercepts.

x + y = −2

Answer


This answer graph shows the x y-coordinate plane. The x and y-axis each run from -6 to 6. The equation x plus y equals -2 is shown. A line passes through the intercepts with coordinates 0, –2 and –2, 0.

11.R-311 §11.R source ↗

Choose the Most Convenient Method to Graph a Line

In the following exercises, identify the most convenient method to graph each line.

y = −3

Answer

horizontal line

11.R-313 §11.R source ↗

Choose the Most Convenient Method to Graph a Line

In the following exercises, identify the most convenient method to graph each line.

x − y = 2

Answer

intercepts

11.R-315 §11.R source ↗

Choose the Most Convenient Method to Graph a Line

In the following exercises, identify the most convenient method to graph each line.

y = 3 4 x − 1

Answer

plotting points

11.R-317 §11.R source ↗

Use Geoboards to Model Slope

In the following exercises, find the slope modeled on each geoboard.
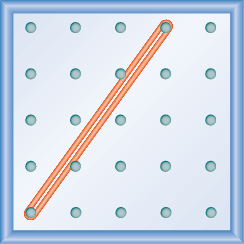
The figure shows a grid of evenly spaced dots. There are 5 rows and 5 columns. There is a rubber band style loop connecting the point in column 1 row 5 and the point in column 4 row 1.

Answer

4 3

11.R-319 §11.R source ↗

Use Geoboards to Model Slope

In the following exercises, find the slope modeled on each geoboard.
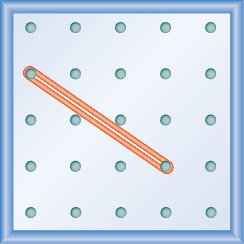
The figure shows a grid of evenly spaced dots. There are 5 rows and 5 columns. There is a rubber band style loop connecting the point in column 1 row 2 and the point in column 4 row 4.

Answer

− 2 3

11.R-321 §11.R source ↗

In the following exercises, model each slope. Draw a picture to show your results.

3 2

Answer


The figure shows a grid of evenly spaced dots. There are 5 rows and 5 columns. There is a rubber band style loop connecting the point in column 1 row 5 and the point in column 3 row 2.

11.R-323 §11.R source ↗

In the following exercises, model each slope. Draw a picture to show your results.

− 1 2

Answer


The figure shows a grid of evenly spaced dots. There are 5 rows and 5 columns. There is a rubber band style loop connecting the point in column 1 row 2 and the point in column 3 row 3.

11.R-325 §11.R source ↗

Find the Slope of a Line from its Graph

In the following exercises, find the slope of each line shown.
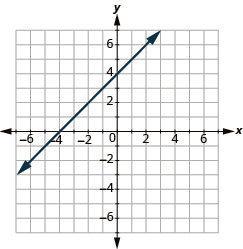
The graph shows the x y-coordinate plane. The axes run from -7 to 7. A line passes through the points “ordered pair 0, 4” and “ordered pair -4, 0”.

Answer

1

11.R-327 §11.R source ↗

Find the Slope of a Line from its Graph

In the following exercises, find the slope of each line shown.
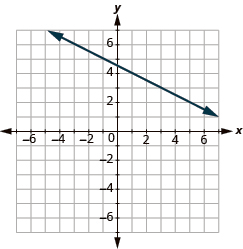
The graph shows the x y-coordinate plane. The axes run from -7 to 7. A line passes through the points “ordered pair -3, 6” and “ordered pair 5, 2”.

Answer

− 1 2

11.R-329 §11.R source ↗

Find the Slope of Horizontal and Vertical Lines

In the following exercises, find the slope of each line.
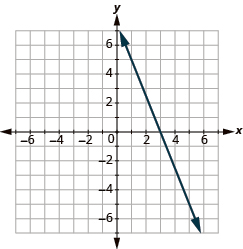
x = 5

Answer

undefined

11.R-331 §11.R source ↗

Find the Slope of Horizontal and Vertical Lines

In the following exercises, find the slope of each line.

y = −1

Answer

0

11.R-333 §11.R source ↗

Use the Slope Formula to find the Slope of a Line between Two Points

In the following exercises, use the slope formula to find the slope of the line between each pair of points.

(−1,−1), (0,−5)

Answer

−4

11.R-335 §11.R source ↗

Use the Slope Formula to find the Slope of a Line between Two Points

In the following exercises, use the slope formula to find the slope of the line between each pair of points.

(−5,−2), (3,2)

Answer

1 2

11.R-337 §11.R source ↗

Graph a Line Given a Point and the Slope

In the following exercises, graph the line given a point and the slope.

(−3,4); m= − 1 3

Answer


The graph shows the x y-coordinate plane. The x-axis runs from -6 to 6. The y-axis runs from -4 to 2. A line passes through the points “ordered pair -3, 4” and “ordered pair 1, 3”.

11.T-339 §11.T source ↗

Plot and label these points:

ⓐ (2,5)

ⓑ (−1,−3)

ⓒ (−4,0)

ⓓ (3,−5)

ⓔ (−2,1)

Answer


The graph shows the x y-coordinate plane. The axes extend from -6 to 6. a is plotted at 2, 5, b at -1, -3, c at -4, 0, d at 3, -5, and e at -2,1.

11.T-341 §11.T source ↗

Find the x-intercept and y-intercept on the line shown.

The graph shows the x y-coordinate plane. The x-axis runs from -7 to 7. The y-axis runs from -7 to 7. A line passes through the points “ordered pair 4, 0” and “ordered pair 0, -2”.

Answer

(4,0), (0,−2)

11.T-343 §11.T source ↗

Is (1,3) a solution to the equation x+4y=12? How do you know?

Answer

no; 1 + 4 · 3 ≠ 12

11.T-345 §11.T source ↗

Complete the table to find three solutions to the equation 4x+y=8

x y (x,y)
0
0
3

Answer

x y (x,y)
0 8 (0,8)
2 0 (2,0)
3 −4 (3,−4)

11.T-347 §11.T source ↗

In the following exercises, find three solutions to each equation and then graph each line.

2 x + 3 y = −6

Answer


The graph shows the x y-coordinate plane. The x-axis runs from -6 to 6. The y-axis runs from -6 to 6. A line passes through the points “ordered pair 0, -2” and “ordered pair -3, 0”.

11.T-349 §11.T source ↗

In the following exercises, find the slope of each line.

The graph shows the x y-coordinate plane. The axes run from -7 to 7. A line passes through the points “ordered pair 3, 0” and “ordered pair 1, 5”.

Answer

− 5 2

11.T-351 §11.T source ↗

In the following exercises, find the slope of each line.

Find the slope of the line y=2.

Answer

0

11.T-353 §11.T source ↗

In the following exercises, find the slope of each line.

A bicycle route climbs 20 feet for 1,000 feet of horizontal distance. What is the slope of the route?

Answer

1 50

End of the book.

Problems and answers are adapted from Prealgebra 2e by Lynn Marecek, MaryAnne Anthony-Smith and Andrea Honeycutt Mathis, OpenStax, and are used under the CC BY-NC-SA 4.0 licence. Access for free at https://openstax.org/books/prealgebra-2e/pages/1-introduction. Illustrations: Copyright Rice University, OpenStax, under CC BY-NC-SA 4.0 license. This adaptation is released under the same licence, is non-commercial, and is neither affiliated with nor endorsed by OpenStax or Rice University.