Every problem in the chapter beside the book’s answer, a chapter at a time as you scroll.
Chapter 2: Limits
146 problems · 37 figuresCheckpoint 2.1 §2.1 source ↗
Answer
Checkpoint 2.2 §2.1 source ↗
Answer
Checkpoint 2.3 §2.1 source ↗
Estimate the area between the x-axis and the graph of over the interval by using the three rectangles shown here:
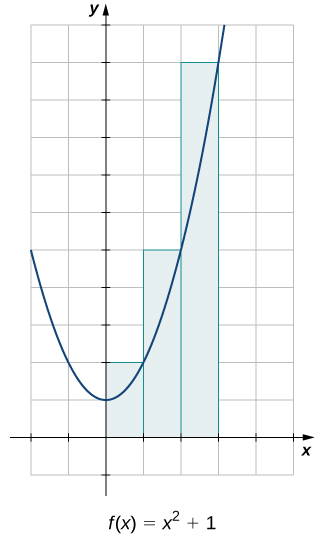
Answer
2-1 §2.1 source ↗
For the following exercises, points and are on the graph of the function
[T] Complete the following table with the appropriate values: y-coordinate of Q, the point and the slope of the secant line passing through points P and Q. Round your answer to eight significant digits.
| x | y | msec | |
|---|---|---|---|
| 1.1 | a. | e. | i. |
| 1.01 | b. | f. | j. |
| 1.001 | c. | g. | k. |
| 1.0001 | d. | h. | l. |
Answer
2-3 §2.1 source ↗
For the following exercises, points and are on the graph of the function
Use the value in the preceding exercise to find an equation of the tangent line at point P. Graph and the tangent line.
Answer
2-5 §2.1 source ↗
For the following exercises, points and are on the graph of the function
Use the values in the right column of the table in the preceding exercise to guess the value of the slope of the tangent line to f at
Answer
2-7 §2.1 source ↗
For the following exercises, points and are on the graph of the function
[T] Complete the following table with the appropriate values: y-coordinate of Q, the point and the slope of the secant line passing through points P and Q. Round your answer to eight significant digits.
| x | y | msec | |
|---|---|---|---|
| 4.1 | a. | e. | i. |
| 4.01 | b. | f. | j. |
| 4.001 | c. | g. | k. |
| 4.0001 | d. | h. | l. |
Answer
2-9 §2.1 source ↗
For the following exercises, points and are on the graph of the function
Use the value in the preceding exercise to find an equation of the tangent line at point P.
Answer
2-11 §2.1 source ↗
For the following exercises, points and are on the graph of the function
Use the values in the right column of the table in the preceding exercise to guess the value of the slope of the tangent line to f at
Answer
2-13 §2.1 source ↗
For the following exercises, points and are on the graph of the function
[T] Complete the following table with the appropriate values: y-coordinate of Q, the point and the slope of the secant line passing through points P and Q. Round your answer to eight significant digits.
| x | y | msec | |
|---|---|---|---|
| −1.05 | a. | e. | i. |
| −1.01 | b. | f. | j. |
| −1.005 | c. | g. | k. |
| −1.001 | d. | h. | l. |
Answer
2-15 §2.1 source ↗
For the following exercises, points and are on the graph of the function
Use the value in the preceding exercise to find an equation of the tangent line at point P.
Answer
2-17 §2.1 source ↗
For the following exercises, the position function of a ball dropped from the top of a 200-meter tall building is given by where position s is measured in meters and time t is measured in seconds. Round your answer to eight significant digits.
Use the preceding exercise to guess the instantaneous velocity of the ball at sec.
Answer
2-19 §2.1 source ↗
For the following exercises, consider a stone tossed into the air from ground level with an initial velocity of 15 m/sec. Its height in meters at time t seconds is
Use the preceding exercise to guess the instantaneous velocity of the stone at sec.
Answer
2-21 §2.1 source ↗
For the following exercises, consider a rocket shot into the air that then returns to Earth. The height of the rocket in meters is given by where t is measured in seconds.
Use the preceding exercise to guess the instantaneous velocity of the rocket at sec.
Answer
2-23 §2.1 source ↗
For the following exercises, consider an athlete running a 40-m dash. The position of the athlete is given by where d is the position in meters and t is the time elapsed, measured in seconds.
Use the preceding exercise to guess the instantaneous velocity of the runner at sec.
Answer
2-25 §2.1 source ↗
For the following exercises, consider the function
Use the preceding exercise to find the aproximate value of the area between the x-axis and the graph of f over the interval using rectangles. For the rectangles, use the square units, and approximate both above and below the lines. Use geometry to find the exact answer.
Answer
2-27 §2.1 source ↗
For the following exercises, consider the function (Hint: This is the upper half of a circle of radius 1 positioned at
Use the preceding exercise to find the aproximate area between the x-axis and the graph of f over the interval using rectangles. For the rectangles, use squares 0.4 by 0.4 units, and approximate both above and below the lines. Use geometry to find the exact answer.
Answer
2-29 §2.1 source ↗
For the following exercises, consider the function
Approximate the area of the region between the x-axis and the graph of f over the interval
Answer
Checkpoint 2.4 §2.2 source ↗
Answer
Checkpoint 2.5 §2.2 source ↗
Answer
Checkpoint 2.6 §2.2 source ↗
Answer
Checkpoint 2.7 §2.2 source ↗
Use a table of functional values to estimate the following limits, if possible.
a.
b.
Answer
Checkpoint 2.8 §2.2 source ↗
Evaluate each of the following limits, if possible. Use a table of functional values and graph to confirm your conclusion.
a.
b.
c.
Answer
Checkpoint 2.9 §2.2 source ↗
Evaluate each of the following limits. Identify any vertical asymptotes of the function
a.
b.
c.
Answer
Checkpoint 2.10 §2.2 source ↗
Evaluate for shown here:
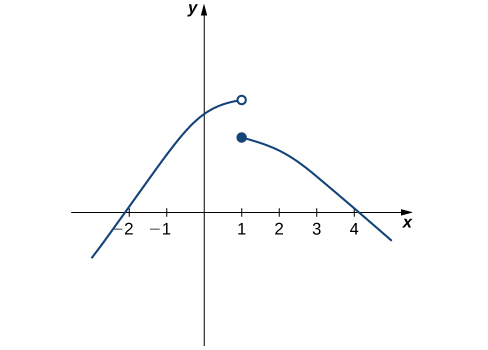
Answer
2-31 §2.2 source ↗
For the following exercises, consider the function
What do your results in the preceding exercise indicate about the two-sided limit Explain your response.
Answer
2-33 §2.2 source ↗
For the following exercises, consider the function
What does the table of values in the preceding exercise indicate about the function
Answer
2-35 §2.2 source ↗
In the following exercises, use the given values to set up a table to evaluate the limits. Round your solutions to eight decimal places.
[T]
| x | x | |||
|---|---|---|---|---|
| −0.1 | a. | 0.1 | e. | |
| −0.01 | b. | 0.01 | f. | |
| −0.001 | c. | 0.001 | g. | |
| −0.0001 | d. | 0.0001 | h. |
Answer
2-37 §2.2 source ↗
In the following exercises, use the given values to set up a table to evaluate the limits. Round your solutions to eight decimal places.
Use the preceding two exercises to conjecture (guess) the value of the following limit: for a, a positive real value.
Answer
2-39 §2.2 source ↗
[T] In the following exercises, set up a table of values to find the indicated limit. Round to eight digits.
| x | x | |||
|---|---|---|---|---|
| 0.9 | a. | 1.1 | e. | |
| 0.99 | b. | 1.01 | f. | |
| 0.999 | c. | 1.001 | g. | |
| 0.9999 | d. | 1.0001 | h. |
Answer
2-41 §2.2 source ↗
[T] In the following exercises, set up a table of values to find the indicated limit. Round to eight digits.
| z | z | |||
|---|---|---|---|---|
| −0.1 | a. | 0.1 | e. | |
| −0.01 | b. | 0.01 | f. | |
| −0.001 | c. | 0.001 | g. | |
| −0.0001 | d. | 0.0001 | h. |
Answer
2-43 §2.2 source ↗
[T] In the following exercises, set up a table of values to find the indicated limit. Round to eight digits.
| x | x | |||
|---|---|---|---|---|
| 1.9 | a. | 2.1 | e. | |
| 1.99 | b. | 2.01 | f. | |
| 1.999 | c. | 2.001 | g. | |
| 1.9999 | d. | 2.0001 | h. |
Answer
2-45 §2.2 source ↗
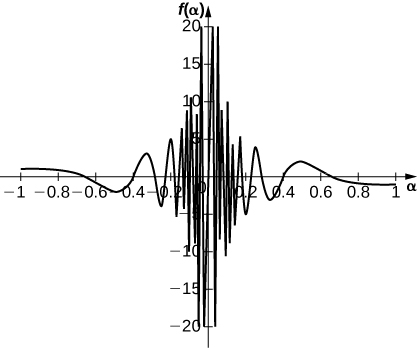
[T] In the following exercises, set up a table of values and round to eight significant digits. Based on the table of values, make a guess about what the limit is. Then, use a calculator to graph the function and determine the limit. Was the conjecture correct? If not, why does the method of tables fail?
| 0.1 | a. |
| 0.01 | b. |
| 0.001 | c. |
| 0.0001 | d. |
Answer
a. 10.00000; b. 100.00000; c. 1000.0000; d. 10,000.000; Guess: actual: DNE
2-47 §2.2 source ↗
In the following exercises, consider the graph of the function shown here. Which of the statements about are true and which are false? Explain why a statement is false.
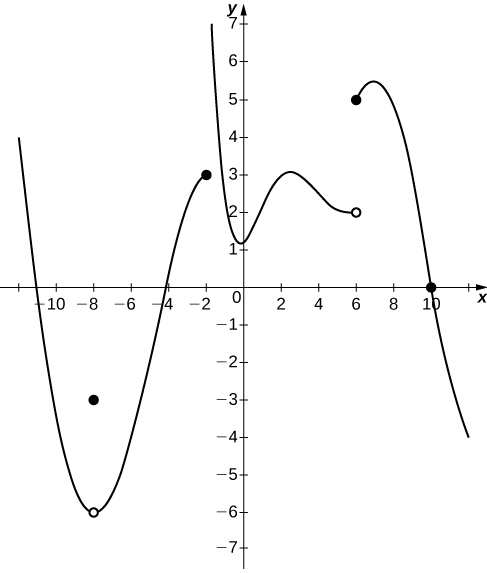
Answer
2-49 §2.2 source ↗
In the following exercises, consider the graph of the function shown here. Which of the statements about are true and which are false? Explain why a statement is false.
Answer
2-51 §2.2 source ↗
In the following exercises, use the following graph of the function to find the values, if possible. Estimate when necessary.
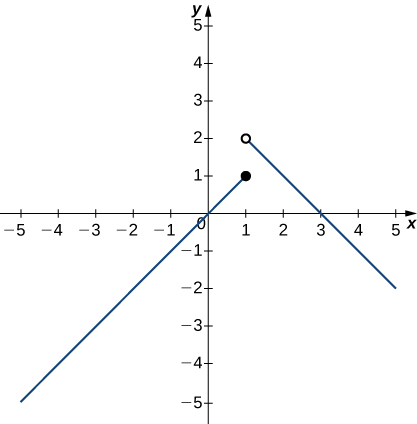
Answer
2-53 §2.2 source ↗
In the following exercises, use the following graph of the function to find the values, if possible. Estimate when necessary.
Answer
2-55 §2.2 source ↗
In the following exercises, use the graph of the function shown here to find the values, if possible. Estimate when necessary.
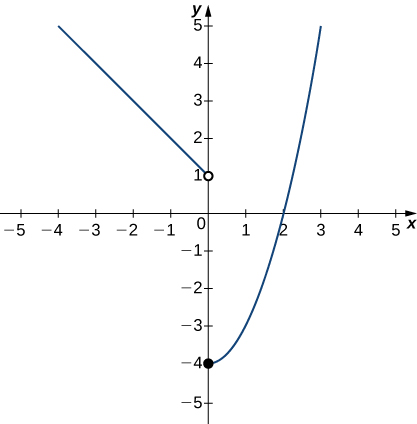
Answer
2-57 §2.2 source ↗
In the following exercises, use the graph of the function shown here to find the values, if possible. Estimate when necessary.
Answer
2-59 §2.2 source ↗
In the following exercises, use the graph of the function shown here to find the values, if possible. Estimate when necessary.
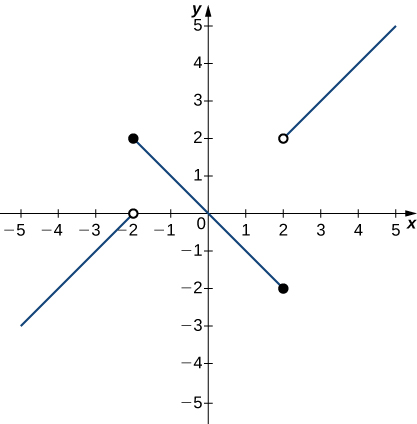
Answer
2-61 §2.2 source ↗
In the following exercises, use the graph of the function shown here to find the values, if possible. Estimate when necessary.
Answer
2-63 §2.2 source ↗
In the following exercises, use the graph of the function shown here to find the values, if possible. Estimate when necessary.
Answer
2-65 §2.2 source ↗
In the following exercises, use the graph of the function shown here to find the values, if possible. Estimate when necessary.
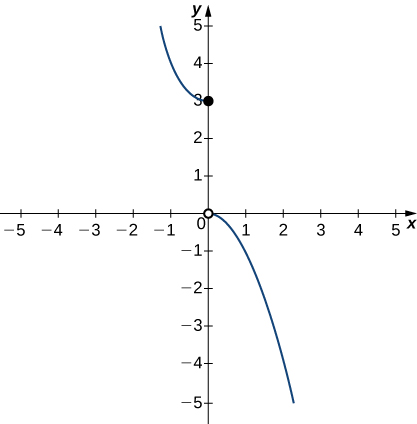
Answer
2-67 §2.2 source ↗
In the following exercises, use the graph of the function shown here to find the values, if possible. Estimate when necessary.
Answer
2-69 §2.2 source ↗
In the following exercises, use the graph of the function shown here to find the values, if possible. Estimate when necessary.
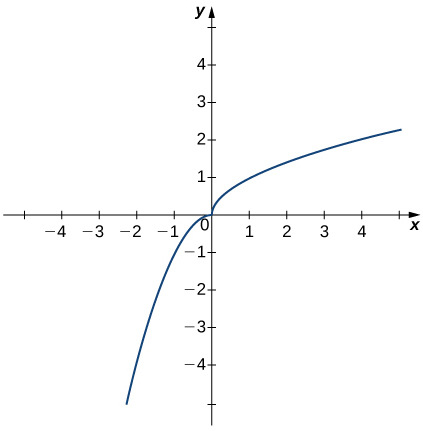
Answer
2-71 §2.2 source ↗
In the following exercises, use the graph of the function shown here to find the values, if possible. Estimate when necessary.
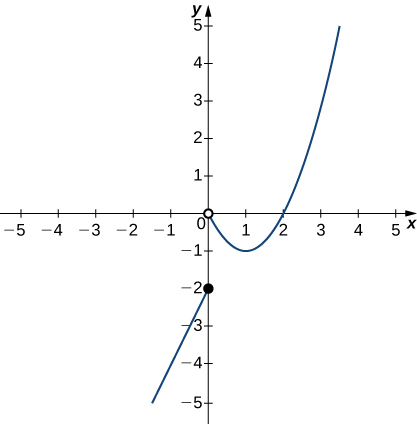
Answer
2-73 §2.2 source ↗
In the following exercises, use the graph of the function shown here to find the values, if possible. Estimate when necessary.
Answer
2-75 §2.2 source ↗
In the following exercises, use the graph of the function shown here to find the values, if possible. Estimate when necessary.
Answer
2-77 §2.2 source ↗
In the following exercises, sketch the graph of a function with the given properties.
Answer
Answers may vary.
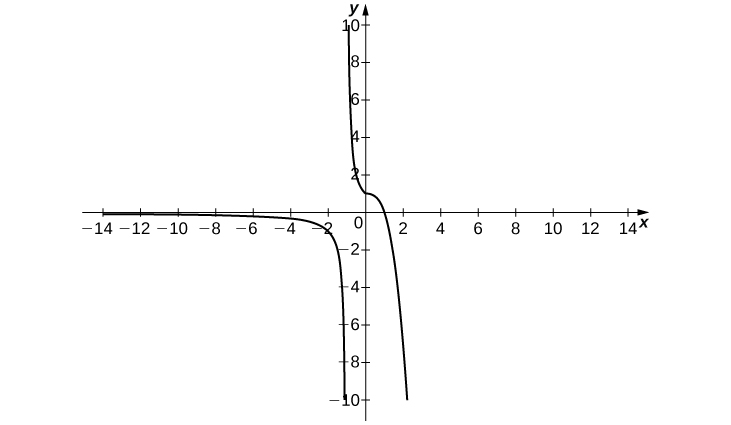
2-79 §2.2 source ↗
In the following exercises, sketch the graph of a function with the given properties.
Answer
Answers may vary.
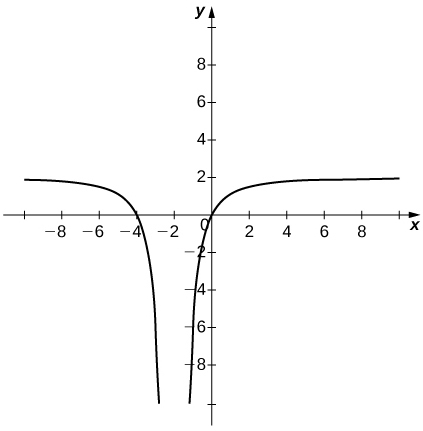
2-81 §2.2 source ↗
In the following exercises, sketch the graph of a function with the given properties.
Shock waves arise in many physical applications, ranging from supernovas to detonation waves. A graph of the density of a shock wave with respect to distance, x, is shown here. We are mainly interested in the location of the front of the shock, labeled in the diagram.
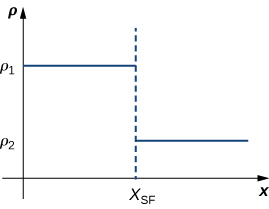
a. Evaluate
b. Evaluate
c. Evaluate Explain the physical meanings behind your answers.
Answer
Checkpoint 2.11 §2.3 source ↗
Answer
Checkpoint 2.12 §2.3 source ↗
Answer
Checkpoint 2.13 §2.3 source ↗
Answer
Checkpoint 2.14 §2.3 source ↗
Answer
Checkpoint 2.15 §2.3 source ↗
Answer
Checkpoint 2.16 §2.3 source ↗
Answer
Checkpoint 2.17 §2.3 source ↗
Answer
Checkpoint 2.18 §2.3 source ↗
Answer
Checkpoint 2.19 §2.3 source ↗
Answer
Checkpoint 2.20 §2.3 source ↗
Answer
2-83 §2.3 source ↗
In the following exercises, use the limit laws to evaluate each limit. Justify each step by indicating the appropriate limit law(s).
Answer
2-85 §2.3 source ↗
In the following exercises, use the limit laws to evaluate each limit. Justify each step by indicating the appropriate limit law(s).
Answer
2-87 §2.3 source ↗
In the following exercises, use direct substitution to evaluate each limit.
Answer
2-89 §2.3 source ↗
In the following exercises, use direct substitution to evaluate each limit.
Answer
2-91 §2.3 source ↗
In the following exercises, use direct substitution to evaluate each limit.
Answer
2-93 §2.3 source ↗
In the following exercises, use direct substitution to show that each limit leads to the indeterminate form Then, evaluate the limit.
Answer
2-95 §2.3 source ↗
In the following exercises, use direct substitution to show that each limit leads to the indeterminate form Then, evaluate the limit.
Answer
2-97 §2.3 source ↗
In the following exercises, use direct substitution to show that each limit leads to the indeterminate form Then, evaluate the limit.
Answer
2-99 §2.3 source ↗
In the following exercises, use direct substitution to show that each limit leads to the indeterminate form Then, evaluate the limit.
Answer
2-101 §2.3 source ↗
In the following exercises, use direct substitution to show that each limit leads to the indeterminate form Then, evaluate the limit.
Answer
2-103 §2.3 source ↗
In the following exercises, use direct substitution to obtain an undefined expression. Then, use the method of Example 2.23 to simplify the function to help determine the limit.
Answer
2-105 §2.3 source ↗
In the following exercises, use direct substitution to obtain an undefined expression. Then, use the method of Example 2.23 to simplify the function to help determine the limit.
Answer
2-107 §2.3 source ↗
In the following exercises, assume that and Use these three facts and the limit laws to evaluate each limit.
Answer
2-109 §2.3 source ↗
In the following exercises, assume that and Use these three facts and the limit laws to evaluate each limit.
Answer
2-111 §2.3 source ↗
In the following exercises, assume that and Use these three facts and the limit laws to evaluate each limit.
Answer
2-113 §2.3 source ↗
In the following exercises, assume that and Use these three facts and the limit laws to evaluate each limit.
Answer
2-115 §2.3 source ↗
[T] In the following exercises, use a calculator to draw the graph of each piecewise-defined function and study the graph to evaluate the given limits.
a.
b.
Answer
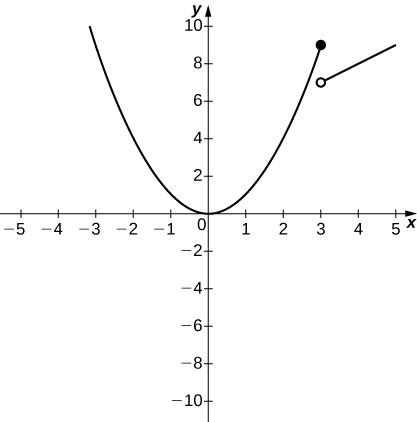
a. 9; b. 7
2-117 §2.3 source ↗
[T] In the following exercises, use a calculator to draw the graph of each piecewise-defined function and study the graph to evaluate the given limits.
a.
b.
Answer
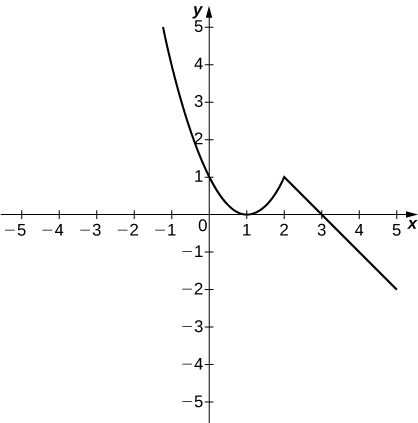
a. 1; b. 1
2-119 §2.3 source ↗
In the following exercises, use the following graphs and the limit laws to evaluate each limit.
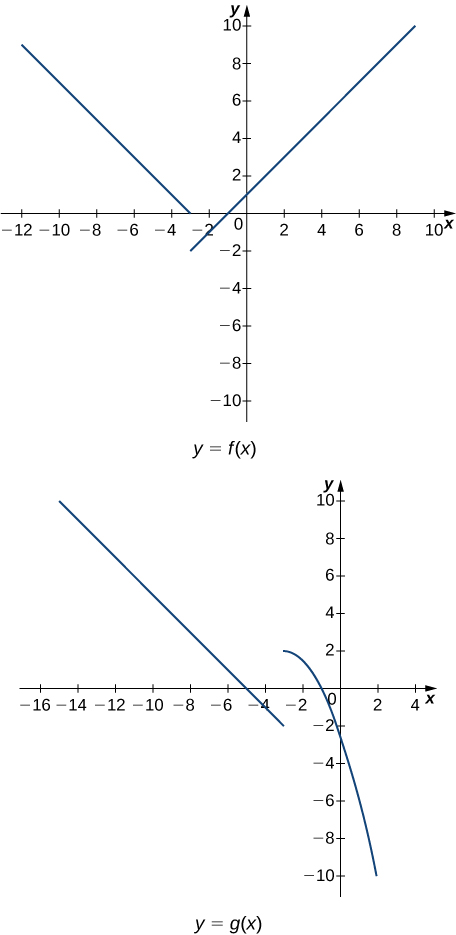
Answer
2-121 §2.3 source ↗
In the following exercises, use the following graphs and the limit laws to evaluate each limit.
Answer
2-123 §2.3 source ↗
In the following exercises, use the following graphs and the limit laws to evaluate each limit.
Answer
2-125 §2.3 source ↗
In the following exercises, use the following graphs and the limit laws to evaluate each limit.
Answer
2-127 §2.3 source ↗
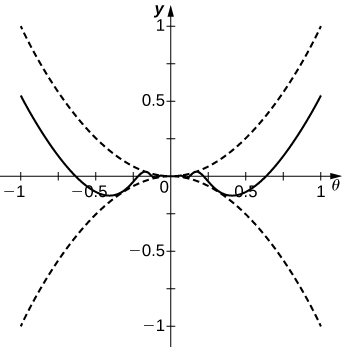
For the following problems, evaluate the limit using the squeeze theorem. Use a calculator to graph the functions and when possible.
[T]
Answer
The limit is zero.
2-129 §2.3 source ↗
For the following problems, evaluate the limit using the squeeze theorem. Use a calculator to graph the functions and when possible.
[T] In physics, the magnitude of an electric field generated by a point charge at a distance r in vacuum is governed by Coulomb’s law: where E represents the magnitude of the electric field, q is the charge of the particle, r is the distance between the particle and where the strength of the field is measured, and is Coulomb’s constant:
a. Use a graphing calculator to graph given that the charge of the particle is
b. Evaluate What is the physical meaning of this quantity? Is it physically relevant? Why are you evaluating from the right?
Answer
a.
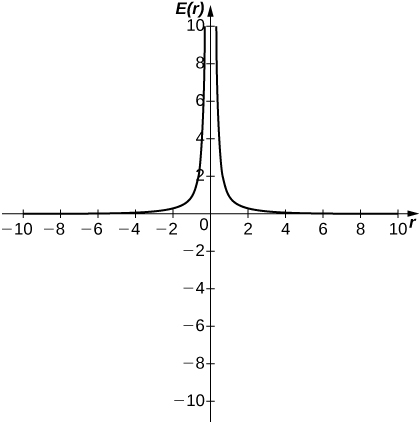
b. ∞. The magnitude of the electric field as you approach the particle q becomes infinite. It does not make physical sense to evaluate negative distance.
Checkpoint 2.21 §2.4 source ↗
Answer
Checkpoint 2.22 §2.4 source ↗
Answer
Checkpoint 2.23 §2.4 source ↗
Answer
Checkpoint 2.24 §2.4 source ↗
Answer
Checkpoint 2.25 §2.4 source ↗
Answer
Checkpoint 2.26 §2.4 source ↗
Answer
2-131 §2.4 source ↗
For the following exercises, determine the point(s), if any, at which each function is discontinuous. Classify any discontinuity as jump, removable, infinite, or other.
Answer
2-133 §2.4 source ↗
For the following exercises, determine the point(s), if any, at which each function is discontinuous. Classify any discontinuity as jump, removable, infinite, or other.
Answer
2-135 §2.4 source ↗
For the following exercises, determine the point(s), if any, at which each function is discontinuous. Classify any discontinuity as jump, removable, infinite, or other.
Answer
2-137 §2.4 source ↗
For the following exercises, determine the point(s), if any, at which each function is discontinuous. Classify any discontinuity as jump, removable, infinite, or other.
Answer
2-139 §2.4 source ↗
For the following exercises, decide if the function continuous at the given point. If it is discontinuous, what type of discontinuity is it?
at
Answer
2-141 §2.4 source ↗
For the following exercises, decide if the function continuous at the given point. If it is discontinuous, what type of discontinuity is it?
at
Answer
2-143 §2.4 source ↗
For the following exercises, decide if the function continuous at the given point. If it is discontinuous, what type of discontinuity is it?
at
Answer
2-145 §2.4 source ↗
In the following exercises, find the value(s) of k that makes each function continuous over the given interval.
Answer
2-147 §2.4 source ↗
In the following exercises, find the value(s) of k that makes each function continuous over the given interval.
Answer
2-149 §2.4 source ↗
In the following exercises, find the value(s) of k that makes each function continuous over the given interval.
Answer
2-151 §2.4 source ↗
In the following exercises, use the Intermediate Value Theorem (IVT).
A particle moving along a line has at each time t a position function which is continuous. Assume and Another particle moves such that its position is given by Explain why there must be a value c for such that
Answer
2-153 §2.4 source ↗
In the following exercises, use the Intermediate Value Theorem (IVT).
Apply the IVT to determine whether has a solution in one of the intervals or Briefly explain your response for each interval.
Answer
2-155 §2.4 source ↗
In the following exercises, use the Intermediate Value Theorem (IVT).
Let
a. Sketch the graph of f.
b. Is it possible to find a value k such that which makes continuous for all real numbers? Briefly explain.
Answer
a.
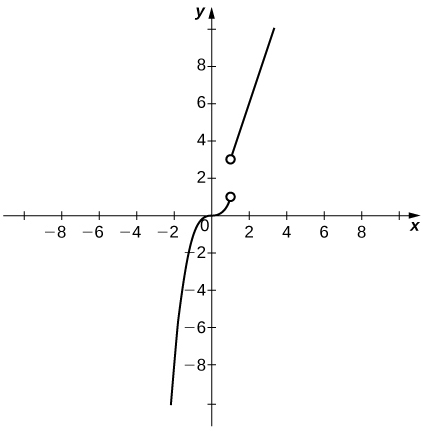
b. It is not possible to redefine since the discontinuity is a jump discontinuity.
2-157 §2.4 source ↗
In the following exercises, use the Intermediate Value Theorem (IVT).
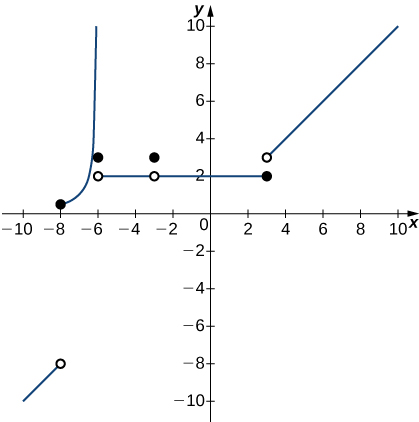
Sketch the graph of a function with properties i. through vi.
i. The domain of f is
ii. f has an infinite discontinuity at
iii.
iv.
v.
vi. f is left continuous but not right continuous at
Answer
Answers may vary; see the following example:
2-159 §2.4 source ↗
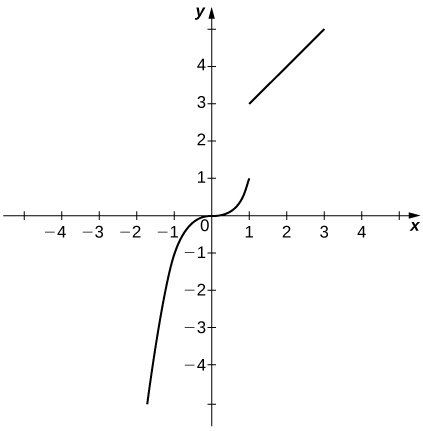
In the following exercises, suppose is defined for all x. For each description, sketch a graph with the indicated property.
Discontinuous at with and
Answer
Answers may vary; see the following example:
2-161 §2.4 source ↗
Determine whether each of the given statements is true. Justify your response with an explanation or counterexample.
is continuous everywhere.
Answer
2-163 §2.4 source ↗
Determine whether each of the given statements is true. Justify your response with an explanation or counterexample.
If a function is not continuous at a point, then it is not defined at that point.
Answer
2-165 §2.4 source ↗
Determine whether each of the given statements is true. Justify your response with an explanation or counterexample.
If is continuous such that and have opposite signs, then has exactly one solution in
Answer
2-167 §2.4 source ↗
Determine whether each of the given statements is true. Justify your response with an explanation or counterexample.
If is continuous everywhere and then there is no root of in the interval
Answer
2-169 §2.4 source ↗
[T] The following problems consider the scalar form of Coulomb’s law, which describes the electrostatic force between two point charges, such as electrons. It is given by the equation where is Coulomb’s constant, are the magnitudes of the charges of the two particles, and r is the distance between the two particles.
Instead of making the force 0 at R, instead we let the force be 10−20 for Assume two protons, which have a magnitude of charge and the Coulomb constant Is there a value R that can make this system continuous? If so, find it.
Answer
2-171 §2.4 source ↗
Recall the discussion on spacecraft from the chapter opener. The following problems consider a rocket launch from Earth’s surface. The force of gravity on the rocket is given by where m is the mass of the rocket, d is the distance of the rocket from the center of Earth, and k is a constant.
[T] After a certain distance D has passed, the gravitational effect of Earth becomes quite negligible, so we can approximate the force function by Using the value of k found in the previous exercise, find the necessary condition D such that the force function remains continuous.
Answer
2-173 §2.4 source ↗
Prove the following functions are continuous everywhere
Answer
2-175 §2.4 source ↗
Prove the following functions are continuous everywhere
Where is continuous?
Answer
Checkpoint 2.27 §2.5 source ↗
Complete the proof that by filling in the blanks.
Let _______.
Choose
Assume
Thus,
Therefore,
Answer
Let choose assume
Thus,
Therefore,
Checkpoint 2.28 §2.5 source ↗
Answer
Checkpoint 2.29 §2.5 source ↗
Complete the proof that
Let choose assume
Since we may conclude that Thus, Hence,
Answer
Checkpoint 2.30 §2.5 source ↗
Answer
2-177 §2.5 source ↗
In the following exercises, write the appropriate - definition for each of the given statements.
Answer
2-179 §2.5 source ↗
In the following exercises, write the appropriate - definition for each of the given statements.
Answer
2-181 §2.5 source ↗
The following graph of the function f satisfies In the following exercises, determine a value of that satisfies each statement.
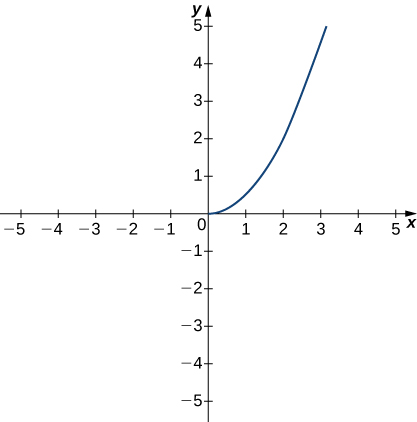
If then
Answer
2-183 §2.5 source ↗
The following graph of the function f satisfies In the following exercises, determine a value of that satisfies each statement.
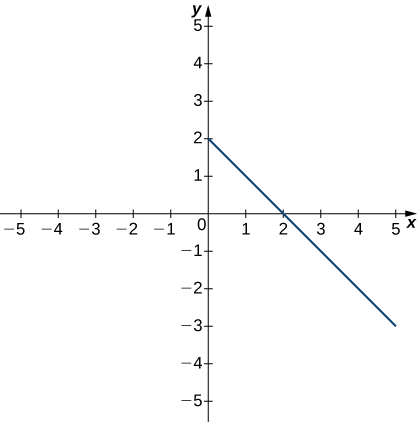
If then
Answer
2-185 §2.5 source ↗
The following graph of the function f satisfies In the following exercises, for each value of ε, find a value of such that the precise definition of limit holds true.
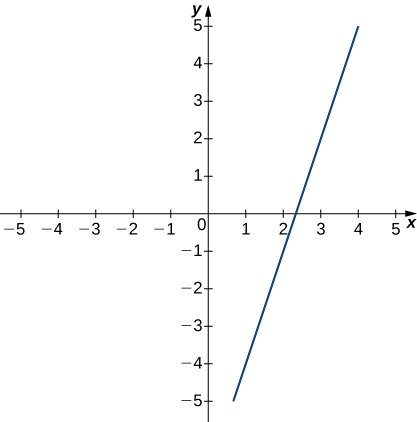
Answer
2-187 §2.5 source ↗
[T] In the following exercises, use a graphing calculator to find a number such that the statements hold true.
Answer
2-189 §2.5 source ↗
In the following exercises, use the precise definition of limit to prove the given limits.
Answer
2-191 §2.5 source ↗
In the following exercises, use the precise definition of limit to prove the given limits.
Answer
2-193 §2.5 source ↗
In the following exercises, use the precise definition of limit to prove the given one-sided limits.
Answer
2-195 §2.5 source ↗
In the following exercises, use the precise definition of limit to prove the given one-sided limits.
Answer
2-197 §2.5 source ↗
In the following exercises, use the precise definition of limit to prove the given infinite limits.
Answer
2-199 §2.5 source ↗
In the following exercises, use the precise definition of limit to prove the given infinite limits.
An engineer is using a machine to cut a flat square of Aerogel of area 144 cm2. If there is a maximum error tolerance in the area of 8 cm2, how accurately must the engineer cut on the side, assuming all sides have the same length? How do these numbers relate to ε, a, and L?
Answer
2-201 §2.5 source ↗
In the following exercises, use the precise definition of limit to prove the given infinite limits.
Using precise definitions of limits, prove that does not exist, given that is the ceiling function. (Hint: Try any
Answer
2-203 §2.5 source ↗
In the following exercises, use the precise definition of limit to prove the given infinite limits.
Using precise definitions of limits, determine for (Hint: Break into two cases, x rational and x irrational.)
Answer
2-205 §2.5 source ↗
For the following exercises, suppose that and both exist. Use the precise definition of limits to prove the following limit laws:
Answer
2-207 §2.5 source ↗
For the following exercises, suppose that and both exist. Use the precise definition of limits to prove the following limit laws:
(Hint:
Answer
2-209 §2.R source ↗
True or False. In the following exercises, justify your answer with a proof or a counterexample.
You can use the quotient rule to evaluate
Answer
2-211 §2.R source ↗
True or False. In the following exercises, justify your answer with a proof or a counterexample.
If does not exist, then f is undefined at the point
Answer
2-213 §2.R source ↗
In the following exercises, evaluate the limit algebraically or explain why the limit does not exist.
Answer
2-215 §2.R source ↗
In the following exercises, evaluate the limit algebraically or explain why the limit does not exist.
Answer
2-217 §2.R source ↗
In the following exercises, evaluate the limit algebraically or explain why the limit does not exist.
Answer
2-219 §2.R source ↗
In the following exercises, evaluate the limit algebraically or explain why the limit does not exist.
Answer
2-221 §2.R source ↗
In the following exercises, evaluate the limit algebraically or explain why the limit does not exist.
Answer
2-223 §2.R source ↗
In the following exercises, use the squeeze theorem to prove the limit.
Answer
2-225 §2.R source ↗
In the following exercises, use the squeeze theorem to prove the limit.
Determine the domain such that the function is continuous over its domain.
Answer
2-227 §2.R source ↗
In the following exercises, determine the value of c such that the function remains continuous. Draw your resulting function to ensure it is continuous.
Answer
2-229 §2.R source ↗
In the following exercises, use the precise definition of limit to prove the limit.
Answer
2-231 §2.R source ↗
In the following exercises, use the precise definition of limit to prove the limit.
A particle moving along a line has a displacement according to the function where x is measured in meters and t is measured in seconds. Find the average velocity over the time period
Answer
Loading chapter 3…
Problems and answers are adapted from Calculus Volume 1 by Gilbert Strang and Edwin “Jed” Herman, OpenStax, and are used under the CC BY-NC-SA 4.0 licence. Access for free at https://openstax.org/books/calculus-volume-1/pages/1-introduction. Illustrations: Copyright Rice University, OpenStax, under CC BY-NC-SA 4.0 license. This adaptation is released under the same licence, is non-commercial, and is neither affiliated with nor endorsed by OpenStax or Rice University.