Every problem in the chapter beside the book’s answer, a chapter at a time as you scroll.

Chapter 4: Graphs

519 problems · 265 figures

Be Prepared 4.1 §4.1 source ↗

Evaluate x+3 when x=−1.
If you missed this problem, review Example 1.54.
Example 1.54 in the book ↗

Answer

2

Be Prepared 4.2 §4.1 source ↗

Evaluate 2x−5y when x=3 and y=−2.
If you missed this problem, review Example 1.55.
Example 1.55 in the book ↗

Answer

16

Be Prepared 4.3 §4.1 source ↗

Solve for y: 40−4y=20.
If you missed this problem, review Example 2.27.
Example 2.27 in the book ↗

Answer

5

Try It 4.1 §4.1 source ↗

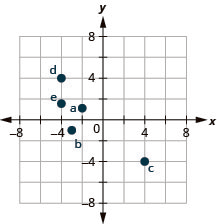
Plot each point in a rectangular coordinate system and identify the quadrant in which the point is located:

ⓐ (−2,1) ⓑ (−3,−1) ⓒ (4,−4) ⓓ (−4,4) ⓔ (−4,32).

Answer

The graph shows the x y-coordinate plane. The x- and y-axes each run from negative 6 to 6. The point (negative 2, 1) is plotted and labeled a. The point (negative 3, negative 1) is plotted and labeled b. The point (4, negative 4) is plotted and labeled c. The point (negative 4, negative one half) is plotted and labeled “d”.

Try It 4.2 §4.1 source ↗

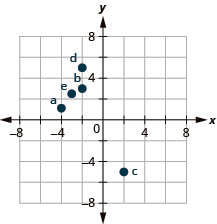
Plot each point in a rectangular coordinate system and identify the quadrant in which the point is located:

ⓐ (−4,1) ⓑ (−2,3) ⓒ (2,−5) ⓓ (−2,5) ⓔ (−3,52).

Answer

The graph shows the x y-coordinate plane. The x- and y-axes each run from negative 6 to 6. The point (negative 4, 1) is plotted and labeled a. The point (negative 2, 3) is plotted and labeled b. The point (2, negative 5) is plotted and labeled c. The point (negative 3, 2 and one half) is plotted and labeled “d”.

Try It 4.3 §4.1 source ↗

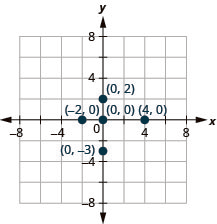
Plot each point:

ⓐ (4,0) ⓑ (−2,0) ⓒ (0,0) ⓓ (0,2) ⓔ (0,−3).

Answer

The graph shows the x y-coordinate plane. The x- and y-axes each run from negative 6 to 6. The points (4, 0), (negative 2, 0), (0, 0), (0, 2), and (0, negative 3) are plotted and labeled.

Try It 4.4 §4.1 source ↗

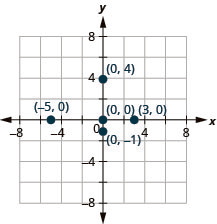
Plot each point:

ⓐ (−5,0) ⓑ (3,0) ⓒ (0,0) ⓓ (0,−1) ⓔ (0,4).

Answer

The graph shows the x y-coordinate plane. The x- and y-axes each run from negative 6 to 6. The points (negative 5, 0), (3, 0), (0, 0), (0, negative 1), and (0, 4) are plotted and labeled.

Try It 4.5 §4.1 source ↗

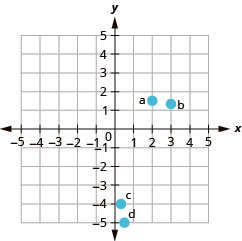
Name the ordered pair of each point shown in the rectangular coordinate system.
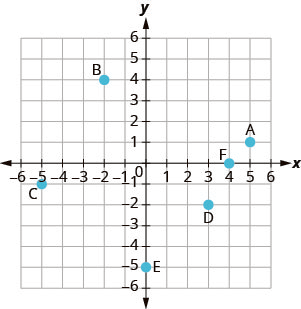
The graph shows the x y-coordinate plane. The x- and y-axes each run from negative 6 to 6. The points (4, 0), (negative 2, 0), (0, 0), (0, 2), and (0, negative 3) are plotted and labeled A, B, C, D, and E, respectively.

Answer

A: (5,1) B: (−2,4) C: (−5,−1) D: (3,−2) E: (0,−5) F: (4,0)

Try It 4.6 §4.1 source ↗

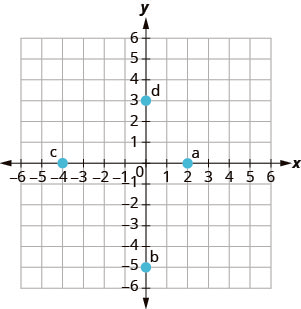
Name the ordered pair of each point shown in the rectangular coordinate system.
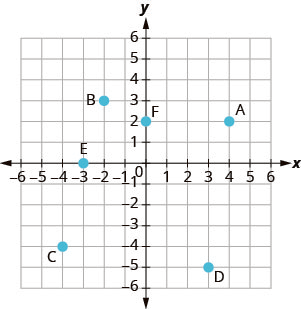
The graph shows the x y-coordinate plane. The x- and y-axes each run from negative 6 to 6. The points (negative 5, 0), (3, 0), (0, 0), (0, negative 1), and (0, 4) are plotted and labeled A, B, C, D, and E, respectively.

Answer

A: (4,2) B: (−2,3) C: (−4,−4) D: (3,−5) E: (−3,0) F: (0,2)

Try It 4.7 §4.1 source ↗

Which of the following ordered pairs are solutions to 2x+3y=6?

ⓐ (3,0) ⓑ (2,0) ⓒ (6,−2)

Answer

a, c

Try It 4.8 §4.1 source ↗

Which of the following ordered pairs are solutions to the equation 4x−y=8?

ⓐ (0,8) ⓑ (2,0) ⓒ (1,−4)

Answer

b, c

Try It 4.9 §4.1 source ↗

Which of the following ordered pairs are solutions to the equation y=4x−3?

ⓐ (0,3) ⓑ (1,1) ⓒ (−1,−1)

Answer

b

Try It 4.10 §4.1 source ↗

Which of the following ordered pairs are solutions to the equation y=−2x+6?

ⓐ (0,6) ⓑ (1,4) ⓒ (−2,−2)

Answer

a, b

Try It 4.11 §4.1 source ↗

Complete the table to find three solutions to this equation: y=3x−1.

y=3x−1
x y (x,y)
0
−1
2

Answer

y=3x−1
x y (x,y)
0 −1 (0,−1)
−1 −4 (−1,−4)
2 5 (2,5)

Try It 4.12 §4.1 source ↗

Complete the table to find three solutions to this equation: y=6x+1.

y=6x+1
x y (x,y)
0
1
−2

Answer

y=6x+1
x y (x,y)
0 1 (0,1)
1 7 (1,7)
−2 −11 (−2,−11)

Try It 4.13 §4.1 source ↗

Complete the table to find three solutions to this equation: 2x−5y=20.

2x−5y=20
x y (x,y)
0
0
−5

Answer

2x−5y=20
x y (x,y)
0 −4 (0,−4)
10 0 (10,0)
−5 −6 (−5,−6)

Try It 4.14 §4.1 source ↗

Complete the table to find three solutions to this equation: 3x−4y=12.

3x−4y=12
x y (x,y)
0
0
−4

Answer

3x−4y=12
x y (x,y)
0 −3 (0,−3)
4 0 (4,0)
−4 −6 (−4,−6)

Try It 4.15 §4.1 source ↗

Find three solutions to this equation: y=−2x+3.

Answer

Answers will vary.

Try It 4.16 §4.1 source ↗

Find three solutions to this equation: y=−4x+1.

Answer

Answers will vary.

Try It 4.17 §4.1 source ↗

Find three solutions to the equation 2x+3y=6.

Answer

Answers will vary.

Try It 4.18 §4.1 source ↗

Find three solutions to the equation 4x+2y=8.

Answer

Answers will vary.

4.1-1 §4.1 source ↗

Plot Points in a Rectangular Coordinate System

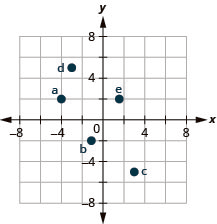
In the following exercises, plot each point in a rectangular coordinate system and identify the quadrant in which the point is located.

ⓐ (−4,2)

ⓑ (−1,−2)

ⓒ (3,−5)

ⓓ (−3,5)
ⓔ (53,2)

Answer

The graph shows the x y-coordinate plane. The x- and y-axes each run from negative 6 to 6. The point (negative 4, 2) is plotted and labeled a. The point (negative 1, negative 2) is plotted and labeled b. The point (3, negative 5) is plotted and labeled c. The point (negative 3, 5) is plotted and labeled “d”. The point (5 thirds, 2) is plotted and labeled “e”.

4.1-3 §4.1 source ↗

Plot Points in a Rectangular Coordinate System

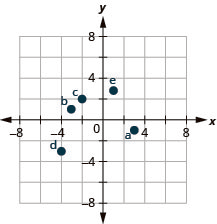
In the following exercises, plot each point in a rectangular coordinate system and identify the quadrant in which the point is located.

ⓐ (3,−1)

ⓑ (−3,1)

ⓒ (−2,2)

ⓓ (−4,−3)

ⓔ (1,145)

Answer

The graph shows the x y-coordinate plane. The x- and y-axes each run from negative 6 to 6. The point (3, negative 1) is plotted and labeled a. The point (negative 3, 1) is plotted and labeled b. The point (negative 2, 2) is plotted and labeled c. The point (negative 4, negative 3) is plotted and labeled “d”. The point (1, 14 fifths) is plotted and labeled “e”.

4.1-5 §4.1 source ↗

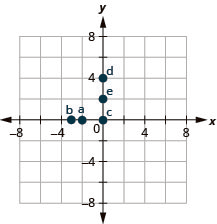
In the following exercises, plot each point in a rectangular coordinate system.

ⓐ (−2,0)

ⓑ (−3,0)

ⓒ (0,0)

ⓓ (0,4)

ⓔ (0,2)

Answer

The graph shows the x y-coordinate plane. The x- and y-axes each run from negative 6 to 6. The point (negative 2, 0) is plotted and labeled a. The point (negative 3, 0) is plotted and labeled b. The point (0, 0) is plotted and labeled c. The point (0, 4) is plotted and labeled “d”. The point (0, 3) is plotted and labeled “e”.

4.1-7 §4.1 source ↗

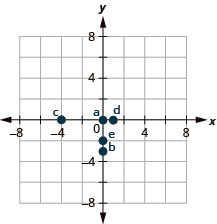
In the following exercises, plot each point in a rectangular coordinate system.

ⓐ (0,0)

ⓑ (0,−3)

ⓒ (−4,0)

ⓓ (1,0)

ⓔ (0,−2)

Answer

The graph shows the x y-coordinate plane. The x- and y-axes each run from negative 6 to 6. The point (0, 0) is plotted and labeled a. The point (0, negative 3) is plotted and labeled b. The point (negative 4, 0) is plotted and labeled c. The point (1, 0) is plotted and labeled “d”. The point (0, negative 2) is plotted and labeled “e”.

4.1-9 §4.1 source ↗

In the following exercises, name the ordered pair of each point shown in the rectangular coordinate system.
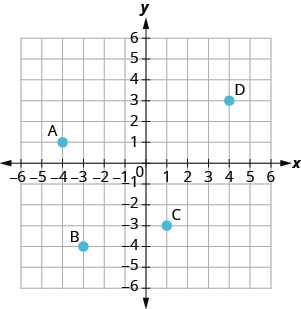
The graph shows the x y-coordinate plane. The x- and y-axes each run from negative 6 to 6. The point (negative 4, 1) is plotted and labeled “A”. The point (negative 3, negative 4) is plotted and labeled “B”. The point (1, negative 3) is plotted and labeled “C”. The point (4, 3) is plotted and labeled “D”.

Answer

A: (−4,1) B: (−3,−4) C: (1,−3) D: (4,3)

4.1-11 §4.1 source ↗

In the following exercises, name the ordered pair of each point shown in the rectangular coordinate system.
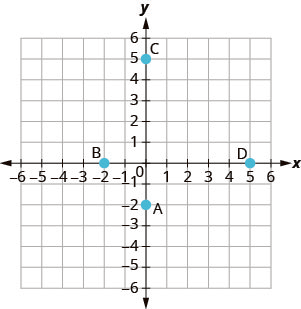
The graph shows the x y-coordinate plane. The x- and y-axes each run from negative 6 to 6. The point (0, negative 2) is plotted and labeled “A”. The point (negative 2, 0) is plotted and labeled “B”. The point (0, 5) is plotted and labeled “C”. The point (5, 0) is plotted and labeled “D”.

Answer

A: (0,−2) B: (−2,0) C: (0,5) D: (5,0)

4.1-13 §4.1 source ↗

Verify Solutions to an Equation in Two Variables

In the following exercises, which ordered pairs are solutions to the given equations?

2 x + y = 6

ⓐ (1,4)

ⓑ (3,0)

ⓒ (2,3)

Answer

a, b

4.1-15 §4.1 source ↗

Verify Solutions to an Equation in Two Variables

In the following exercises, which ordered pairs are solutions to the given equations?

4 x − 2 y = 8

ⓐ (3,2)

ⓑ (1,4)

ⓒ (0,−4)

Answer

a, c

4.1-17 §4.1 source ↗

Verify Solutions to an Equation in Two Variables

In the following exercises, which ordered pairs are solutions to the given equations?

y = 4 x + 3

ⓐ (4,3)

ⓑ (−1,−1)

ⓒ (12,5)

Answer

b, c

4.1-19 §4.1 source ↗

Verify Solutions to an Equation in Two Variables

In the following exercises, which ordered pairs are solutions to the given equations?

y = 1 2 x − 1

ⓐ (2,0)

ⓑ (−6,−4)

ⓒ (−4,−1)

Answer

a, b

4.1-21 §4.1 source ↗

Complete a Table of Solutions to a Linear Equation

In the following exercises, complete the table to find solutions to each linear equation.

y = 2 x − 4

x y (x,y)
0
2
−1

Answer

x y (x,y)
0 −4 (0,−4)
2 0 (2,0)
−1 −6 (−1,−6)

4.1-23 §4.1 source ↗

Complete a Table of Solutions to a Linear Equation

In the following exercises, complete the table to find solutions to each linear equation.

y = − x + 5

x y (x,y)
0
3
−2

Answer

x y (x,y)
0 5 (0,5)
3 2 (3,2)
−2 7 (−2,7)

4.1-25 §4.1 source ↗

Complete a Table of Solutions to a Linear Equation

In the following exercises, complete the table to find solutions to each linear equation.

y = 1 3 x + 1

x y (x,y)
0
3
6

Answer

x y (x,y)
0 1 (0,1)
3 2 (3,2)
6 3 (6,3)

4.1-27 §4.1 source ↗

Complete a Table of Solutions to a Linear Equation

In the following exercises, complete the table to find solutions to each linear equation.

y = − 3 2 x − 2

x y (x,y)
0
2
−2

Answer

x y (x,y)
0 −2 (0,−2)
2 −5 (2,−5)
−2 1 (−2,1)

4.1-29 §4.1 source ↗

Complete a Table of Solutions to a Linear Equation

In the following exercises, complete the table to find solutions to each linear equation.

x + 3 y = 6

x y (x,y)
0
3
0

Answer

x y (x,y)
0 2 (0,2)
3 4 (3,1)
6 0 (6,0)

4.1-31 §4.1 source ↗

Complete a Table of Solutions to a Linear Equation

In the following exercises, complete the table to find solutions to each linear equation.

2 x − 5 y = 10

x y (x,y)
0
10
0

Answer

x y (x,y)
0 −2 (0,−2)
10 2 (10,2)
5 0 (5,0)

4.1-33 §4.1 source ↗

Find Solutions to a Linear Equation

In the following exercises, find three solutions to each linear equation.

y = 5 x − 8

Answer

Answers will vary.

4.1-35 §4.1 source ↗

Find Solutions to a Linear Equation

In the following exercises, find three solutions to each linear equation.

y = −4 x + 5

Answer

Answers will vary.

4.1-37 §4.1 source ↗

Find Solutions to a Linear Equation

In the following exercises, find three solutions to each linear equation.

x + y = 8

Answer

Answers will vary.

4.1-39 §4.1 source ↗

Find Solutions to a Linear Equation

In the following exercises, find three solutions to each linear equation.

x + y = −2

Answer

Answers will vary.

4.1-41 §4.1 source ↗

Find Solutions to a Linear Equation

In the following exercises, find three solutions to each linear equation.

3 x + y = 5

Answer

Answers will vary.

4.1-43 §4.1 source ↗

Find Solutions to a Linear Equation

In the following exercises, find three solutions to each linear equation.

4 x − y = 8

Answer

Answers will vary.

4.1-45 §4.1 source ↗

Find Solutions to a Linear Equation

In the following exercises, find three solutions to each linear equation.

2 x + 4 y = 8

Answer

Answers will vary.

4.1-47 §4.1 source ↗

Find Solutions to a Linear Equation

In the following exercises, find three solutions to each linear equation.

5 x − 2 y = 10

Answer

Answers will vary.

4.1-49 §4.1 source ↗

Find Solutions to a Linear Equation

In the following exercises, find three solutions to each linear equation.

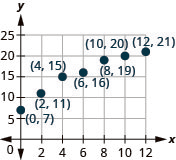
Weight of a baby. Mackenzie recorded her baby’s weight every two months. The baby’s age, in months, and weight, in pounds, are listed in the table below, and shown as an ordered pair in the third column.

ⓐ Plot the points on a coordinate plane.
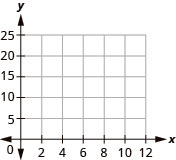
A blank Cartesian coordinate plane featuring a grid. The x-axis is labeled from 0 to 12, and the y-axis is labeled from 0 to 25, ready for data plotting.

ⓑ Why is only Quadrant I needed?

Age x Weight y (x,y)
0 7 (0, 7)
2 11 (2, 11)
4 15 (4, 15)
6 16 (6, 16)
8 19 (8, 19)
10 20 (10, 20)
12 21 (12, 21)

Answer

ⓐ

The graph shows the x y-coordinate plane. The x- and y-axes each run from 0 to 25. The points (0, 7), (2, 11), (4, 15), (6, 16), (8, 19), (10, 20) and (12, 21) are plotted and labeled.


ⓑ Age and weight are only positive.

4.1-51 §4.1 source ↗

Find Solutions to a Linear Equation

In the following exercises, find three solutions to each linear equation.

Explain in words how you plot the point (4,−2) in a rectangular coordinate system.

Answer

Answers will vary.

4.1-53 §4.1 source ↗

Find Solutions to a Linear Equation

In the following exercises, find three solutions to each linear equation.

Is the point (−3,0) on the x-axis or y-axis? How do you know?

Answer

Answers will vary.

Be Prepared 4.4 §4.2 source ↗

Evaluate 3x+2 when x=−1.
If you missed this problem, review Example 1.57.
Example 1.57 in the book ↗

Answer

−1

Be Prepared 4.5 §4.2 source ↗

Solve 3x+2y=12 for y in general.
If you missed this problem, review Example 2.63.
Example 2.63 in the book ↗

Answer

y = 12 − 3 x 2

Try It 4.19 §4.2 source ↗

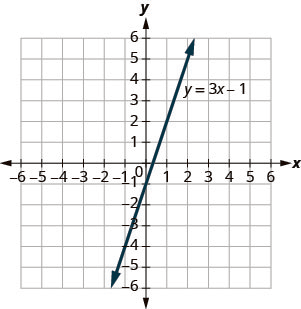
Use the graph of y=3x−1 to decide whether each ordered pair is:

• a solution to the equation.

• on the line.

ⓐ (0,−1) ⓑ (2,5)

The figure shows a straight line on the x y-coordinate plane. The x-axis of the plane runs from negative 7 to 7. The y-axis of the plane runs from negative 7 to 7. The straight line goes through the point (negative 2, negative 7) and for every 3 units it goes up, it goes one unit to the right. The line is labeled with the equation y equals 3x minus 1.

Answer

ⓐ yes, yes ⓑ yes, yes

Try It 4.20 §4.2 source ↗

Use graph of y=3x−1 to decide whether each ordered pair is:

• a solution to the equation

• on the line

ⓐ (3,−1) ⓑ (−1,−4)

The figure shows a straight line on the x y-coordinate plane. The x-axis of the plane runs from negative 7 to 7. The y-axis of the plane runs from negative 7 to 7. The straight line goes through the point (negative 2, negative 7) and for every 3 units it goes up, it goes one unit to the right. The line is labeled with the equation y equals 3x minus 1.

Answer

ⓐ no, no ⓑ yes, yes

Try It 4.21 §4.2 source ↗

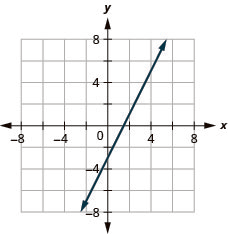
Graph the equation by plotting points: y=2x−3.

Answer

The figure shows a straight line on the x y-coordinate plane. The x-axis of the plane runs from negative 7 to 7. The y-axis of the plane runs from negative 7 to 7. The straight line goes through the points (negative 2, negative 7), (negative 1, negative 5), (0, negative 3), (1, negative 1), (2, 1), (3, 3), (4, 5), and (5, 7). There are arrows at the ends of the line pointing to the outside of the figure.

Try It 4.22 §4.2 source ↗

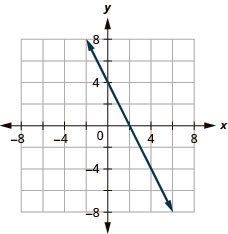
Graph the equation by plotting points: y=−2x+4.

Answer

The figure shows a straight line on the x y-coordinate plane. The x-axis of the plane runs from negative 7 to 7. The y-axis of the plane runs from negative 7 to 7. The straight line goes through the points (negative 1, 6), (0, 4), (1, 2), (2, 0), (3, negative 2), (4, negative 4), and (5, negative 6). There are arrows at the ends of the line pointing to the outside of the figure.

Try It 4.23 §4.2 source ↗

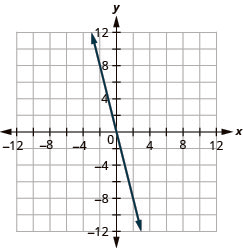
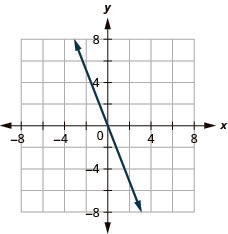
Graph the equation by plotting points: y=−4x.

Answer

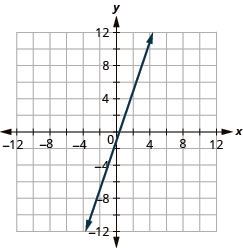
The figure shows a straight line drawn on the x y-coordinate plane. The x-axis of the plane runs from negative 12 to 12. The y-axis of the plane runs from negative 12 to 12. The straight line goes through the points (negative 2, 8), (0, 0), and (2, negative 8). The line has arrows on both ends pointing to the outside of the figure.

Try It 4.24 §4.2 source ↗

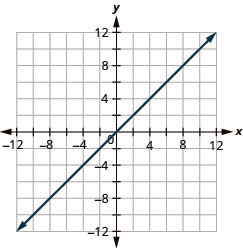
Graph the equation by plotting points: y=x.

Answer

The figure shows a straight line drawn on the x y-coordinate plane. The x-axis of the plane runs from negative 12 to 12. The y-axis of the plane runs from negative 12 to 12. The straight line goes through the points (negative 8, negative 8), (negative 6, negative 6), (negative 4, negative 4), (negative 2, negative 2), (0, 0), (2, 2), (4, 4), (6, 6), and (8, 8). The line has arrows on both ends pointing to the outside of the figure.

Try It 4.25 §4.2 source ↗

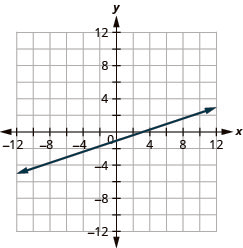
Graph the equation y=13x−1.

Answer

The figure shows a straight line drawn on the x y-coordinate plane. The x-axis of the plane runs from negative 12 to 12. The y-axis of the plane runs from negative 12 to 12. The straight line goes through the points (negative 9, negative 4), (negative 6, negative 3), (negative 3, negative 2), (0, negative 1), (3, 0), (6, 1), and (9, 2). The line has arrows on both ends pointing to the outside of the figure.

Try It 4.26 §4.2 source ↗

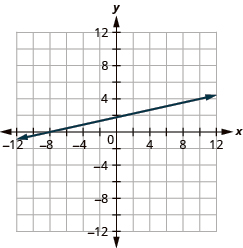
Graph the equation y=14x+2.

Answer

The figure shows a straight line drawn on the x y-coordinate plane. The x-axis of the plane runs from negative 12 to 12. The y-axis of the plane runs from negative 12 to 12. The straight line goes through the points (negative 12, negative 1), (negative 8, 0), (negative 4, 1), (0, 2), (4, 3), (8, 4), and (12, 5). The line has arrows on both ends pointing to the outside of the figure.

Try It 4.27 §4.2 source ↗

Graph the equation 2x+y=2.

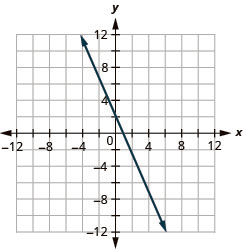
Answer

The figure shows a straight line drawn on the x y-coordinate plane. The x-axis of the plane runs from negative 12 to 12. The y-axis of the plane runs from negative 12 to 12. The straight line goes through the points (negative 4, 10), (negative 2, 6), (0, 2), (2, negative 2), (4, negative 6), and (6, negative 10). The line has arrows on both ends pointing to the outside of the figure.

Try It 4.28 §4.2 source ↗

Graph the equation 4x+y=−3.

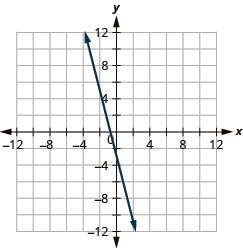
Answer

The figure shows a straight line drawn on the x y-coordinate plane. The x-axis of the plane runs from negative 12 to 12. The y-axis of the plane runs from negative 12 to 12. The straight line goes through the points (negative 3, 9), (negative 2, 5), (negative 1, 1), (0, negative 3), (1, negative 7), and (2, negative 10). The line has arrows on both ends pointing to the outside of the figure.

Try It 4.29 §4.2 source ↗

Graph the equation 4x+2y=8.

Answer

The figure shows a straight line drawn on the x y-coordinate plane. The x-axis of the plane runs from negative 7 to 7. The y-axis of the plane runs from negative 7 to 7. The straight line goes through the points (negative 1, 6), (0, 4), (1, 2), (2, 0), (3, negative 2), and (4, negative 4). The line has arrows on both ends pointing to the outside of the figure.

Try It 4.30 §4.2 source ↗

Graph the equation 2x−4y=8.

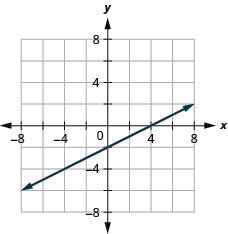
Answer

The figure shows a straight line drawn on the x y-coordinate plane. The x-axis of the plane runs from negative 7 to 7. The y-axis of the plane runs from negative 7 to 7. The straight line goes through the points (negative 6, negative 5), (negative 4, negative 4), (negative 2, negative 3), (0, negative 2), (2, negative 1), (4, 0), and (6, 1). The line has arrows on both ends pointing to the outside of the figure.

Try It 4.31 §4.2 source ↗

Graph the equation x=5.

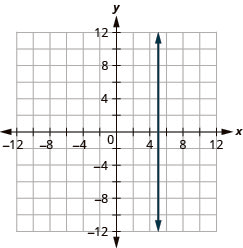
Answer

The figure shows a straight vertical line drawn on the x y-coordinate plane. The x-axis of the plane runs from negative 12 to 12. The y-axis of the plane runs from negative 12 to 12. The straight line goes through the points (5, 1), (5, 2), (5, 3), and all other points with first coordinate 5. The line has arrows on both ends pointing to the outside of the figure.

Try It 4.32 §4.2 source ↗

Graph the equation x=−2.

Answer

The figure shows a straight vertical line drawn on the x y-coordinate plane. The x-axis of the plane runs from negative 12 to 12. The y-axis of the plane runs from negative 12 to 12. The straight line goes through the points (negative 2, 1), (negative 2, 2), (negative 2, 3), and all other points with first coordinate negative 2. The line has arrows on both ends pointing to the outside of the figure.

Try It 4.33 §4.2 source ↗

Graph the equation y=−4.

Answer

The figure shows a straight horizontal line drawn on the x y-coordinate plane. The x-axis of the plane runs from negative 12 to 12. The y-axis of the plane runs from negative 12 to 12. The straight line goes through the points (negative 4, negative 4), (0, negative 4), (4, negative 4), and all other points with second coordinate negative 4. The line has arrows on both ends pointing to the outside of the figure.

Try It 4.34 §4.2 source ↗

Graph the equation y=3.

Answer

The figure shows a straight horizontal line drawn on the x y-coordinate plane. The x-axis of the plane runs from negative 12 to 12. The y-axis of the plane runs from negative 12 to 12. The straight line goes through the points (negative 4, 3), (0, 3), (4, 3), and all other points with second coordinate 3. The line has arrows on both ends pointing to the outside of the figure.

Try It 4.35 §4.2 source ↗

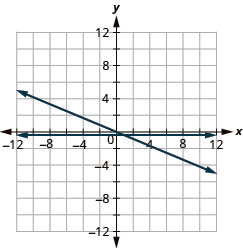
Graph y=−4x and y=−4 in the same rectangular coordinate system.

Answer

The figure shows a two straight lines drawn on the same x y-coordinate plane. The x-axis of the plane runs from negative 12 to 12. The y-axis of the plane runs from negative 12 to 12. One line is a straight horizontal line going through the points (negative 4, negative 4), (0, negative 4), (4, negative 4), and all other points with second coordinate negative 4. The other line is a slanted line going through the points (negative 2, 8), (negative 1, 4), (0, 0), (1, negative 4), and (2, negative 8).

Try It 4.36 §4.2 source ↗

Graph y=3 and y=3x in the same rectangular coordinate system.

Answer

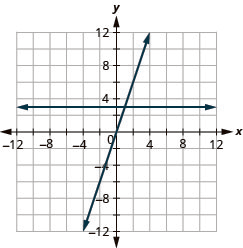
The figure shows a two straight lines drawn on the same x y-coordinate plane. The x-axis of the plane runs from negative 12 to 12. The y-axis of the plane runs from negative 12 to 12. One line is a straight horizontal line going through the points (negative 4, 3) (0, 3), (4, 3), and all other points with second coordinate 3. The other line is a slanted line going through the points (negative 2, negative 6), (negative 1, negative 3), (0, 0), (1, 3), and (2, 6).

4.2-55 §4.2 source ↗

Recognize the Relationship Between the Solutions of an Equation and its Graph

In the following exercises, for each ordered pair, decide:

ⓐ Is the ordered pair a solution to the equation? ⓑ Is the point on the line?

y = x + 2

ⓐ (0,2)

ⓑ (1,2)

ⓒ (−1,1)

ⓓ (−3,−1)

The figure shows a straight line drawn on the x y-coordinate plane. The x-axis of the plane runs from negative 7 to 7. The y-axis of the plane runs from negative 7 to 7. The straight line goes through the points (negative 6, negative 4), (negative 5, negative 3), (negative 4, negative 2), (negative 3, negative 1), (negative 2, 0), (negative 1, 1), (0, 2), (1, 3), (2, 4), (3, 5), (4, 6), and (5, 7).

Answer

ⓐ yes; yes ⓑ no; no ⓒ yes; yes ⓓ yes; yes

4.2-57 §4.2 source ↗

Recognize the Relationship Between the Solutions of an Equation and its Graph

In the following exercises, for each ordered pair, decide:

ⓐ Is the ordered pair a solution to the equation? ⓑ Is the point on the line?

y = 1 2 x − 3

ⓐ (0,−3)

ⓑ (2,−2)

ⓒ (−2,−4)

ⓓ (4,1)

The figure shows a straight line drawn on the x y-coordinate plane. The x-axis of the plane runs from negative 7 to 7. The y-axis of the plane runs from negative 7 to 7. The straight line goes through the points (negative 6, negative 6), (negative 4, negative 5), (negative 2, negative 4), (0, negative 3), (2, negative 2), (4, negative 1), and (6, 0).

Answer

ⓐ yes; yes ⓑ yes; yes ⓒ yes; yes ⓓ no; no

4.2-59 §4.2 source ↗

Graph a Linear Equation by Plotting Points

In the following exercises, graph by plotting points.

y = 3 x − 1

Answer

The figure shows a straight line drawn on the x y-coordinate plane. The x-axis of the plane runs from negative 12 to 12. The y-axis of the plane runs from negative 12 to 12. The straight line goes through the points (negative 3, negative 10), (negative 2, negative 7), (negative 1, negative 4), (0, negative 1), (1, 2), (2, 5), and (3, 8).

4.2-61 §4.2 source ↗

Graph a Linear Equation by Plotting Points

In the following exercises, graph by plotting points.

y = −2 x + 2

Answer

The figure shows a straight line drawn on the x y-coordinate plane. The x-axis of the plane runs from negative 12 to 12. The y-axis of the plane runs from negative 12 to 12. The straight line goes through the points (negative 4, 10), (negative 3, 8), (negative 2, 6), (negative 1, 4), (0, 2), (1, 0), (2, negative 2), (3, negative 4), (4, negative 6), and (5, negative 8).

4.2-63 §4.2 source ↗

Graph a Linear Equation by Plotting Points

In the following exercises, graph by plotting points.

y = x + 2

Answer

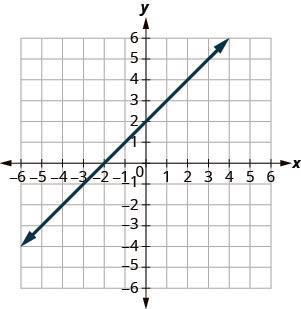
The figure shows a straight line drawn on the x y-coordinate plane. The x-axis of the plane runs from negative 12 to 12. The y-axis of the plane runs from negative 12 to 12. The straight line goes through the points (negative 10, negative 8), (negative 9, negative 7), (negative 8, negative 6), (negative 7, negative 5), (negative 6, negative 4), (negative 5, negative 3), (negative 4, negative 2), (negative 3, negative 1), (negative 2, 0), (negative 1, 1), (0, 2), (1, 3), (2, 4), (3, 5), (4, 6), (5, 7), (6, 8), (7, 9), and (8, 10).

4.2-65 §4.2 source ↗

Graph a Linear Equation by Plotting Points

In the following exercises, graph by plotting points.

y = − x − 3

Answer

The figure shows a straight line drawn on the x y-coordinate plane. The x-axis of the plane runs from negative 12 to 12. The y-axis of the plane runs from negative 12 to 12. The straight line goes through the points (negative 10, 7), (negative 9, 6), (negative 8, 5), (negative 7, 4), (negative 6, 3), (negative 5, 2), (negative 4, 1), (negative 3, 0), (negative 2, negative 1), (negative 1, negative 2), (0, negative 3), (1, negative 4), (2, negative 5), (3, negative 6), (4, negative 7), (5, negative 8), (6, negative 9), and (7, negative 10).

4.2-67 §4.2 source ↗

Graph a Linear Equation by Plotting Points

In the following exercises, graph by plotting points.

y = 2 x

Answer

The figure shows a straight line drawn on the x y-coordinate plane. The x-axis of the plane runs from negative 12 to 12. The y-axis of the plane runs from negative 12 to 12. The straight line goes through the points (negative 5, negative 10), (negative 4, negative 8), (negative 3, negative 6), (negative 2, negative 4), (negative 1, negative 2), (0, 0), (1, 2), (2, 4), (3, 6), (4, 8), and (5, 10).

4.2-69 §4.2 source ↗

Graph a Linear Equation by Plotting Points

In the following exercises, graph by plotting points.

y = −4 x

Answer

The figure shows a straight line drawn on the x y-coordinate plane. The x-axis of the plane runs from negative 12 to 12. The y-axis of the plane runs from negative 12 to 12. The straight line goes through the points (negative 3, 12), (negative 2, 8), (negative 1, 4), (0, 0), (1, negative 4), (2, negative 8), and (3, negative 12).

4.2-71 §4.2 source ↗

Graph a Linear Equation by Plotting Points

In the following exercises, graph by plotting points.

y = 1 2 x + 2

Answer

The figure shows a straight line drawn on the x y-coordinate plane. The x-axis of the plane runs from negative 12 to 12. The y-axis of the plane runs from negative 12 to 12. The straight line goes through the points (negative 12, negative 4), (negative 10, negative 3), (negative 8, negative 2), (negative 6, negative 1), (negative 4, 0), (negative 2, 1), (0, 2), (2, 3), (4, 4), (6, 5), (8, 6), and (10, 7).

4.2-73 §4.2 source ↗

Graph a Linear Equation by Plotting Points

In the following exercises, graph by plotting points.

y = 4 3 x − 5

Answer

The figure shows a straight line drawn on the x y-coordinate plane. The x-axis of the plane runs from negative 12 to 12. The y-axis of the plane runs from negative 12 to 12. The straight line goes through the points (negative 3, negative 9), (0, negative 5), (3, negative 1), (6, 3), and (9, 7).

4.2-75 §4.2 source ↗

Graph a Linear Equation by Plotting Points

In the following exercises, graph by plotting points.

y = − 2 5 x + 1

Answer

The figure shows a straight line drawn on the x y-coordinate plane. The x-axis of the plane runs from negative 12 to 12. The y-axis of the plane runs from negative 12 to 12. The straight line goes through the points (negative 10, 5), (negative 5, 3), (0, 1), (5, negative 1), and (10, negative 3).

4.2-77 §4.2 source ↗

Graph a Linear Equation by Plotting Points

In the following exercises, graph by plotting points.

y = − 3 2 x + 2

Answer

The figure shows a straight line drawn on the x y-coordinate plane. The x-axis of the plane runs from negative 12 to 12. The y-axis of the plane runs from negative 12 to 12. The straight line goes through the points (negative 6, 11), (negative 4, 8), (negative 2, 5), (0, 2), (2, negative 1), (4, negative 4), (6, negative 7), and (8, negative 10).

4.2-79 §4.2 source ↗

Graph a Linear Equation by Plotting Points

In the following exercises, graph by plotting points.

x + y = 6

Answer

The figure shows a straight line drawn on the x y-coordinate plane. The x-axis of the plane runs from negative 12 to 12. The y-axis of the plane runs from negative 12 to 12. The straight line goes through the points (negative 4, 10), (negative 3, 9), (negative 2, 8), (negative 1, 7), (0, 6), (1, 5), (2, 4), (3, 3), (4, 2), (5, 1), (6, 0), (7, negative 1), (8, negative 2), (9, negative 3), and (10, negative 4).

4.2-81 §4.2 source ↗

Graph a Linear Equation by Plotting Points

In the following exercises, graph by plotting points.

x + y = −3

Answer

The figure shows a straight line drawn on the x y-coordinate plane. The x-axis of the plane runs from negative 12 to 12. The y-axis of the plane runs from negative 12 to 12. The straight line goes through the points (negative 10, 7), (negative 9, 6), (negative 8, 5), (negative 7, 4), (negative 6, 3), (negative 5, 2), (negative 4, 1), (negative 3, 0), (negative 2, negative 1), (negative 1, negative 2), (0, negative 3), (1, negative 4), (2, negative 5), (3, negative 6), (4, negative 7), (5, negative 8), (6, negative 9), and (7, negative 10).

4.2-83 §4.2 source ↗

Graph a Linear Equation by Plotting Points

In the following exercises, graph by plotting points.

x − y = 2

Answer

The figure shows a straight line drawn on the x y-coordinate plane. The x-axis of the plane runs from negative 12 to 12. The y-axis of the plane runs from negative 12 to 12. The straight line goes through the points (negative 8, negative 10), (negative 7, negative 9), (negative 6, negative 8), (negative 5, negative 7), (negative 4, negative 6), (negative 3, negative 5), (negative 2, negative 4), (negative 1, negative 3), (0, negative 2), (1, negative 1), (2, 0), (3, 1), (4, 2), (5, 3), (6, 4), (7, 5), (8, 6), (9, 7), and (10, 8).

4.2-85 §4.2 source ↗

Graph a Linear Equation by Plotting Points

In the following exercises, graph by plotting points.

x − y = −1

Answer

The figure shows a straight line drawn on the x y-coordinate plane. The x-axis of the plane runs from negative 12 to 12. The y-axis of the plane runs from negative 12 to 12. The straight line goes through the points (negative 9, negative 8), (negative 8, negative 7), (negative 7, negative 6), (negative 6, negative 5), (negative 5, negative 4), (negative 4, negative 3), (negative 3, negative 2), (negative 2, negative 1), (negative 1, 0), (0, 1), (1, 2), (2, 3), (3, 4), (4, 5), (5, 6), (6, 7), (7, 8), (8, 9), and (9, 10).

4.2-87 §4.2 source ↗

Graph a Linear Equation by Plotting Points

In the following exercises, graph by plotting points.

3 x + y = 7

Answer

The figure shows a straight line drawn on the x y-coordinate plane. The x-axis of the plane runs from negative 7 to -7. The equation 3 x plus y equals 7 is graphed.

4.2-89 §4.2 source ↗

Graph a Linear Equation by Plotting Points

In the following exercises, graph by plotting points.

2 x + y = −3

Answer

The figure shows a straight line drawn on the x y-coordinate plane. The x-axis of the plane runs from negative 7 to 7. The y-axis of the plane runs from negative 7 to 7. The straight line goes through the points (negative 5, 7), (negative 4, 5), (negative 3, 3), (negative 2, 1), (negative 1, negative 1), (0, negative 3), (1, negative 5), and (2, negative 7).

4.2-91 §4.2 source ↗

Graph a Linear Equation by Plotting Points

In the following exercises, graph by plotting points.

1 3 x + y = 2

Answer

The figure shows a straight line drawn on the x y-coordinate plane. The x-axis of the plane runs from negative 7 to 7. The y-axis of the plane runs from negative 7 to 7. The straight line goes through the points (negative 6, 4), (negative 3, 3), (0, 2), (3, 1), and (6, 0).

4.2-93 §4.2 source ↗

Graph a Linear Equation by Plotting Points

In the following exercises, graph by plotting points.

2 5 x − y = 4

Answer

The figure shows a straight line drawn on the x y-coordinate plane. The x-axis of the plane runs from negative 7 to 7. The y-axis of the plane runs from negative 7 to 7. The straight line goes through the points (negative 5, negative 2), (0, negative 4), and (5, negative 6).

4.2-95 §4.2 source ↗

Graph a Linear Equation by Plotting Points

In the following exercises, graph by plotting points.

2 x + 3 y = 12

Answer

The figure shows a straight line drawn on the x y-coordinate plane. The x-axis of the plane runs from negative 7 to 7. The y-axis of the plane runs from negative 7 to 7. The straight line goes through the points (negative 3, 6), (0, 4), (3, 2), and (6, 0).

4.2-97 §4.2 source ↗

Graph a Linear Equation by Plotting Points

In the following exercises, graph by plotting points.

3 x − 4 y = 12

Answer

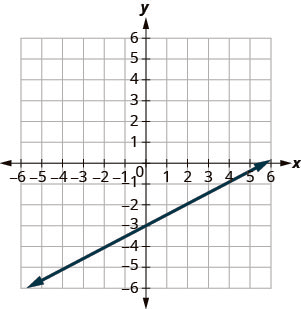
The figure shows a straight line drawn on the x y-coordinate plane. The x-axis of the plane runs from negative 7 to 7. The y-axis of the plane runs from negative 7 to 7. The straight line goes through the points (negative 4, negative 6), (0, negative 3), (4, 0), and (8, 3).

4.2-99 §4.2 source ↗

Graph a Linear Equation by Plotting Points

In the following exercises, graph by plotting points.

x − 6 y = 3

Answer

The figure shows a straight line drawn on the x y-coordinate plane. The x-axis of the plane runs from negative 7 to 7. The y-axis of the plane runs from negative 7 to 7. The straight line goes through the points (negative 6, negative three halves), (negative 3, negative 1), (0, negative one half), (3, 0), and (6, one half).

4.2-101 §4.2 source ↗

Graph a Linear Equation by Plotting Points

In the following exercises, graph by plotting points.

5 x + 2 y = 4

Answer

The figure shows a straight line drawn on the x y-coordinate plane. The x-axis of the plane runs from negative 7 to 7. The y-axis of the plane runs from negative 7 to 7. The straight line goes through the points (negative 2, 7), (0, 2), (2, negative 3), and (4, negative 8).

4.2-103 §4.2 source ↗

Graph Vertical and Horizontal Lines

In the following exercises, graph each equation.

x = 4

Answer

The figure shows a straight vertical line drawn on the x y-coordinate plane. The x-axis of the plane runs from negative 12 to 12. The y-axis of the plane runs from negative 12 to 12. The vertical line goes through the points (4, 0), (4, 1), (4, 2) and all points with first coordinate 4.

4.2-105 §4.2 source ↗

Graph Vertical and Horizontal Lines

In the following exercises, graph each equation.

x = −2

Answer

The figure shows a straight vertical line drawn on the x y-coordinate plane. The x-axis of the plane runs from negative 12 to 12. The y-axis of the plane runs from negative 12 to 12. The vertical line goes through the points (negative 2, 0), (negative 2, 1), (negative 2, 2) and all points with first coordinate negative 2.

4.2-107 §4.2 source ↗

Graph Vertical and Horizontal Lines

In the following exercises, graph each equation.

y = 3

Answer

The figure shows a straight horizontal line drawn on the x y-coordinate plane. The x-axis of the plane runs from negative 12 to 12. The y-axis of the plane runs from negative 12 to 12. The horizontal line goes through the points (0, 3), (1, 3), (2, 3) and all points with second coordinate 3.

4.2-109 §4.2 source ↗

Graph Vertical and Horizontal Lines

In the following exercises, graph each equation.

y = −5

Answer

The figure shows a straight horizontal line drawn on the x y-coordinate plane. The x-axis of the plane runs from negative 12 to 12. The y-axis of the plane runs from negative 12 to 12. The horizontal line goes through the points (0, negative 5), (1, negative 5), (2, negative 5) and all points with second coordinate negative 5.

4.2-111 §4.2 source ↗

Graph Vertical and Horizontal Lines

In the following exercises, graph each equation.

x = 7 3

Answer

The figure shows a straight vertical line drawn on the x y-coordinate plane. The x-axis of the plane runs from negative 12 to 12. The y-axis of the plane runs from negative 12 to 12. The vertical line goes through the points (7/3, 0), (7/3, 1), (7/3, 2) and all points with first coordinate 7/3.

4.2-113 §4.2 source ↗

Graph Vertical and Horizontal Lines

In the following exercises, graph each equation.

y = − 15 4

Answer

The figure shows a straight horizontal line drawn on the x y-coordinate plane. The x-axis of the plane runs from negative 7 to 7. The y-axis of the plane runs from negative 7 to 7. The horizontal line goes through the points (0, negative 15/4), (1, negative 15/4), (2, negative 15/4) and all points with second coordinate negative 15/4.

4.2-115 §4.2 source ↗

In the following exercises, graph each pair of equations in the same rectangular coordinate system.

y=2x and y=2

Answer

The figure shows a two straight lines drawn on the same x y-coordinate plane. The x-axis of the plane runs from negative 12 to 12. The y-axis of the plane runs from negative 12 to 12. One line is a straight horizontal line going through the points (negative 4, 2) (0, 2), (4, 2), and all other points with second coordinate 2. The other line is a slanted line going through the points (negative 5, negative 10), (negative 4, negative 8), (negative 3, negative 6), (negative 2, negative 4), (negative 1, negative 2), (0, 0), (1, 2), (2, 4), (3, 6), (4, 8), and (5, 10).

4.2-117 §4.2 source ↗

In the following exercises, graph each pair of equations in the same rectangular coordinate system.

y=−12x and y=−12

Answer

The figure shows a two straight lines drawn on the same x y-coordinate plane. The x-axis of the plane runs from negative 12 to 12. The y-axis of the plane runs from negative 12 to 12. One line is a straight horizontal line going through the points (negative 4, negative one half) (0, negative one half), (4, negative one half), and all other points with second coordinate negative one half. The other line is a slanted line going through the points (negative 10, 5), (negative 8, 4), (negative 6, 3), (negative 4, 2), (negative 2, 1), (0, 0), (1, negative 2), (2, negative 4), (3, negative 6), (4, negative 8), and (5, negative 10).

4.2-119 §4.2 source ↗

In the following exercises, graph each equation.

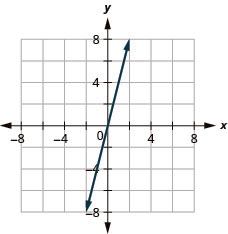
y = 4 x

Answer

The figure shows a straight line drawn on the x y-coordinate plane. The x-axis of the plane runs from negative 7 to 7. The y-axis of the plane runs from negative 7 to 7. The straight line goes through the points (negative 2, negative 8), (negative 1, negative 4), (0, 0), (1, 4), and (2, 8).

4.2-121 §4.2 source ↗

In the following exercises, graph each equation.

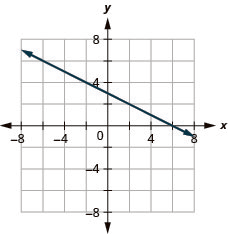
y = − 1 2 x + 3

Answer

The figure shows a straight line drawn on the x y-coordinate plane. The x-axis of the plane runs from negative 7 to 7. The y-axis of the plane runs from negative 7 to 7. The straight line goes through the points (negative 6, 6), (negative 4, 5), (negative 2, 4), (0, 3), (2, 2), (4, 1), and (6, 0).

4.2-123 §4.2 source ↗

In the following exercises, graph each equation.

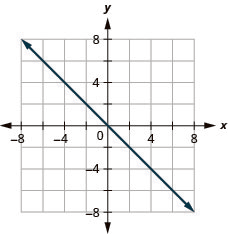
y = − x

Answer

The figure shows a straight line drawn on the x y-coordinate plane. The x-axis of the plane runs from negative 7 to 7. The y-axis of the plane runs from negative 7 to 7. The straight line goes through the points (negative 6, 6), (negative 5, 5), (negative 4, 4), (negative 3, 3), (negative 2, 2), (negative 1, 1), (0, 0), (1, negative 1), (2, negative 2), (3, negative 3), (4, negative 4), (5, negative 5), and (6, negative 6).

4.2-125 §4.2 source ↗

In the following exercises, graph each equation.

x − y = 3

Answer

The figure shows a straight line drawn on the x y-coordinate plane. The x-axis of the plane runs from negative 7 to 7. The y-axis of the plane runs from negative 7 to 7. The straight line goes through the points (negative 3, negative 7), (negative 2, negative 6), (negative 1, negative 4), (0, negative 3), (1, negative 2), (2, negative 1), (3, 0), (4, 1), (5, 2), and (6, 3).

4.2-127 §4.2 source ↗

In the following exercises, graph each equation.

4 x + y = 2

Answer

The figure shows a straight line drawn on the x y-coordinate plane. The x-axis of the plane runs from negative 7 to 7. The y-axis of the plane runs from negative 7 to 7. The straight line goes through the points (negative 2, 6), (negative 1, 4), (0, 2), (1, negative 2), and (2, negative 6).

4.2-129 §4.2 source ↗

In the following exercises, graph each equation.

y = −1

Answer

The figure shows a straight horizontal line drawn on the x y-coordinate plane. The x-axis of the plane runs from negative 7 to 7. The y-axis of the plane runs from negative 7 to 7. The horizontal line goes through the points (0, negative 1), (1, negative 1), (2, negative 1) and all points with second coordinate negative 1.

4.2-131 §4.2 source ↗

In the following exercises, graph each equation.

2 x + 6 y = 12

Answer

The figure shows a straight line drawn on the x y-coordinate plane. The x-axis of the plane runs from negative 7 to 7. The y-axis of the plane runs from negative 7 to 7. The straight line goes through the points (negative 6, 4), (negative 3, 3), (0, 2), (3, 1), and (6, 0).

4.2-133 §4.2 source ↗

In the following exercises, graph each equation.

x = 3

Answer

The figure shows a straight vertical line drawn on the x y-coordinate plane. The x-axis of the plane runs from negative 7 to 7. The y-axis of the plane runs from negative 7 to 7. The vertical line goes through the points (3, 0), (3, 1), (3, 2) and all points with first coordinate 3.

4.2-135 §4.2 source ↗

In the following exercises, graph each equation.

Motor home cost. The Robinsons rented a motor home for one week to go on vacation. It cost them $594 plus $0.32 per mile to rent the motor home, so the linear equation y=594+0.32x gives the cost, y, for driving x miles. Calculate the rental cost for driving 400, 800, and 1200 miles, and then graph the line.

Answer

$722, $850, $978
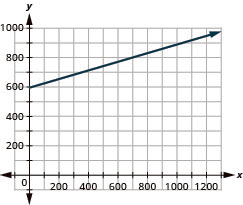
The figure shows a straight line drawn on the x y-coordinate plane. The x-axis of the plane runs from 0 to 1200 in increments of 100. The y-axis of the plane runs from 0 to 1000 in increments of 100. The straight line starts at the point (0, 594) and goes through the points (400, 722), (800, 850), and (1200, 978). The right end of the line has an arrow pointing up and to the right.

4.2-137 §4.2 source ↗

In the following exercises, graph each equation.

Explain how you would choose three x- values to make a table to graph the line y=15x−2.

Answer

Answers will vary.

Be Prepared 4.6 §4.3 source ↗

Solve: 3·0+4y=−2.
If you missed this problem, review Example 2.17.
Example 2.17 in the book ↗

Answer

− 1 2

Try It 4.37 §4.3 source ↗

Find the x- and y- intercepts on the graph.
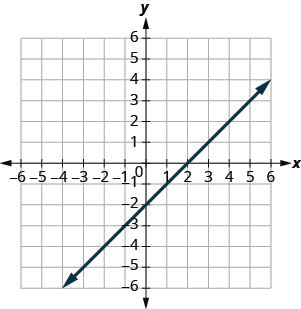
A figure showing a straight line on the x y- coordinate plane. The x- axis of the plane runs from negative 10 to 10. The y- axis of the planes runs from negative 10 to 10. The straight line goes through the points (negative 8, negative 10), (negative 6, negative 8), (negative 4, negative 6), (negative 2, negative 4), (0, negative 2), (2, 0), (4, 2), (6, 4), (8, 6), and (10, 8).

Answer

x- intercept: (2,0); y- intercept: (0,−2)

Try It 4.38 §4.3 source ↗

Find the x- and y- intercepts on the graph.
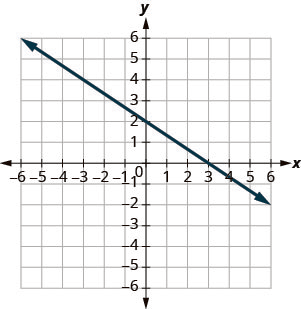
The figure shows a straight line on the x y- coordinate plane. The x- axis of the plane runs from negative 10 to 10. The y- axis of the planes runs from negative 10 to 10. The straight line goes through the points (negative 9, 8), (negative 6, 6), (negative 3, 4), (0, 2), (3, 0), (6, negative 2), and (9, negative 4).

Answer

x- intercept: (3,0), y- intercept: (0,2)

Try It 4.39 §4.3 source ↗

Find the intercepts of 3x+y=12.

Answer

x- intercept: (4,0), y- intercept: (0,12)

Try It 4.40 §4.3 source ↗

Find the intercepts of x+4y=8.

Answer

x- intercept: (8,0), y- intercept: (0,2)

Try It 4.41 §4.3 source ↗

Find the intercepts of 3x–4y=12.

Answer

x- intercept: (4,0), y- intercept: (0,−3)

Try It 4.42 §4.3 source ↗

Find the intercepts of 2x–4y=8.

Answer

x- intercept: (4,0), y- intercept: (0,−2)

Try It 4.43 §4.3 source ↗

Graph x–2y=4 using the intercepts.

Answer

The figure shows a straight line on the x y- coordinate plane. The x- axis of the plane runs from negative 12 to 12. The y- axis of the planes runs from negative 12 to 12. The straight line goes through the points (negative 10, negative 7), (negative 8, negative 6), (negative 6, negative 5), (negative 4, negative 4), (negative 2, negative 3), (0, negative 2), (2, negative 1), (4, 0), (6, 1), (8, 2), and (10, 3).

Try It 4.44 §4.3 source ↗

Graph –x+3y=6 using the intercepts.

Answer

The figure shows a straight line on the x y- coordinate plane. The x- axis of the plane runs from negative 12 to 12. The y- axis of the planes runs from negative 12 to 12. The straight line goes through the points (negative 12, negative 2), (negative 9, negative 1), (negative 6, 0), (negative 3, 1), (0, 2), (3, 3), (6, 4), (9, 5), and (12, 6).

Try It 4.45 §4.3 source ↗

Graph 5x–2y=10 using the intercepts.

Answer

The figure shows the graph of a straight line on the x y- coordinate plane. The x- axis of the plane runs from negative 7 to 7. The y- axis of the planes runs from negative 7 to 7. The straight line goes through the points (0, negative 5), (2, 0), and (4, 5).

Try It 4.46 §4.3 source ↗

Graph 3x–4y=12 using the intercepts.

Answer

The figure shows the graph of a straight line on the x y- coordinate plane. The x- axis of the plane runs from negative 7 to 7. The y- axis of the planes runs from negative 7 to 7. The straight line goes through the points (negative 4, negative 6), (0, negative 3), and (4, 0).

Try It 4.47 §4.3 source ↗

Graph y=4x using the intercepts.

Answer

The figure shows a straight line on the x y- coordinate plane. The x- axis of the plane runs from negative 12 to 12. The y- axis of the planes runs from negative 12 to 12. The straight line goes through the points (negative 4, negative 12), (negative 3, negative 9), (negative 2, negative 6), (negative 1, negative 3), (0, 0), (1, 3), (2, 6), (3, 9), and (4, 12).

Try It 4.48 §4.3 source ↗

Graph y=−x the intercepts.

Answer

The figure shows a straight line on the x y- coordinate plane. The x- axis of the plane runs from negative 12 to 12. The y- axis of the planes runs from negative 12 to 12. The straight line goes through the points (negative 10, 10), (negative 9, 9), (negative 8, 8), (negative 7, 7), (negative 6, 6), (negative 5, 5), (negative 4, 4), (negative 3, 3), (negative 2, 2), (negative 1, 1), (0, 0), (1, negative 1), (2, negative 2), (3, negative 3), (4, negative 4), (5, negative 5), (6, negative 6), (7, negative 7), (8, negative 8), (9, negative 9), and (10, negative 10).

4.3-139 §4.3 source ↗

Identify the x- and y- Intercepts on a Graph

In the following exercises, find the x- and y- intercepts on each graph.
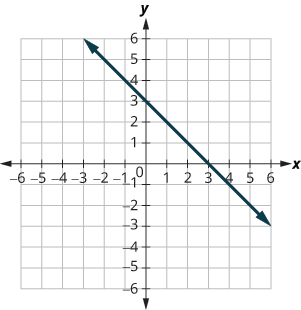
The figure shows a straight line on the x y- coordinate plane. The x- axis of the plane runs from negative 10 to 10. The y- axis of the planes runs from negative 10 to 10. The straight line goes through the points (negative 5, 8), (negative 4, 7), (negative 3, 6), (negative 2, 5), (negative 1, 4), (0, 3), (1, 2), (2, 1), (3, 0), (4, negative 1), (5, negative 2) and (6, negative 3).

Answer

(3,0),(0,3)

4.3-141 §4.3 source ↗

Identify the x- and y- Intercepts on a Graph

In the following exercises, find the x- and y- intercepts on each graph.
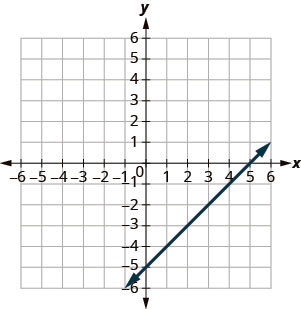
The figure shows a straight line on the x y- coordinate plane. The x- axis of the plane runs from negative 10 to 10. The y- axis of the planes runs from negative 10 to 10. The straight line goes through the points (negative 5, negative 10), (negative 4, negative 9), (negative 3, negative 8), (negative 2, negative 7), (negative 1, negative 6), (0, negative 5), (1, negative 4), (2, negative 3), (3, negative 2), (4, negative 1), (5, 0), (6, 1), (7, 2), and (8, 3).

Answer

(5,0), (0,−5)

4.3-143 §4.3 source ↗

Identify the x- and y- Intercepts on a Graph

In the following exercises, find the x- and y- intercepts on each graph.
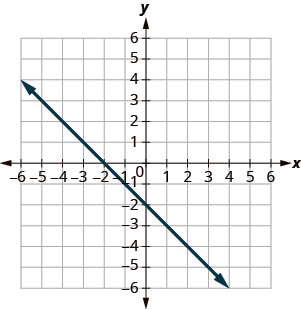
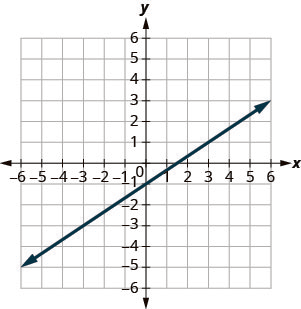
The figure shows a straight line on the x y- coordinate plane. The x- axis of the plane runs from negative 10 to 10. The y- axis of the planes runs from negative 10 to 10. The straight line goes through the points (negative 6, negative 7), (negative 5, negative 6), (negative 4, negative 5), (negative 3, negative 4), (negative 2, negative 3), (negative 1, negative 2), (0, negative 1), (1, 0), (2, 1), (3, 2), (4, 3), (5, 4), (6, 5), (7, 6), and (8, 7).

Answer

(−2,0), (0,−2)

4.3-145 §4.3 source ↗

Identify the x- and y- Intercepts on a Graph

In the following exercises, find the x- and y- intercepts on each graph.
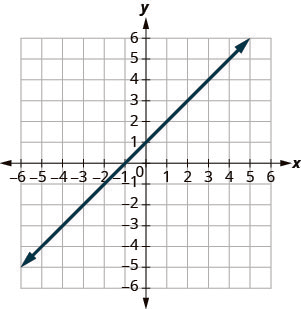
The figure shows a straight line on the x y- coordinate plane. The x- axis of the plane runs from negative 10 to 10. The y- axis of the planes runs from negative 10 to 10. The straight line goes through the points (negative 6, negative 5), (negative 5, negative 4), (negative 4, negative 3), (negative 3, negative 2), (negative 2, negative 1), (negative 1, 0), (0, 1), (1, 2), (2, 3), (3, 4), (4, 5), (5, 6), (6, 7), (7, 8), and (8, 9).

Answer

(−1,0), (0,1)

4.3-147 §4.3 source ↗

Identify the x- and y- Intercepts on a Graph

In the following exercises, find the x- and y- intercepts on each graph.
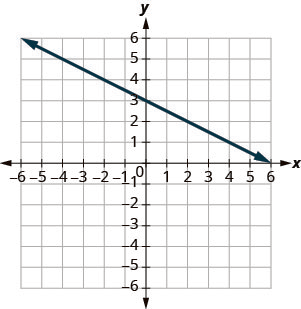
The figure shows a straight line on the x y- coordinate plane. The x- axis of the plane runs from negative 10 to 10. The y- axis of the planes runs from negative 10 to 10. The straight line goes through the points (negative 10, 8), (negative 8, 7), (negative 6, 6), (negative 4, 5), (negative 2, 4), (0, 3), (2, 2), (4, 1), (6, 0), (8, negative 1), and (10, negative 2).

Answer

(6,0),(0,3)

4.3-149 §4.3 source ↗

Identify the x- and y- Intercepts on a Graph

In the following exercises, find the x- and y- intercepts on each graph.
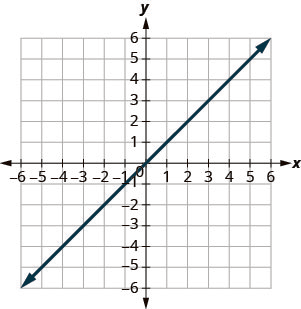
The figure shows a straight line on the x y- coordinate plane. The x- axis of the plane runs from negative 10 to 10. The y- axis of the planes runs from negative 10 to 10. The straight line goes through the plotted point (0, 0).

Answer

(0,0)

4.3-151 §4.3 source ↗

Find the x- and y- Intercepts from an Equation of a Line

In the following exercises, find the intercepts for each equation.

x + y = 4

Answer

(4,0),(0,4)

4.3-153 §4.3 source ↗

Find the x- and y- Intercepts from an Equation of a Line

In the following exercises, find the intercepts for each equation.

x + y = −2

Answer

(−2,0), (0,−2)

4.3-155 §4.3 source ↗

Find the x- and y- Intercepts from an Equation of a Line

In the following exercises, find the intercepts for each equation.

x – y = 5

Answer

(5,0), (0,−5)

4.3-157 §4.3 source ↗

Find the x- and y- Intercepts from an Equation of a Line

In the following exercises, find the intercepts for each equation.

x – y = −3

Answer

(−3,0), (0,3)

4.3-159 §4.3 source ↗

Find the x- and y- Intercepts from an Equation of a Line

In the following exercises, find the intercepts for each equation.

x + 2 y = 8

Answer

( 8 , 0 ) , ( 0 , 4 )

4.3-161 §4.3 source ↗

Find the x- and y- Intercepts from an Equation of a Line

In the following exercises, find the intercepts for each equation.

3 x + y = 6

Answer

( 2 , 0 ) , ( 0 , 6 )

4.3-163 §4.3 source ↗

Find the x- and y- Intercepts from an Equation of a Line

In the following exercises, find the intercepts for each equation.

x – 3 y = 12

Answer

(12,0), (0,−4)

4.3-165 §4.3 source ↗

Find the x- and y- Intercepts from an Equation of a Line

In the following exercises, find the intercepts for each equation.

4 x – y = 8

Answer

(2,0), (0,−8)

4.3-167 §4.3 source ↗

Find the x- and y- Intercepts from an Equation of a Line

In the following exercises, find the intercepts for each equation.

2 x + 5 y = 10

Answer

(5,0),(0,2)

4.3-169 §4.3 source ↗

Find the x- and y- Intercepts from an Equation of a Line

In the following exercises, find the intercepts for each equation.

3 x – 2 y = 12

Answer

(4,0), (0,−6)

4.3-171 §4.3 source ↗

Find the x- and y- Intercepts from an Equation of a Line

In the following exercises, find the intercepts for each equation.

y = 1 3 x + 1

Answer

(−3,0), (0,1)

4.3-173 §4.3 source ↗

Find the x- and y- Intercepts from an Equation of a Line

In the following exercises, find the intercepts for each equation.

y = 1 5 x + 2

Answer

(−10,0), (0,2)

4.3-175 §4.3 source ↗

Find the x- and y- Intercepts from an Equation of a Line

In the following exercises, find the intercepts for each equation.

y = 3 x

Answer

(0,0)

4.3-177 §4.3 source ↗

Find the x- and y- Intercepts from an Equation of a Line

In the following exercises, find the intercepts for each equation.

y = −4 x

Answer

(0,0)

4.3-179 §4.3 source ↗

Graph a Line Using the Intercepts

In the following exercises, graph using the intercepts.

– x + 5 y = 10

Answer

The figure shows a straight line on the x y- coordinate plane. The x- axis of the plane runs from negative 12 to 12. The y- axis of the planes runs from negative 12 to 12. The line graphed is negative x plus 5 y equals 10.

4.3-181 §4.3 source ↗

Graph a Line Using the Intercepts

In the following exercises, graph using the intercepts.

x + 2 y = 4

Answer

The figure shows a straight line on the x y- coordinate plane. The x- axis of the plane runs from negative 12 to 12. The y- axis of the planes runs from negative 12 to 12. The straight line goes through the points (negative 8, 6), (negative 6, 5), (negative 4, 4), (negative 2, 3), (0, 2), (2, 1), (4, 0), (6, negative 1), (8, negative 2), and (10, negative 3).

4.3-183 §4.3 source ↗

Graph a Line Using the Intercepts

In the following exercises, graph using the intercepts.

x + y = 2

Answer

The figure shows a straight line on the x y- coordinate plane. The x- axis of the plane runs from negative 12 to 12. The y- axis of the planes runs from negative 12 to 12. The straight line goes through the points (negative 8, 10), (negative 7, 9), (negative 6, 8),(negative 5, 7), (negative 4, 6), (negative 3, 5), (negative 2, 4), (negative 1, 3), (0, 2), (1, 1), (2, 0), (3, negative 1), (4, negative 2), (5, negative 3), (6, negative 4), (7, negative 5), (8, negative 6), (9, negative 7), and (10, negative 8).

4.3-185 §4.3 source ↗

Graph a Line Using the Intercepts

In the following exercises, graph using the intercepts.

x + y = −3

Answer

The figure shows a straight line on the x y- coordinate plane. The x- axis of the plane runs from negative 7 to 7. The y- axis of the planes runs from negative 7 to 7. The straight line goes through the points (negative 7, 4), (negative 6, 3), (negative 5, 2),(negative 4, 1), (negative 3, 0), (negative 2, negative 1), (negative 1, negative 2), (0, negative 3), (1, negative 4), (2, negative 5), (3, negative 6), and (4, negative 7).

4.3-187 §4.3 source ↗

Graph a Line Using the Intercepts

In the following exercises, graph using the intercepts.

x – y = 1

Answer

The figure shows a straight line on the x y- coordinate plane. The x- axis of the plane runs from negative 12 to 12. The y- axis of the planes runs from negative 12 to 12. The straight line goes through the points (negative 8, negative 9), (negative 7, negative 8), (negative 6, negative 7),(negative 5, negative 6), (negative 4, negative 5), (negative 3, negative 4), (negative 2, negative 3), (negative 1, negative 2), (0, negative 1), (1, 0), (2, 1), (3, 2), (4, 3), (5, 4), (6, 5), (7, 6), (8, 7), (9, 8), and (10, 9).

4.3-189 §4.3 source ↗

Graph a Line Using the Intercepts

In the following exercises, graph using the intercepts.

x – y = −4

Answer

The figure shows a straight line on the x y- coordinate plane. The x- axis of the plane runs from negative 12 to 12. The y- axis of the planes runs from negative 12 to 12. The straight line goes through the points (negative 8, negative 4), (negative 7, negative 3), (negative 6, negative 2),(negative 5, negative 1), (negative 4, 0), (negative 3, 1), (negative 2, 2), (negative 1, 3), (0, 4), (1, 5), (2, 6), (3, 7), (4, 8), (5, 9), (6, 10), (7, 11), and (8, 12).

4.3-191 §4.3 source ↗

Graph a Line Using the Intercepts

In the following exercises, graph using the intercepts.

4 x + y = 4

Answer

The figure shows a straight line on the x y- coordinate plane. The x- axis of the plane runs from negative 12 to 12. The y- axis of the planes runs from negative 12 to 12. The straight line goes through the points (negative 2, 12), (negative 1, 8), (0, 4), (1, 0), (2, negative 4), (3, negative 8), and (4, negative 12).

4.3-193 §4.3 source ↗

Graph a Line Using the Intercepts

In the following exercises, graph using the intercepts.

2 x + 4 y = 12

Answer

The figure shows a straight line on the x y- coordinate plane. The x- axis of the plane runs from negative 7 to 7. The y- axis of the planes runs from negative 7 to 7. The straight line goes through the points (negative 6, 6), (negative 4, 5), (negative 2, 4), (0, 3), (2, 2), (4, 1), and (6, 0).

4.3-195 §4.3 source ↗

Graph a Line Using the Intercepts

In the following exercises, graph using the intercepts.

3 x – 2 y = 6

Answer

The figure shows a straight line on the x y- coordinate plane. The x- axis of the plane runs from negative 12 to 12. The y- axis of the planes runs from negative 12 to 12. The straight line goes through the points (negative 6, negative 12), (negative 4, negative 9), (negative 2, negative 6), (0, negative 3), (2, 0), (4, 3), (6, 6), (8, 9), and (10, 12).

4.3-197 §4.3 source ↗

Graph a Line Using the Intercepts

In the following exercises, graph using the intercepts.

2 x – 5 y = −20

Answer

The figure shows a straight line on the x y- coordinate plane. The x- axis of the plane runs from negative 12 to 12. The y- axis of the planes runs from negative 12 to 12. The straight line goes through the points (negative 10, 0), (negative 5, 2), (0, 4), (5, 6), and (10, 8).

4.3-199 §4.3 source ↗

Graph a Line Using the Intercepts

In the following exercises, graph using the intercepts.

3 x – y = −6

Answer

The figure shows a straight line on the x y- coordinate plane. The x- axis of the plane runs from negative 12 to 12. The y- axis of the planes runs from negative 12 to 12. The straight line goes through the points (negative 6, negative 12), (negative 5, negative 9), (negative 4, negative 6), (negative 3, negative 3), (negative 2, 0), (1, 3), (2, 6), (3, 9), and (4, 12).

4.3-201 §4.3 source ↗

Graph a Line Using the Intercepts

In the following exercises, graph using the intercepts.

y = −2 x

Answer

The figure shows a straight line on the x y- coordinate plane. The x- axis of the plane runs from negative 12 to 12. The y- axis of the planes runs from negative 12 to 12. The straight line goes through the points (negative 5, 10), (negative 4, 8), (negative 3, 6), (negative 2, 4), (negative 1, 2), (0, 0), (1, negative 2), (2, negative 4), (3, negative 6), (4, negative 8), (5, negative 10), and (6, negative 12)

4.3-203 §4.3 source ↗

Graph a Line Using the Intercepts

In the following exercises, graph using the intercepts.

y = x

Answer

The figure shows a straight line on the x y- coordinate plane. The x- axis of the plane runs from negative 12 to 12. The y- axis of the planes runs from negative 12 to 12. The straight line goes through the points (negative 10, 10), (negative 9, 9), (negative 8, 8), (negative 7, 7), (negative 6, 6), (negative 5, 5), (negative 4, 4), (negative 3, 3), (negative 2, 2), (negative 1, 1), (0, 0), (1, 1), (2, 2), (3, 3), (4, 4), (5, 5), (6, 6), (7, 7), (8, 8), (9, 9), and (10, 10)

4.3-205 §4.3 source ↗

Graph a Line Using the Intercepts

In the following exercises, graph using the intercepts.

Road trip. Damien is driving from Chicago to Denver, a distance of 1000 miles. The x- axis on the graph below shows the time in hours since Damien left Chicago. The y- axis represents the distance he has left to drive.
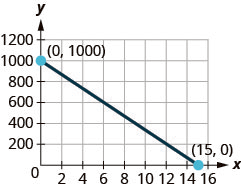
The figure shows a straight line on the x y- coordinate plane. The x- axis of the plane runs from 0 to 16. The y- axis of the planes runs from 0 to 1200 in increments of 200. The straight line goes through the points (0, 1000), (3, 800), (6, 600), (9, 400), (12, 200), and (15, 0). The points (0, 1000) and (15, 0) are marked and labeled with their coordinates.

ⓐ Find the x- and y- intercepts.

ⓑ Explain what the x- and y- intercepts mean for Damien.

Answer

ⓐ (0,1000), (15,0)
ⓑ At (0,1000), he has been gone 0 hours and has 1000 miles left. At (15,0), he has been gone 15 hours and has 0 miles left to go.

4.3-207 §4.3 source ↗

Graph a Line Using the Intercepts

In the following exercises, graph using the intercepts.

How do you find the x- intercept of the graph of 3x–2y=6?

Answer

Answers will vary.

4.3-209 §4.3 source ↗

Graph a Line Using the Intercepts

In the following exercises, graph using the intercepts.

Do you prefer to use the method of plotting points or the method using the intercepts to graph the equation y=23x−2? Why?

Answer

Answers will vary.

Be Prepared 4.7 §4.4 source ↗

Simplify: 1–48−2.
If you missed this problem, review Example 1.74.
Example 1.74 in the book ↗

Answer

− 1 2

Be Prepared 4.8 §4.4 source ↗

Divide: 04,40.
If you missed this problem, review Example 1.127.
Example 1.127 in the book ↗

Answer

0, undefined

Be Prepared 4.9 §4.4 source ↗

Simplify: 15−3, −153, −15−3.
If you missed this problem, review Example 1.65.
Example 1.65 in the book ↗

Answer

−5 , −5 , 5

Try It 4.49 §4.4 source ↗

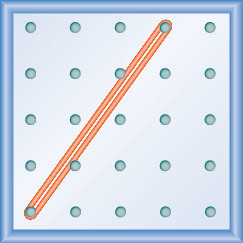
What is the slope of the line on the geoboard shown?
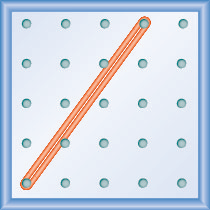
The figure shows a grid of evenly spaced pegs. There are 5 columns and 5 rows of pegs. A rubber band is stretched between the peg in column 1, row 5 and the peg in column 4, row 1, forming a line.

Answer

4 3

Try It 4.50 §4.4 source ↗

What is the slope of the line on the geoboard shown?

The figure shows a grid of evenly spaced pegs. There are 5 columns and 5 rows of pegs. A rubber band is stretched between the peg in column 1, row 4 and the peg in column 5, row 3, forming a line.

Answer

1 4

Try It 4.51 §4.4 source ↗

What is the slope of the line on the geoboard?

The figure shows a grid of evenly spaced pegs. There are 5 columns and 5 rows of pegs. A rubber band is stretched between the peg in column 1, row 2 and the peg in column 4, row 4, forming a line.

Answer

− 2 3

Try It 4.52 §4.4 source ↗

What is the slope of the line on the geoboard?
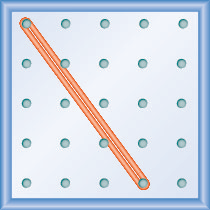
The figure shows a grid of evenly spaced pegs. There are 5 columns and 5 rows of pegs. A rubber band is stretched between the peg in column 1, row 1 and the peg in column 4, row 5, forming a line.

Answer

− 4 3

Try It 4.53 §4.4 source ↗

Model the slope m=13. Draw a picture to show your results.

Answer

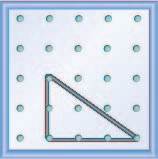
The figure shows a grid of evenly spaced pegs. There are 5 columns and 5 rows of pegs. A rubber band is stretched between the peg in column 2, row 3, the peg in column 2, row 4 and the peg in column 5, row 3, forming a right triangle. The 2, 3 peg forms the vertex of the 90 degree angle and the line from the 2, 4 peg to the 5, 3 peg forms the hypotenuse of the triangle.

Try It 4.54 §4.4 source ↗

Model the slope m=32. Draw a picture to show your results.

Answer

The figure shows a grid of evenly spaced pegs. There are 5 columns and 5 rows of pegs. A rubber band is stretched between the peg in column 1, row 1, the peg in column 1, row 4 and the peg in column 3, row 1, forming a right triangle. The 1, 1 peg forms the vertex of the 90 degree angle and the line from the 1, 4 peg to the 3, 1 peg forms the hypotenuse of the triangle.

Try It 4.55 §4.4 source ↗

Model the slope m=−23. Draw a picture to show your results.

Answer

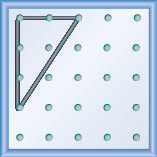
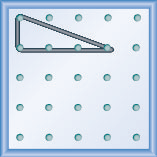
The figure shows a grid of evenly spaced pegs. There are 5 columns and 5 rows of pegs. A rubber band is stretched between the peg in column 2, row 3, the peg in column 2, row 5 and the peg in column 3, row 5, forming a right triangle. The 2, 5 peg forms the vertex of the 90 degree angle and the line from the 2, 3 peg to the 3, 5 peg forms the hypotenuse of the triangle.

Try It 4.56 §4.4 source ↗

Model the slope m=−13. Draw a picture to show your results.

Answer

The figure shows a grid of evenly spaced pegs. There are 5 columns and 5 rows of pegs. A rubber band is stretched between the peg in column 1, row 1, the peg in column 1, row 2 and the peg in column 4, row 2, forming a right triangle. The 1, 2 peg forms the vertex of the 90 degree angle and the line from the 1, 1 peg to the 4, 2 peg forms the hypotenuse of the triangle.

Try It 4.57 §4.4 source ↗

Find the slope of the line shown.
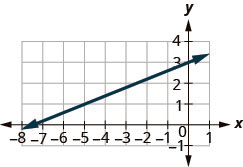
The graph shows the x y coordinate plane. The x-axis runs from negative 8 to 1 and the y-axis runs from negative 1 to 4. A line passes through the points (negative 5, 1) and (0, 3).

Answer

2 5

Try It 4.58 §4.4 source ↗

Find the slope of the line shown.
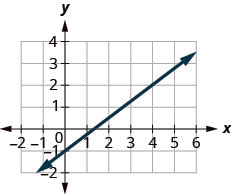
The graph shows the x y coordinate plane. The x-axis runs from negative 1 to 5 and the y-axis runs from negative 2 to 4. A line passes through the points (0, negative 1) and (4, 2).

Answer

3 4

Try It 4.59 §4.4 source ↗

Find the slope of the line shown.
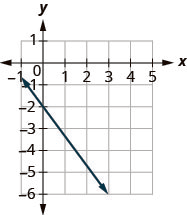
The graph shows the x y coordinate plane. The x-axis runs from negative 1 to 5 and the y-axis runs from negative 6 to 1. A line passes through the points (0, negative 2) and (3, negative 6).

Answer

− 4 3

Try It 4.60 §4.4 source ↗

Find the slope of the line shown.
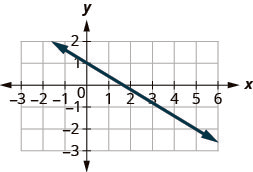
The graph shows the x y coordinate plane. The x-axis runs from negative 3 to 6 and the y-axis runs from negative 3 to 2. A line passes through the points (0, 1) and (5, negative 2).

Answer

− 3 5

Try It 4.61 §4.4 source ↗

Find the slope of the line shown.
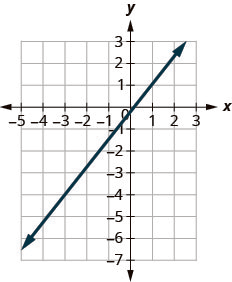
The graph shows the x y coordinate plane. The x-axis runs from negative 4 to 2 and the y-axis runs from negative 6 to 2. A line passes through the points (negative 3, 4) and (1, 1).

Answer

5 4

Try It 4.62 §4.4 source ↗

Find the slope of the line shown.
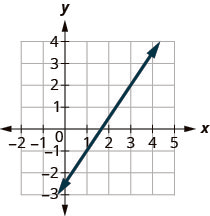
The graph shows the x y coordinate plane. The x-axis runs from negative 1 to 4 and the y-axis runs from negative 2 to 3. A line passes through the points (1, negative 1) and (3, 2).

Answer

3 2

Try It 4.63 §4.4 source ↗

Find the slope of the line: x=−4.

Answer

undefined

Try It 4.64 §4.4 source ↗

Find the slope of the line: y=7.

Answer

0

Try It 4.65 §4.4 source ↗

Use the slope formula to find the slope of the line through the points: (8,5) and (6,3).

Answer

1

Try It 4.66 §4.4 source ↗

Use the slope formula to find the slope of the line through the points: (1,5) and (5,9).

Answer

1

Try It 4.67 §4.4 source ↗

Use the slope formula to find the slope of the line through the points: (−3,4) and (2,−1).

Answer

−1

Try It 4.68 §4.4 source ↗

Use the slope formula to find the slope of the line through the pair of points: (−2,6) and (−3,−4).

Answer

10

Try It 4.69 §4.4 source ↗

Graph the line passing through the point (2,−2) with the slope m=43.

Answer

The graph shows the x y coordinate plane. The x and y-axes run from negative 12 to 12. A line passes through the points (negative 4, negative 10) and (2, negative 2).

Try It 4.70 §4.4 source ↗

Graph the line passing through the point (−2,3) with the slope m=14.

Answer

The graph shows the x y coordinate plane. The x and y-axes run from negative 12 to 12. A line passes through the points (negative 2, 3) and (10, 6).

Try It 4.71 §4.4 source ↗

Graph the line with the y-intercept 4 and slope m=−52.

Answer

The graph shows the x y coordinate plane. The x and y-axes run from negative 12 to 12. A line intercepts the y-axis at (0, 4) and passes through the point (4, negative 6).

Try It 4.72 §4.4 source ↗

Graph the line with the x-intercept −3 and slope m=−34.

Answer

The graph shows the x y coordinate plane. The x and y-axes run from negative 12 to 12. A line intercepts the x-axis at (negative 3, 0) and passes through the point (1, negative 3).

Try It 4.73 §4.4 source ↗

Graph the line with the point (−2,1) and slope m=3.

Answer

The graph shows the x y coordinate plane. The x and y-axes run from negative 7 to 7. A line passes through the points (negative 2, 1) and (negative 1, 4).

Try It 4.74 §4.4 source ↗

Graph the line with the point (4,−2) and slope m=−2.

Answer

The graph shows the x y coordinate plane. The x and y-axes run from negative 7 to 7. A line passes through the points (4, negative 2) and (5, negative 4).

Try It 4.75 §4.4 source ↗

Use Example 4.38, substituting the rise = 14 and run = 24.

Answer

7 12

Try It 4.76 §4.4 source ↗

Use Example 4.38, substituting rise = 15 and run = 36.

Answer

5 12

Try It 4.77 §4.4 source ↗

Find the slope of a pipe that slopes down 13 inch per foot.

Answer

− 1 36

Try It 4.78 §4.4 source ↗

Find the slope of a pipe that slopes down 34 inch per yard.

Answer

− 1 48

4.4-211 §4.4 source ↗

Use Geoboards to Model Slope

In the following exercises, find the slope modeled on each geoboard.

The figure shows a grid of evenly spaced pegs. There are 5 columns and 5 rows of pegs. A rubber band is stretched between the peg in column 1, row 3 and the peg in column 5, row 2, forming a line.

Answer

1 4

4.4-213 §4.4 source ↗

Use Geoboards to Model Slope

In the following exercises, find the slope modeled on each geoboard.

The figure shows a grid of evenly spaced pegs. There are 5 columns and 5 rows of pegs. A rubber band is stretched between the peg in column 1, row 4 and the peg in column 4, row 2, forming a line.

Answer

2 3

4.4-215 §4.4 source ↗

Use Geoboards to Model Slope

In the following exercises, find the slope modeled on each geoboard.
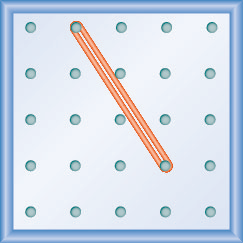
The figure shows a grid of evenly spaced pegs. There are 5 columns and 5 rows of pegs. A rubber band is stretched between the peg in column 2, row 1 and the peg in column 4, row 4, forming a line.

Answer

−3 2 = − 3 2

4.4-217 §4.4 source ↗

Use Geoboards to Model Slope

In the following exercises, find the slope modeled on each geoboard.
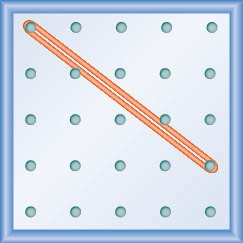
The figure shows a grid of evenly spaced pegs. There are 5 columns and 5 rows of pegs. A rubber band is stretched between the peg in column 1, row 1 and the peg in column 5, row 4, forming a line.

Answer

− 3 4

4.4-219 §4.4 source ↗

In the following exercises, model each slope. Draw a picture to show your results.

2 3

Answer

The figure shows a grid of evenly spaced pegs. There are 5 columns and 5 rows of pegs. A rubber band is stretched between the peg in column 2, row 5 and the peg in column 5, row 3, forming a line.

4.4-221 §4.4 source ↗

In the following exercises, model each slope. Draw a picture to show your results.

1 4

Answer

The figure shows a grid of evenly spaced pegs. There are 5 columns and 5 rows of pegs. A rubber band is stretched between the peg in column 1, row 4 and the peg in column 5, row 3, forming a line.

4.4-223 §4.4 source ↗

In the following exercises, model each slope. Draw a picture to show your results.

− 1 2

Answer

The figure shows a grid of evenly spaced pegs. There are 5 columns and 5 rows of pegs. A rubber band is stretched between the peg in column 1, row 4 and the peg in column 3, row 5, forming a line.

4.4-225 §4.4 source ↗

In the following exercises, model each slope. Draw a picture to show your results.

− 2 3

Answer

The figure shows a grid of evenly spaced pegs. There are 5 columns and 5 rows of pegs. A rubber band is stretched between the peg in column 1, row 2 and the peg in column 4, row 4, forming a line.

4.4-227 §4.4 source ↗

Use m=riserun to find the Slope of a Line from its Graph

In the following exercises, find the slope of each line shown.
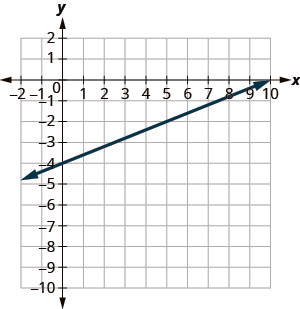
The graph shows the x y coordinate plane. The x and y-axes run from negative 10 to 10. A line passes through the points (negative 10, negative 8), (0, negative 4), and (10, 0).

Answer

2 5

4.4-229 §4.4 source ↗

Use m=riserun to find the Slope of a Line from its Graph

In the following exercises, find the slope of each line shown.
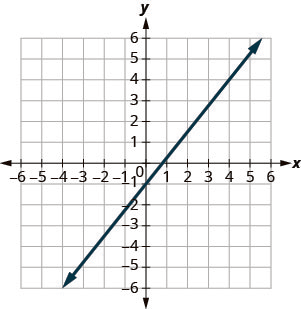
The graph shows the x y coordinate plane. The x and y-axes run from negative 7 to 7. A line passes through the points (negative 4, negative 6) and (4, 4).

Answer

5 4

4.4-231 §4.4 source ↗

Use m=riserun to find the Slope of a Line from its Graph

In the following exercises, find the slope of each line shown.
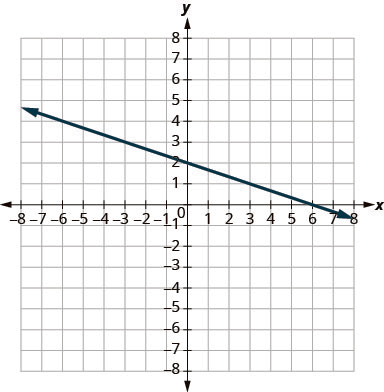
The graph shows the x y coordinate plane. The x and y-axes run from negative 7 to 7. A line passes through the points (negative 3, 3) and (3, 1).

Answer

− 1 3

4.4-233 §4.4 source ↗

Use m=riserun to find the Slope of a Line from its Graph

In the following exercises, find the slope of each line shown.
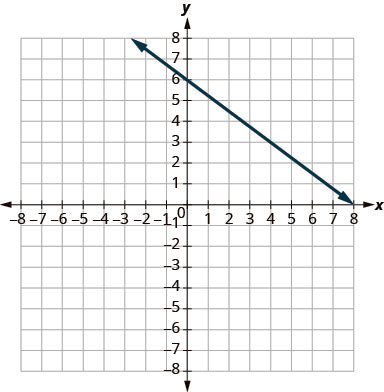
The graph shows the x y coordinate plane. The x and y-axes run from negative 7 to 7. A line intercepts the y-axis at (0, 6) and passes through the point (4, 3).

Answer

− 3 4

4.4-235 §4.4 source ↗

Use m=riserun to find the Slope of a Line from its Graph

In the following exercises, find the slope of each line shown.
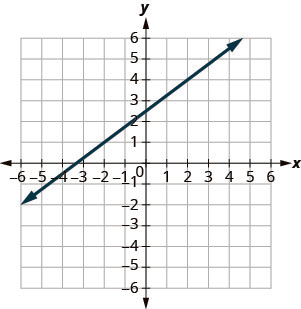
The graph shows the x y coordinate plane. The x and y-axes run from negative 7 to 7. A line passes through the points (negative 2, 1) and (2, 4).

Answer

3 4

4.4-237 §4.4 source ↗

Use m=riserun to find the Slope of a Line from its Graph

In the following exercises, find the slope of each line shown.
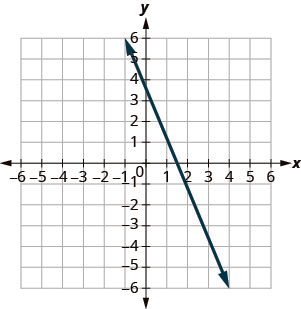
The graph shows the x y coordinate plane. The x and y-axes run from negative 7 to 7. A line passes through the points (negative 1, 6) and (1, 1).

Answer

−3

4.4-239 §4.4 source ↗

Use m=riserun to find the Slope of a Line from its Graph

In the following exercises, find the slope of each line shown.
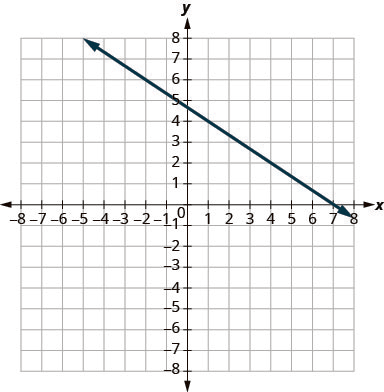
The graph shows the x y coordinate plane. The x and y-axes run from negative 7 to 7. A line passes through the points (negative 2, 6) and (1, 4).

Answer

− 2 3

4.4-241 §4.4 source ↗

Use m=riserun to find the Slope of a Line from its Graph

In the following exercises, find the slope of each line shown.
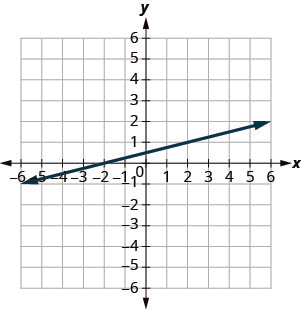
The graph shows the x y coordinate plane. The x and y-axes run from negative 10 to 10. A line intercepts the x-axis at (negative 2, 0) and passes through the point (2, 1).

Answer

1 4

4.4-243 §4.4 source ↗

Find the Slope of Horizontal and Vertical Lines

In the following exercises, find the slope of each line.

y = 3

Answer

0

4.4-245 §4.4 source ↗

Find the Slope of Horizontal and Vertical Lines

In the following exercises, find the slope of each line.

x = 4

Answer

undefined

4.4-247 §4.4 source ↗

Find the Slope of Horizontal and Vertical Lines

In the following exercises, find the slope of each line.

y = −2

Answer

0

4.4-249 §4.4 source ↗

Find the Slope of Horizontal and Vertical Lines

In the following exercises, find the slope of each line.

x = −5

Answer

undefined

4.4-251 §4.4 source ↗

Use the Slope Formula to find the Slope of a Line between Two Points

In the following exercises, use the slope formula to find the slope of the line between each pair of points.

( 1 , 4 ) , ( 3 , 9 )

Answer

5 2

4.4-253 §4.4 source ↗

Use the Slope Formula to find the Slope of a Line between Two Points

In the following exercises, use the slope formula to find the slope of the line between each pair of points.

( 0 , 3 ) , ( 4 , 6 )

Answer

3 4

4.4-255 §4.4 source ↗

Use the Slope Formula to find the Slope of a Line between Two Points

In the following exercises, use the slope formula to find the slope of the line between each pair of points.

( 2 , 5 ) , ( 4 , 0 )

Answer

− 5 2

4.4-257 §4.4 source ↗

Use the Slope Formula to find the Slope of a Line between Two Points

In the following exercises, use the slope formula to find the slope of the line between each pair of points.

(−3,3), (4,−5)

Answer

− 8 7

4.4-259 §4.4 source ↗

Use the Slope Formula to find the Slope of a Line between Two Points

In the following exercises, use the slope formula to find the slope of the line between each pair of points.

(−1,−2), (2,5)

Answer

7 3

4.4-261 §4.4 source ↗

Use the Slope Formula to find the Slope of a Line between Two Points

In the following exercises, use the slope formula to find the slope of the line between each pair of points.

(4,−5), (1,−2)

Answer

−1

4.4-263 §4.4 source ↗

Graph a Line Given a Point and the Slope

In the following exercises, graph each line with the given point and slope.

(1,−2); m=34

Answer

The graph shows the x y coordinate plane. The x and y-axes run from negative 12 to 12. A line passes through the points (1, negative 2) and (5, 1).

4.4-265 §4.4 source ↗

Graph a Line Given a Point and the Slope

In the following exercises, graph each line with the given point and slope.

(2,5); m=−13

Answer

The graph shows the x y coordinate plane. The x and y-axes run from negative 12 to 12. A line passes through the points (2, 5) and (5, 4).

4.4-267 §4.4 source ↗

Graph a Line Given a Point and the Slope

In the following exercises, graph each line with the given point and slope.

(−3,4); m=−32

Answer

The graph shows the x y coordinate plane. The x and y-axes run from negative 12 to 12. A line passes through the points (negative 3, 4) and (negative 1, 1).

4.4-269 §4.4 source ↗

Graph a Line Given a Point and the Slope

In the following exercises, graph each line with the given point and slope.

(−1,−4); m=43

Answer

The graph shows the x y coordinate plane. The x and y-axes run from negative 12 to 12. A line passes through the points (negative 1, negative 4) and intercepts the x-axis at (2, 0).

4.4-271 §4.4 source ↗

Graph a Line Given a Point and the Slope

In the following exercises, graph each line with the given point and slope.

y-intercept 3; m=−25

Answer

The graph shows the x y coordinate plane. The x and y-axes run from negative 12 to 12. A line intercepts the y-axis at (0, 3) and passes through the point (5, 1).

4.4-273 §4.4 source ↗

Graph a Line Given a Point and the Slope

In the following exercises, graph each line with the given point and slope.

x-intercept −2; m=34

Answer

The graph shows the x y coordinate plane. The x and y-axes run from negative 12 to 12. A line intercepts the x-axis at (negative 2, 0) and passes through the point (2, 3).

4.4-275 §4.4 source ↗

Graph a Line Given a Point and the Slope

In the following exercises, graph each line with the given point and slope.

(−3,3); m=2

Answer

The graph shows the x y coordinate plane. The x and y-axes run from negative 12 to 12. A line passes through the points (negative 3, 3) and (negative 2, 5).

4.4-277 §4.4 source ↗

Graph a Line Given a Point and the Slope

In the following exercises, graph each line with the given point and slope.

(1,5); m=−3

Answer

The graph shows the x y coordinate plane. The x and y-axes run from negative 12 to 12. A line passes through the points (1, 5) and (2, 2).

4.4-279 §4.4 source ↗

Graph a Line Given a Point and the Slope

In the following exercises, graph each line with the given point and slope.

Slope of a roof. An easy way to determine the slope of a roof is to set one end of a 12 inch level on the roof surface and hold it level. Then take a tape measure or ruler and measure from the other end of the level down to the roof surface. This will give you the slope of the roof. Builders, sometimes, refer to this as pitch and state it as an “x 12 pitch” meaning x12, where x is the measurement from the roof to the level—the rise. It is also sometimes stated as an “x-in-12 pitch”.

ⓐ What is the slope of the roof in this picture?

ⓑ What is the pitch in construction terms?
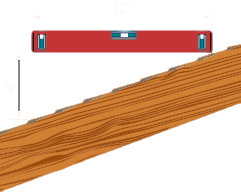
This figure shows one side of a sloped roof of a house. The rise of the roof is labeled “4 inches” and the run of the roof is labeled “12 inches”.This figure shows one side of a sloped roof of a house. The rise of the roof is labeled “4 inches” and the run of the roof is labeled “12 inches”.

Answer

ⓐ 13 ⓑ 4 12 pitch or 4-in-12 pitch

4.4-281 §4.4 source ↗

Graph a Line Given a Point and the Slope

In the following exercises, graph each line with the given point and slope.

Road grade. A local road has a grade of 6%. The grade of a road is its slope expressed as a percent. Find the slope of the road as a fraction and then simplify. What rise and run would reflect this slope or grade?

Answer

350; rise = 3, run = 50

4.4-283 §4.4 source ↗

Graph a Line Given a Point and the Slope

In the following exercises, graph each line with the given point and slope.

Wheelchair ramp. The rules for wheelchair ramps require a maximum 1-inch rise for a 12-inch run.

ⓐ How long must the ramp be to accommodate a 24-inch rise to the door?

ⓑ Create a model of this ramp.

Answer

ⓐ 288 inches (24 feet) ⓑ Models will vary.

4.4-285 §4.4 source ↗

Graph a Line Given a Point and the Slope

In the following exercises, graph each line with the given point and slope.

What does the sign of the slope tell you about a line?

Answer

When the slope is a positive number the line goes up from left to right. When the slope is a negative number the line goes down from left to right.

4.4-287 §4.4 source ↗

Graph a Line Given a Point and the Slope

In the following exercises, graph each line with the given point and slope.

Why is the slope of a vertical line “undefined”?

Answer

A vertical line has 0 run and since division by 0 is undefined the slope is undefined.

Be Prepared 4.10 §4.5 source ↗

Add: x4+14.
If you missed this problem, review Example 1.77.
Example 1.77 in the book ↗

Answer

x + 1 4

Be Prepared 4.11 §4.5 source ↗

Find the reciprocal of 37.
If you missed this problem, review Example 1.70.
Example 1.70 in the book ↗

Answer

7 3

Be Prepared 4.12 §4.5 source ↗

Solve 2x− 3y= 12fory.
If you missed this problem, review Example 2.63.
Example 2.63 in the book ↗

Answer

y = 12 − 2 x −3

Try It 4.79 §4.5 source ↗

Use the graph to find the slope and y-intercept of the line y=23x−1. Compare these values to the equation y=mx+b.

The figure shows a line graphed on the x y-coordinate plane. The x-axis of the plane runs from negative 8 to 8. The y-axis of the plane runs from negative 8 to 8. The line goes through the points (0, negative 1) and (6, 3).

Answer

slope m=23 and y-intercept (0,−1)

Try It 4.80 §4.5 source ↗

Use the graph to find the slope and y-intercept of the line y=12x+3. Compare these values to the equation y=mx+b.

The figure shows a line graphed on the x y-coordinate plane. The x-axis of the plane runs from negative 8 to 8. The y-axis of the plane runs from negative 8 to 8. The line goes through the points (0, 3) and (negative 6, 0).

Answer

slope m=12 and y-intercept (0,3)

Try It 4.81 §4.5 source ↗

Identify the slope and y-intercept of the line y=25x−1.

Answer

2 5 ; ( 0 , −1 )

Try It 4.82 §4.5 source ↗

Identify the slope and y-intercept of the line y=−43x+1.

Answer

− 4 3 ; ( 0 , 1 )

Try It 4.83 §4.5 source ↗

Identify the slope and y-intercept of the line x+4y=8.

Answer

− 1 4 ; ( 0 , 2 )

Try It 4.84 §4.5 source ↗

Identify the slope and y-intercept of the line 3x+2y=12.

Answer

− 3 2 ; ( 0 , 6 )

Try It 4.85 §4.5 source ↗

Graph the line of the equation y=4x+1 using its slope and y-intercept.

Answer

The figure shows a line graphed on the x y-coordinate plane. The x-axis of the plane runs from negative 10 to 10. The y-axis of the plane runs from negative 10 to 10. The points (0, 1) and (1, 5) are plotted on the line.

Try It 4.86 §4.5 source ↗

Graph the line of the equation y=2x−3 using its slope and y-intercept.

Answer

The figure shows a line graphed on the x y-coordinate plane. The x-axis of the plane runs from negative 10 to 10. The y-axis of the plane runs from negative 10 to 10. The points (0, negative 3) and (1, negative 1) are plotted on the line.

Try It 4.87 §4.5 source ↗

Graph the line of the equation y=−x−3 using its slope and y-intercept.

Answer

The figure shows a line graphed on the x y-coordinate plane. The x-axis of the plane runs from negative 10 to 10. The y-axis of the plane runs from negative 10 to 10. The points (0, negative 3) and (1, negative 4) are plotted on the line.

Try It 4.88 §4.5 source ↗

Graph the line of the equation y=−x−1 using its slope and y-intercept.

Answer

The figure shows a line graphed on the x y-coordinate plane. The x-axis of the plane runs from negative 10 to 10. The y-axis of the plane runs from negative 10 to 10. The points (0, negative 1) and (1, negative 2) are plotted on the line.

Try It 4.89 §4.5 source ↗

Graph the line of the equation y=−52x+1 using its slope and y-intercept.

Answer

The figure shows a line graphed on the x y-coordinate plane. The x-axis of the plane runs from negative 10 to 10. The y-axis of the plane runs from negative 10 to 10. The points (0,1) and (2, negative 4) are plotted on the line.

Try It 4.90 §4.5 source ↗

Graph the line of the equation y=−34x−2 using its slope and y-intercept.

Answer

The figure shows a line graphed on the x y-coordinate plane. The x-axis of the plane runs from negative 10 to 10. The y-axis of the plane runs from negative 10 to 10. The points (0, negative 2) and (4, negative 5) are plotted on the line.

Try It 4.91 §4.5 source ↗

Graph the line of the equation 2x−y=6 using its slope and y-intercept.

Answer

The figure shows a line graphed on the x y-coordinate plane. The x-axis of the plane runs from negative 10 to 10. The y-axis of the plane runs from negative 10 to 10. The points (0, negative 6) and (1, negative 4) are plotted on the line.

Try It 4.92 §4.5 source ↗

Graph the line of the equation 3x−2y=8 using its slope and y-intercept.

Answer

The figure shows a line graphed on the x y-coordinate plane. The x-axis of the plane runs from negative 10 to 10. The y-axis of the plane runs from negative 10 to 10. The points (0, negative 4) and (2, negative 1) are plotted on the line.

Try It 4.93 §4.5 source ↗

Graph the line of the equation y=0.5x+25 using its slope and y-intercept.

Answer

The figure shows a line graphed on the x y-coordinate plane. The x-axis of the plane runs from negative 70 to 30. The y-axis of the plane runs from negative 20 to 40. The points (0, 25) and (10, 30) are plotted on the line.

Try It 4.94 §4.5 source ↗

Graph the line of the equation y=0.1x−30 using its slope and y-intercept.

Answer

The figure shows a line graphed on the x y-coordinate plane. The x-axis of the plane runs from negative 50 to 350. The y-axis of the plane runs from negative 40 to 40. The points (0, negative 30) and (100, negative 20) are plotted on the line.

Try It 4.95 §4.5 source ↗

Determine the most convenient method to graph each line: ⓐ 3x+2y=12 ⓑ y=4 ⓒ y=15x−4 ⓓ x=−7.

Answer

ⓐ intercepts ⓑ horizontal line ⓒ slope–intercept ⓓ vertical line

Try It 4.96 §4.5 source ↗

Determine the most convenient method to graph each line: ⓐ x=6 ⓑ y=−34x+1 ⓒ y=−8 ⓓ 4x−3y=−1.

Answer

ⓐ vertical line ⓑ slope–intercept ⓒ horizontal line ⓓ intercepts

Try It 4.97 §4.5 source ↗

The equation h=2s+50 is used to estimate a woman’s height in inches, h, based on her shoe size, s.

ⓐ Estimate the height of a child who wears women’s shoe size 0.

ⓑ Estimate the height of a woman with shoe size 8.

ⓒ Interpret the slope and h-intercept of the equation.

ⓓ Graph the equation.

Answer

ⓐ 50 inches

ⓑ 66 inches

ⓒ The slope, 2, means that the height, h, increases by 2 inches when the shoe size, s, increases by 1. The h-intercept means that when the shoe size is 0, the height is 50 inches.

ⓓ
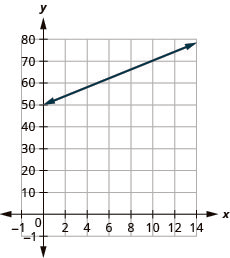
The figure shows a line graphed on the x y-coordinate plane. The x-axis of the plane represents the variable s and runs from negative 2 to 15. The y-axis of the plane represents the variable h and runs from negative 1 to 80. The line begins at the point (0, 50) and goes through the points (8, 66).

Try It 4.98 §4.5 source ↗

The equation T=14n+40 is used to estimate the temperature in degrees Fahrenheit, T, based on the number of cricket chirps, n, in one minute.

ⓐ Estimate the temperature when there are no chirps.

ⓑ Estimate the temperature when the number of chirps in one minute is 100.

ⓒ Interpret the slope and T-intercept of the equation.

ⓓ Graph the equation.

Answer

ⓐ 40 degrees

ⓑ 65 degrees

ⓒ The slope, 14, means that the temperature Fahrenheit (F) increases 1 degree when the number of chirps, n, increases by 4. The T-intercept means that when the number of chirps is 0, the temperature is 40°.

ⓓ
The figure shows a line graphed on the x y-coordinate plane. The x-axis of the plane represents the variable n and runs from 10 to 140 The y-axis of the plane represents the variable T and runs from negative 5 to 75. The line begins at the point (0, 40) and goes through the point (100, 65).

Try It 4.99 §4.5 source ↗

Sam drives a delivery van. The equation C=0.5m+60 models the relation between his weekly cost, C, in dollars and the number of miles, m, that he drives.

ⓐ Find Sam’s cost for a week when he drives 0 miles.
ⓑ Find the cost for a week when he drives 250 miles.
ⓒ Interpret the slope and C-intercept of the equation.
ⓓ Graph the equation.

Answer

ⓐ $60

ⓑ $185

ⓒ The slope, 0.5, means that the weekly cost, C, increases by $0.50 when the number of miles driven, n, increases by 1. The C-intercept means that when the number of miles driven is 0, the weekly cost is $60

ⓓ
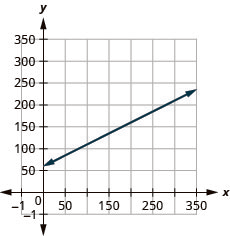
The figure shows a line graphed on the x y-coordinate plane. The x-axis of the plane represents the variable m and runs from negative 10 to 400. The y-axis of the plane represents the variable C and runs from negative 10 to 300. The line begins at the point (0, 65) and goes through the point (250, 185).

Try It 4.100 §4.5 source ↗

Loreen has a calligraphy business. The equation C=1.8n+35 models the relation between her weekly cost, C, in dollars and the number of wedding invitations, n, that she writes.

ⓐ Find Loreen’s cost for a week when she writes no invitations.

ⓑ Find the cost for a week when she writes 75 invitations.

ⓒ Interpret the slope and C-intercept of the equation.

ⓓ Graph the equation.

Answer

ⓐ $35

ⓑ $170

ⓒ The slope, 1.8, means that the weekly cost, C, increases by $1.80 when the number of invitations, n, increases by 1.
The C-intercept means that when the number of invitations is 0, the weekly cost is $35.;

ⓓ
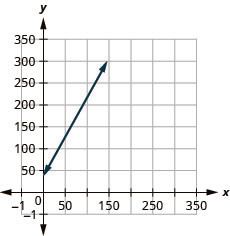
The figure shows a line graphed on the x y-coordinate plane. The x-axis of the plane represents the variable n and runs from negative 10 to 400. The y-axis of the plane represents the variable C and runs from negative 10 to 300. The line begins at the point (0, 35) and goes through the point (75, 170).

Try It 4.101 §4.5 source ↗

Use slopes and y-intercepts to determine if the lines 2x+ 5y= 5andy= − 25x− 4 are parallel.

Answer

parallel

Try It 4.102 §4.5 source ↗

Use slopes and y-intercepts to determine if the lines 4x− 3y= 6andy= 43x− 1 are parallel.

Answer

parallel

Try It 4.103 §4.5 source ↗

Use slopes and y-intercepts to determine if the lines y=8andy=−6 are parallel.

Answer

parallel

Try It 4.104 §4.5 source ↗

Use slopes and y-intercepts to determine if the lines y=1andy=−5 are parallel.

Answer

parallel

Try It 4.105 §4.5 source ↗

Use slopes and y-intercepts to determine if the lines x=1 and x=−5 are parallel.

Answer

parallel

Try It 4.106 §4.5 source ↗

Use slopes and y-intercepts to determine if the lines x=8 and x=−6 are parallel.

Answer

parallel

Try It 4.107 §4.5 source ↗

Use slopes and y-intercepts to determine if the lines y=−12x−1 and x+2y=2 are parallel.

Answer

parallel

Try It 4.108 §4.5 source ↗

Use slopes and y-intercepts to determine if the lines y=34x−3 and 3x−4y=12 are parallel.

Answer

not parallel; same line

Try It 4.109 §4.5 source ↗

Use slopes to determine if the lines y=−3x+2 and x−3y=4 are perpendicular.

Answer

perpendicular

Try It 4.110 §4.5 source ↗

Use slopes to determine if the lines y=2x−5 and x+2y=−6 are perpendicular.

Answer

perpendicular

Try It 4.111 §4.5 source ↗

Use slopes to determine if the lines 5x+4y=1 and 4x+5y=3 are perpendicular.

Answer

not perpendicular

Try It 4.112 §4.5 source ↗

Use slopes to determine if the lines 2x−9y=3 and 9x−2y=1 are perpendicular.

Answer

not perpendicular

4.5-289 §4.5 source ↗

Recognize the Relation Between the Graph and the Slope–Intercept Form of an Equation of a Line

In the following exercises, use the graph to find the slope and y-intercept of each line. Compare the values to the equation y=mx+b.

The figure shows a line graphed on the x y-coordinate plane. The x-axis of the plane runs from negative 10 to 10. The y-axis of the plane runs from negative 10 to 10. The line goes through the points (0, negative 2) and (1,2).

y = 4 x − 2

Answer

slope m=4 and y-intercept (0,−2)

4.5-291 §4.5 source ↗

Recognize the Relation Between the Graph and the Slope–Intercept Form of an Equation of a Line

In the following exercises, use the graph to find the slope and y-intercept of each line. Compare the values to the equation y=mx+b.

The figure shows a line graphed on the x y-coordinate plane. The x-axis of the plane runs from negative 10 to 10. The y-axis of the plane runs from negative 10 to 10. The line goes through the points (0,1) and (1, negative 2).

y = −3 x + 1

Answer

slope m=−3 and y-intercept (0,1)

4.5-293 §4.5 source ↗

Recognize the Relation Between the Graph and the Slope–Intercept Form of an Equation of a Line

In the following exercises, use the graph to find the slope and y-intercept of each line. Compare the values to the equation y=mx+b.

The figure shows a line graphed on the x y-coordinate plane. The x-axis of the plane runs from negative 10 to 10. The y-axis of the plane runs from negative 10 to 10. The line goes through the points (0,3) and (1,5).

y = − 2 5 x + 3

Answer

slope m=−25 and y-intercept (0,3)

4.5-295 §4.5 source ↗

Identify the Slope and y-Intercept From an Equation of a Line

In the following exercises, identify the slope and y-intercept of each line.

y = −9 x + 7

Answer

−9 ; ( 0 , 7 )

4.5-297 §4.5 source ↗

Identify the Slope and y-Intercept From an Equation of a Line

In the following exercises, identify the slope and y-intercept of each line.

y = 4 x − 10

Answer

4 ; ( 0 , −10 )

4.5-299 §4.5 source ↗

Identify the Slope and y-Intercept From an Equation of a Line

In the following exercises, identify the slope and y-intercept of each line.

4 x + y = 8

Answer

−4 ; ( 0 , 8 )

4.5-301 §4.5 source ↗

Identify the Slope and y-Intercept From an Equation of a Line

In the following exercises, identify the slope and y-intercept of each line.

8 x + 3 y = 12

Answer

− 8 3 ; ( 0 , 4 )

4.5-303 §4.5 source ↗

Identify the Slope and y-Intercept From an Equation of a Line

In the following exercises, identify the slope and y-intercept of each line.

7 x − 3 y = 9

Answer

7 3 ; ( 0 , −3 )

4.5-305 §4.5 source ↗

Graph a Line Using Its Slope and Intercept

In the following exercises, graph the line of each equation using its slope and y-intercept.

y = x + 4

Answer

The figure shows a line graphed on the x y-coordinate plane. The x-axis of the plane runs from negative 10 to 10. The y-axis of the plane runs from negative 10 to 10. The line goes through the points (0, 4) and (1, 5).

4.5-307 §4.5 source ↗

Graph a Line Using Its Slope and Intercept

In the following exercises, graph the line of each equation using its slope and y-intercept.

y = 2 x − 3

Answer

The figure shows a line graphed on the x y-coordinate plane. The x-axis of the plane runs from negative 10 to 10. The y-axis of the plane runs from negative 10 to 10. The line goes through the points (0, negative 3) and (1, negative 1).

4.5-309 §4.5 source ↗

Graph a Line Using Its Slope and Intercept

In the following exercises, graph the line of each equation using its slope and y-intercept.

y = − x + 3

Answer

The figure shows a line graphed on the x y-coordinate plane. The x-axis of the plane runs from negative 10 to 10. The y-axis of the plane runs from negative 10 to 10. The line goes through the points (0, 3) and (1, 2).

4.5-311 §4.5 source ↗

Graph a Line Using Its Slope and Intercept

In the following exercises, graph the line of each equation using its slope and y-intercept.

y = − x − 2

Answer

The figure shows a line graphed on the x y-coordinate plane. The x-axis of the plane runs from negative 10 to 10. The y-axis of the plane runs from negative 10 to 10. The line goes through the points (0, negative 2) and (1, negative 3).

4.5-313 §4.5 source ↗

Graph a Line Using Its Slope and Intercept

In the following exercises, graph the line of each equation using its slope and y-intercept.

y = − 2 5 x − 3

Answer

The figure shows a line graphed on the x y-coordinate plane. The x-axis of the plane runs from negative 10 to 10. The y-axis of the plane runs from negative 10 to 10. The line goes through the points (0, negative 3) and (5, negative 5).

4.5-315 §4.5 source ↗

Graph a Line Using Its Slope and Intercept

In the following exercises, graph the line of each equation using its slope and y-intercept.

y = − 2 3 x + 1

Answer

The figure shows a line graphed on the x y-coordinate plane. The x-axis of the plane runs from negative 10 to 10. The y-axis of the plane runs from negative 10 to 10. The line goes through the points (0,1) and (3, negative 1).

4.5-317 §4.5 source ↗

Graph a Line Using Its Slope and Intercept

In the following exercises, graph the line of each equation using its slope and y-intercept.

4 x − 3 y = 6

Answer

The figure shows a line graphed on the x y-coordinate plane. The x-axis of the plane runs from negative 10 to 10. The y-axis of the plane runs from negative 10 to 10. The line goes through the points (0, negative 2) and (3,2).

4.5-319 §4.5 source ↗

Graph a Line Using Its Slope and Intercept

In the following exercises, graph the line of each equation using its slope and y-intercept.

y = 0.3 x + 25

Answer

The figure shows a line graphed on the x y-coordinate plane. The x-axis of the plane runs from negative 10 to 10. The y-axis of the plane runs from negative 10 to 10. The line goes through the points (0, 25) and (negative 50, 10).

4.5-321 §4.5 source ↗

Choose the Most Convenient Method to Graph a Line

In the following exercises, determine the most convenient method to graph each line.

y = 4

Answer

horizontal line

4.5-323 §4.5 source ↗

Choose the Most Convenient Method to Graph a Line

In the following exercises, determine the most convenient method to graph each line.

x = −3

Answer

vertical line

4.5-325 §4.5 source ↗

Choose the Most Convenient Method to Graph a Line

In the following exercises, determine the most convenient method to graph each line.

y = −5 x + 2

Answer

slope–intercept

4.5-327 §4.5 source ↗

Choose the Most Convenient Method to Graph a Line

In the following exercises, determine the most convenient method to graph each line.

x − y = 1

Answer

intercepts

4.5-329 §4.5 source ↗

Choose the Most Convenient Method to Graph a Line

In the following exercises, determine the most convenient method to graph each line.

y = 4 5 x − 3

Answer

slope–intercept

4.5-331 §4.5 source ↗

Choose the Most Convenient Method to Graph a Line

In the following exercises, determine the most convenient method to graph each line.

y = −1

Answer

horizontal line

4.5-333 §4.5 source ↗

Choose the Most Convenient Method to Graph a Line

In the following exercises, determine the most convenient method to graph each line.

2 x − 5 y = −10

Answer

intercepts

4.5-335 §4.5 source ↗

Choose the Most Convenient Method to Graph a Line

In the following exercises, determine the most convenient method to graph each line.

y = − 1 3 x + 5

Answer

slope–intercept

4.5-337 §4.5 source ↗

Graph and Interpret Applications of Slope–Intercept

The equation P=28+2.54w models the relation between the amount of Randy’s monthly water bill payment, P, in dollars, and the number of units of water, w, used.

ⓐ Find the payment for a month when Randy used 0 units of water.

ⓑ Find the payment for a month when Randy used 15 units of water.

ⓒ Interpret the slope and P-intercept of the equation.

ⓓ Graph the equation.

Answer

ⓐ $28

ⓑ $66.10

ⓒ The slope, 2.54, means that Randy’s payment, P, increases by $2.54 when the number of units of water he used, w, increases by 1. The P–intercept means that if the number units of water Randy used was 0, the payment would be $28.

ⓓ
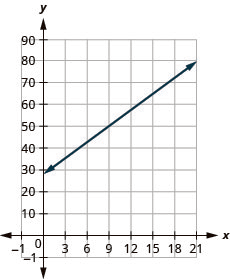
The figure shows a line graphed on the x y-coordinate plane. The x-axis of the plane represents the variable w and runs from negative 2 to 20. The y-axis of the plane represents the variable P and runs from negative 1 to 100. The line begins at the point (0, 28) and goes through the point (15, 66.1).

4.5-339 §4.5 source ↗

Graph and Interpret Applications of Slope–Intercept

Janelle is planning to rent a car while on vacation. The equation C=0.32m+15 models the relation between the cost in dollars, C, per day and the number of miles, m, she drives in one day.

ⓐ Find the cost if Janelle drives the car 0 miles one day.

ⓑ Find the cost on a day when Janelle drives the car 400 miles.

ⓒ Interpret the slope and C–intercept of the equation.

ⓓ Graph the equation.

Answer

ⓐ $15

ⓑ $143

ⓒ The slope, 0.32, means that the cost, C, increases by $0.32 when the number of miles driven, m, increases by 1. The C-intercept means that if Janelle drives 0 miles one day, the cost would be $15.

ⓓ
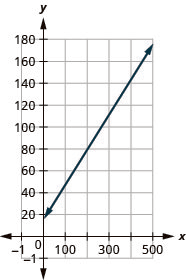
The figure shows a line graphed on the x y-coordinate plane. The x-axis of the plane represents the variable m and runs from negative 1 to 500. The y-axis of the plane represents the variable C and runs from negative 1 to 200. The line begins at the point (0,15) and goes through the point (400,143).

4.5-341 §4.5 source ↗

Graph and Interpret Applications of Slope–Intercept

Patel’s weekly salary includes a base pay plus commission on his sales. The equation S=750+0.09c models the relation between his weekly salary, S, in dollars and the amount of his sales, c, in dollars.

ⓐ Find Patel’s salary for a week when his sales were 0.

ⓑ Find Patel’s salary for a week when his sales were 18,540.

ⓒ Interpret the slope and S-intercept of the equation.

ⓓ Graph the equation.

Answer

ⓐ $750

ⓑ $2418.60

ⓒ The slope, 0.09, means that Patel’s salary, S, increases by $0.09 for every $1 increase in his sales. The S-intercept means that when his sales are $0, his salary is $750.

ⓓ
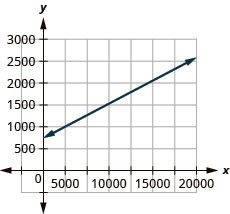
The figure shows a line graphed on the x y-coordinate plane. The x-axis of the plane represents the variable w and runs from negative 1 to 20000. The y-axis of the plane represents the variable P and runs from negative 1 to 3000. The line begins at the point (0, 750) and goes through the point (18540, 2415).

4.5-343 §4.5 source ↗

Graph and Interpret Applications of Slope–Intercept

Margie is planning a dinner banquet. The equation C=750+42g models the relation between the cost in dollars, C of the banquet and the number of guests, g.

ⓐ Find the cost if the number of guests is 50.

ⓑ Find the cost if the number of guests is 100.

ⓒ Interpret the slope and C–intercept of the equation.

ⓓ Graph the equation.

Answer

ⓐ $2850

ⓑ $4950

ⓒ The slope, 42, means that the cost, C, increases by $42 for when the number of guests increases by 1. The C-intercept means that when the number of guests is 0, the cost would be $750.

ⓓ
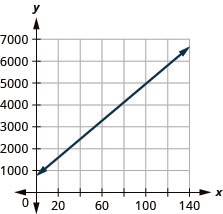
The figure shows a line graphed on the x y-coordinate plane. The x-axis of the plane represents the variable g and runs from negative 1 to 150. The y-axis of the plane represents the variable C and runs from negative 1 to 7000. The line begins at the point (0, 750) and goes through the point (100, 4950).

4.5-345 §4.5 source ↗

Use Slopes to Identify Parallel Lines

In the following exercises, use slopes and y-intercepts to determine if the lines are parallel.

y= 23x− 1; 2x− 3y= − 2

Answer

parallel

4.5-347 §4.5 source ↗

Use Slopes to Identify Parallel Lines

In the following exercises, use slopes and y-intercepts to determine if the lines are parallel.

3x− 4y= − 2; y= 34x− 3

Answer

parallel

4.5-349 §4.5 source ↗

Use Slopes to Identify Parallel Lines

In the following exercises, use slopes and y-intercepts to determine if the lines are parallel.

6x− 3y= 9; 2x− y= 3

Answer

not parallel

4.5-351 §4.5 source ↗

Use Slopes to Identify Parallel Lines

In the following exercises, use slopes and y-intercepts to determine if the lines are parallel.

8x+ 6y= 6; 12x+ 9y= 12

Answer

parallel

4.5-353 §4.5 source ↗

Use Slopes to Identify Parallel Lines

In the following exercises, use slopes and y-intercepts to determine if the lines are parallel.

x=7;x=−8

Answer

parallel

4.5-355 §4.5 source ↗

Use Slopes to Identify Parallel Lines

In the following exercises, use slopes and y-intercepts to determine if the lines are parallel.

x=−3;x=−2

Answer

parallel

4.5-357 §4.5 source ↗

Use Slopes to Identify Parallel Lines

In the following exercises, use slopes and y-intercepts to determine if the lines are parallel.

y=5;y=1

Answer

parallel

4.5-359 §4.5 source ↗

Use Slopes to Identify Parallel Lines

In the following exercises, use slopes and y-intercepts to determine if the lines are parallel.

y=−1;y=2

Answer

parallel

4.5-361 §4.5 source ↗

Use Slopes to Identify Parallel Lines

In the following exercises, use slopes and y-intercepts to determine if the lines are parallel.

4x+ 4y= 8; x+ y= 2

Answer

not parallel

4.5-363 §4.5 source ↗

Use Slopes to Identify Parallel Lines

In the following exercises, use slopes and y-intercepts to determine if the lines are parallel.

5x− 2y= 11; 5x− y= 7

Answer

not parallel

4.5-365 §4.5 source ↗

Use Slopes to Identify Parallel Lines

In the following exercises, use slopes and y-intercepts to determine if the lines are parallel.

4x− 8y= 16; x− 2y= 4

Answer

not parallel

4.5-367 §4.5 source ↗

Use Slopes to Identify Parallel Lines

In the following exercises, use slopes and y-intercepts to determine if the lines are parallel.

x− 5y= 10; 5x− y= − 10

Answer

not parallel

4.5-369 §4.5 source ↗

Use Slopes to Identify Parallel Lines

In the following exercises, use slopes and y-intercepts to determine if the lines are parallel.

9x− 5y= 4; 5x+ 9y= − 1

Answer

not parallel

4.5-371 §4.5 source ↗

Use Slopes to Identify Perpendicular Lines

In the following exercises, use slopes and y-intercepts to determine if the lines are perpendicular.

x− 4y= 8; 4x+ y= 2

Answer

perpendicular

4.5-373 §4.5 source ↗

Use Slopes to Identify Perpendicular Lines

In the following exercises, use slopes and y-intercepts to determine if the lines are perpendicular.

2x+ 3y= 5; 3x− 2y= 7

Answer

perpendicular

4.5-375 §4.5 source ↗

Use Slopes to Identify Perpendicular Lines

In the following exercises, use slopes and y-intercepts to determine if the lines are perpendicular.

3x− 4y= 8; 4x− 3y= 6

Answer

not perpendicular

4.5-377 §4.5 source ↗

Use Slopes to Identify Perpendicular Lines

In the following exercises, use slopes and y-intercepts to determine if the lines are perpendicular.

2x+ 4y= 3; 6x+ 3y= 2

Answer

not perpendicular

4.5-379 §4.5 source ↗

Use Slopes to Identify Perpendicular Lines

In the following exercises, use slopes and y-intercepts to determine if the lines are perpendicular.

2x− 6y= 4; 12x+ 4y= 9

Answer

perpendicular

4.5-381 §4.5 source ↗

Use Slopes to Identify Perpendicular Lines

In the following exercises, use slopes and y-intercepts to determine if the lines are perpendicular.

8x− 2y= 7; 3x+ 12y= 9

Answer

perpendicular

4.5-383 §4.5 source ↗

Use Slopes to Identify Perpendicular Lines

In the following exercises, use slopes and y-intercepts to determine if the lines are perpendicular.

The equation n=4T−160 is used to estimate the number of cricket chirps, n, in one minute based on the temperature in degrees Fahrenheit, T.

ⓐ Explain what the slope of the equation means.

ⓑ Explain what the n–intercept of the equation means. Is this a realistic situation?

Answer

ⓐ For every increase of one degree Fahrenheit, the number of chirps increases by four.

ⓑ There would be −160 chirps when the Fahrenheit temperature is 0°. (Notice that this does not make sense; this model cannot be used for all possible temperatures.)

4.5-385 §4.5 source ↗

Use Slopes to Identify Perpendicular Lines

In the following exercises, use slopes and y-intercepts to determine if the lines are perpendicular.

Why are all horizontal lines parallel?

Answer

Answers will vary.

Be Prepared 4.13 §4.6 source ↗

Solve: 23=x5.
If you missed this problem, review Example 2.14.
Example 2.14 in the book ↗

Answer

x = 10 3

Be Prepared 4.14 §4.6 source ↗

Simplify: −25(x−15).
If you missed this problem, review Example 1.133.
Example 1.133 in the book ↗

Answer

− 2 5 x + 6

Try It 4.113 §4.6 source ↗

Find an equation of a line with slope 25 and y-intercept (0,4).

Answer

y = 2 5 x + 4

Try It 4.114 §4.6 source ↗

Find an equation of a line with slope −1 and y-intercept (0,−3).

Answer

y = − x − 3

Try It 4.115 §4.6 source ↗

Find the equation of the line shown in the graph.
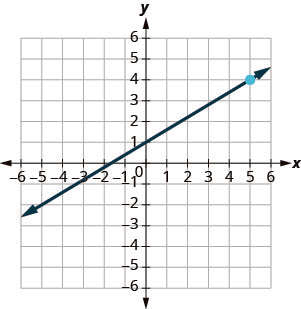
The graph shows the x y-coordinate plane. The x and y-axes each run from negative 7 to 7. A line intercepts the x-axis at (negative 2, 0), intercepts the y-axis at (0, 1) and passes through the plotted point (5, 4).

Answer

y = 3 5 x + 1

Try It 4.116 §4.6 source ↗

Find the equation of the line shown in the graph.
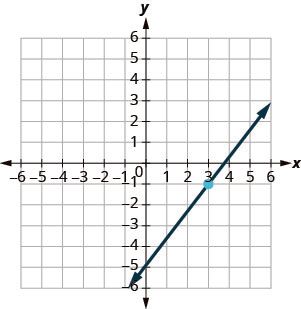
The graph shows the x y-coordinate plane. The x and y-axes each run from negative 7 to 7. A line intercepts the y-axis at (0, negative 5), passes through the plotted point (3, negative 1), and intercepts the x-axis at (15 fourths, 0).

Answer

y = 4 3 x − 5

Try It 4.117 §4.6 source ↗

Find an equation of a line with slope m=56 and containing the point (6,3).

Answer

y = 5 6 x − 2

Try It 4.118 §4.6 source ↗

Find an equation of a line with slope m=23 and containing the point (9,2).

Answer

y = 2 3 x − 4

Try It 4.119 §4.6 source ↗

Find an equation of a line with slope m=−25 and containing the point (10,−5).

Answer

y = − 2 5 x − 1

Try It 4.120 §4.6 source ↗

Find an equation of a line with slope m=−34, and containing the point (4,−7).

Answer

y = − 3 4 x − 4

Try It 4.121 §4.6 source ↗

Find an equation of a horizontal line containing the point (−3,8).

Answer

y = 8

Try It 4.122 §4.6 source ↗

Find an equation of a horizontal line containing the point (−1,4).

Answer

y = 4

Try It 4.123 §4.6 source ↗

Find an equation of a line containing the points (3,1) and (5,6).

Answer

y = 5 2 x − 13 2

Try It 4.124 §4.6 source ↗

Find an equation of a line containing the points (1,4) and (6,2).

Answer

y = − 2 5 x + 22 5

Try It 4.125 §4.6 source ↗

Find an equation of a line containing the points (−2,−4) and (1,−3).

Answer

y = 1 3 x − 10 3

Try It 4.126 §4.6 source ↗

Find an equation of a line containing the points (−4,−3) and (1,−5).

Answer

y = − 2 5 x − 23 5

Try It 4.127 §4.6 source ↗

Find an equation of a line containing the points (5,1) and (5,−4).

Answer

x = 5

Try It 4.128 §4.6 source ↗

Find an equaion of a line containing the points (−4,4) and (−4,3).

Answer

x = −4

Try It 4.129 §4.6 source ↗

Find an equation of a line parallel to the line y=3x+1 that contains the point (4,2). Write the equation in slope–intercept form.

Answer

y = 3 x − 10

Try It 4.130 §4.6 source ↗

Find an equation of a line parallel to the line y=12x−3 that contains the point (6,4).

Answer

y = 1 2 x + 1

Try It 4.131 §4.6 source ↗

Find an equation of a line perpendicular to the line y=3x+1 that contains the point (4,2). Write the equation in slope–intercept form.

Answer

y = − 1 3 x + 10 3

Try It 4.132 §4.6 source ↗

Find an equation of a line perpendicular to the line y=12x−3 that contains the point (6,4).

Answer

y = −2 x + 16

Try It 4.133 §4.6 source ↗

Find an equation of a line that is perpendicular to the line x=4 that contains the point (4,−5). Write the equation in slope–intercept form.

Answer

y = −5

Try It 4.134 §4.6 source ↗

Find an equation of a line that is perpendicular to the line x=2 that contains the point (2,−1). Write the equation in slope–intercept form.

Answer

y = −1

Try It 4.135 §4.6 source ↗

Find an equation of a line that is perpendicular to the line y=1 that contains the point (−5,1). Write the equation in slope–intercept form.

Answer

x = −5

Try It 4.136 §4.6 source ↗

Find an equation of a line that is perpendicular to the line y=−5 that contains the point (−4,−5).

Answer

x = −4

4.6-387 §4.6 source ↗

Find an Equation of the Line Given the Slope and y-Intercept

In the following exercises, find the equation of a line with given slope and y-intercept. Write the equation in slope–intercept form.

slope 4 and y-intercept (0,1)

Answer

y = 4 x + 1

4.6-389 §4.6 source ↗

Find an Equation of the Line Given the Slope and y-Intercept

In the following exercises, find the equation of a line with given slope and y-intercept. Write the equation in slope–intercept form.

slope 8 and y-intercept (0,−6)

Answer

y = 8 x − 6

4.6-391 §4.6 source ↗

Find an Equation of the Line Given the Slope and y-Intercept

In the following exercises, find the equation of a line with given slope and y-intercept. Write the equation in slope–intercept form.

slope −1 and y-intercept (0,7)

Answer

y = − x + 7

4.6-393 §4.6 source ↗

Find an Equation of the Line Given the Slope and y-Intercept

In the following exercises, find the equation of a line with given slope and y-intercept. Write the equation in slope–intercept form.

slope −3 and y-intercept (0,−1)

Answer

y = −3 x − 1

4.6-395 §4.6 source ↗

Find an Equation of the Line Given the Slope and y-Intercept

In the following exercises, find the equation of a line with given slope and y-intercept. Write the equation in slope–intercept form.

slope 15 and y-intercept (0,−5)

Answer

y = 1 5 x − 5

4.6-397 §4.6 source ↗

Find an Equation of the Line Given the Slope and y-Intercept

In the following exercises, find the equation of a line with given slope and y-intercept. Write the equation in slope–intercept form.

slope −23 and y-intercept (0,−3)

Answer

y = − 2 3 x − 3

4.6-399 §4.6 source ↗

Find an Equation of the Line Given the Slope and y-Intercept

In the following exercises, find the equation of a line with given slope and y-intercept. Write the equation in slope–intercept form.

slope 0 and y-intercept (0,2)

Answer

y = 2

4.6-401 §4.6 source ↗

Find an Equation of the Line Given the Slope and y-Intercept

In the following exercises, find the equation of a line with given slope and y-intercept. Write the equation in slope–intercept form.

slope −4 and y-intercept (0,0)

Answer

y = −4 x

4.6-403 §4.6 source ↗

In the following exercises, find the equation of the line shown in each graph. Write the equation in slope–intercept form.
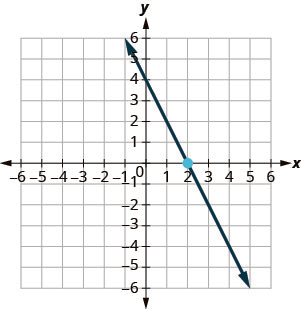
The graph shows the x y-coordinate plane. The x and y-axes each run from negative 9 to 9. The point (2, 0) is plotted. A line intercepts the y-axis at (0, 4) and intercepts the x-axis at (2, 0).

Answer

y = −2 x + 4

4.6-405 §4.6 source ↗

In the following exercises, find the equation of the line shown in each graph. Write the equation in slope–intercept form.
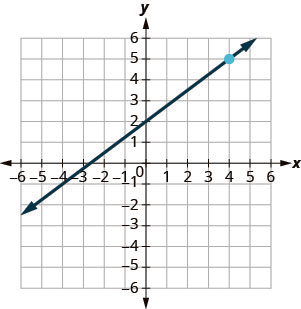
The graph shows the x y-coordinate plane. The x and y-axes each run from negative 9 to 9. The point (4, 5) is plotted. A line intercepts the x-axis at (negative 8 thirds, 0), intercepts the y-axis at (0, 2), and passes through the point (4, 5).

Answer

y = 3 4 x + 2

4.6-407 §4.6 source ↗

In the following exercises, find the equation of the line shown in each graph. Write the equation in slope–intercept form.
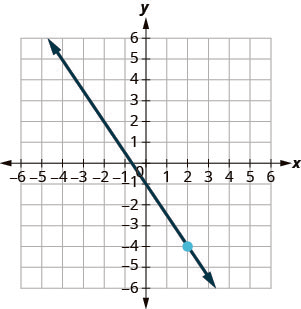
The graph shows the x y-coordinate plane. The x and y-axes each run from negative 9 to 9. The point (2, negative 4) is plotted. A line intercepts the x-axis at (negative 2 thirds, 0), intercepts the y-axis at (0, negative 1), and passes through the point (2, negative 4).

Answer

y = − 3 2 x − 1

4.6-409 §4.6 source ↗

In the following exercises, find the equation of the line shown in each graph. Write the equation in slope–intercept form.
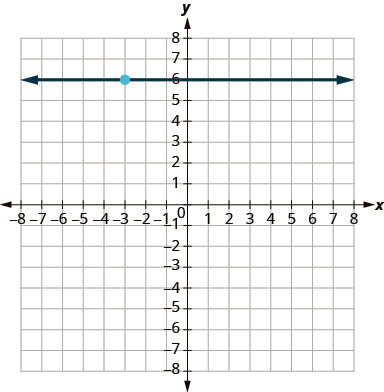
The graph shows the x y-coordinate plane. The x and y-axes each run from negative 9 to 9. The point (negative 3, 6) is plotted. A line running parallel to the x-axis passes through (negative 3, 6) and intercepts the y-axis at (0, 6).

Answer

y = 6

4.6-411 §4.6 source ↗

Find an Equation of the Line Given the Slope and a Point

In the following exercises, find the equation of a line with given slope and containing the given point. Write the equation in slope–intercept form.

m=38, point (8,2)

Answer

y = 3 8 x − 1

4.6-413 §4.6 source ↗

Find an Equation of the Line Given the Slope and a Point

In the following exercises, find the equation of a line with given slope and containing the given point. Write the equation in slope–intercept form.

m=56, point (6,7)

Answer

y = 5 6 x + 2

4.6-415 §4.6 source ↗

Find an Equation of the Line Given the Slope and a Point

In the following exercises, find the equation of a line with given slope and containing the given point. Write the equation in slope–intercept form.

m=−35, point (10,−5)

Answer

y = − 3 5 x + 1

4.6-417 §4.6 source ↗

Find an Equation of the Line Given the Slope and a Point

In the following exercises, find the equation of a line with given slope and containing the given point. Write the equation in slope–intercept form.

m=−13, point (−9,−8)

Answer

y = − 1 3 x − 11

4.6-419 §4.6 source ↗

Find an Equation of the Line Given the Slope and a Point

In the following exercises, find the equation of a line with given slope and containing the given point. Write the equation in slope–intercept form.

Horizontal line containing (−1,4)

Answer

y = 4

4.6-421 §4.6 source ↗

Find an Equation of the Line Given the Slope and a Point

In the following exercises, find the equation of a line with given slope and containing the given point. Write the equation in slope–intercept form.

Horizontal line containing (−1,−7)

Answer

y = −7

4.6-423 §4.6 source ↗

Find an Equation of the Line Given the Slope and a Point

In the following exercises, find the equation of a line with given slope and containing the given point. Write the equation in slope–intercept form.

m=−52, point (−8,−2)

Answer

y = − 5 2 x − 22

4.6-425 §4.6 source ↗

Find an Equation of the Line Given the Slope and a Point

In the following exercises, find the equation of a line with given slope and containing the given point. Write the equation in slope–intercept form.

m=−4, point (−2,−3)

Answer

y = −4 x − 11

4.6-427 §4.6 source ↗

Find an Equation of the Line Given the Slope and a Point

In the following exercises, find the equation of a line with given slope and containing the given point. Write the equation in slope–intercept form.

Horizontal line containing (4,−8)

Answer

y = −8

4.6-429 §4.6 source ↗

Find an Equation of the Line Given Two Points

In the following exercises, find the equation of a line containing the given points. Write the equation in slope–intercept form.

(3,1) and (2,5)

Answer

y = −4 x + 13

4.6-431 §4.6 source ↗

Find an Equation of the Line Given Two Points

In the following exercises, find the equation of a line containing the given points. Write the equation in slope–intercept form.

(2,7) and (3,8)

Answer

y = x + 5

4.6-433 §4.6 source ↗

Find an Equation of the Line Given Two Points

In the following exercises, find the equation of a line containing the given points. Write the equation in slope–intercept form.

(−5,−3) and (4,−6)

Answer

y = − 1 3 x − 14 3

4.6-435 §4.6 source ↗

Find an Equation of the Line Given Two Points

In the following exercises, find the equation of a line containing the given points. Write the equation in slope–intercept form.

(−2,8) and (−4,−6)

Answer

y = 7 x + 22

4.6-437 §4.6 source ↗

Find an Equation of the Line Given Two Points

In the following exercises, find the equation of a line containing the given points. Write the equation in slope–intercept form.

(3,−2) and (−4,4)

Answer

y = − 6 7 x + 4 7

4.6-439 §4.6 source ↗

Find an Equation of the Line Given Two Points

In the following exercises, find the equation of a line containing the given points. Write the equation in slope–intercept form.

(0,−2) and (−5,−3)

Answer

y = 1 5 x − 2

4.6-441 §4.6 source ↗

Find an Equation of the Line Given Two Points

In the following exercises, find the equation of a line containing the given points. Write the equation in slope–intercept form.

(4,2) and (4,−3)

Answer

x = 4

4.6-443 §4.6 source ↗

Find an Equation of the Line Given Two Points

In the following exercises, find the equation of a line containing the given points. Write the equation in slope–intercept form.

(−2,1) and (−2,−4)

Answer

x = −2

4.6-445 §4.6 source ↗

Find an Equation of the Line Given Two Points

In the following exercises, find the equation of a line containing the given points. Write the equation in slope–intercept form.

(6,2) and (−3,2)

Answer

y = 2

4.6-447 §4.6 source ↗

Find an Equation of the Line Given Two Points

In the following exercises, find the equation of a line containing the given points. Write the equation in slope–intercept form.

(−6,−3) and (−1,−3)

Answer

y = −3

4.6-449 §4.6 source ↗

Find an Equation of the Line Given Two Points

In the following exercises, find the equation of a line containing the given points. Write the equation in slope–intercept form.

(0,0) and (1,4)

Answer

y = 4 x

4.6-451 §4.6 source ↗

Find an Equation of the Line Given Two Points

In the following exercises, find the equation of a line containing the given points. Write the equation in slope–intercept form.

(−3,0) and (−7,−2)

Answer

y = 1 2 x + 3 2

4.6-453 §4.6 source ↗

Find an Equation of the Line Given Two Points

In the following exercises, find the equation of a line containing the given points. Write the equation in slope–intercept form.

(3,5) and (−7,5)

Answer

y = 5

4.6-455 §4.6 source ↗

Find an Equation of a Line Parallel to a Given Line

In the following exercises, find an equation of a line parallel to the given line and contains the given point. Write the equation in slope–intercept form.

line y=3x+4, point (2,5)

Answer

y = 3 x − 1

4.6-457 §4.6 source ↗

Find an Equation of a Line Parallel to a Given Line

In the following exercises, find an equation of a line parallel to the given line and contains the given point. Write the equation in slope–intercept form.

line y=−3x−1, point (2,−3)

Answer

y = −3 x + 3

4.6-459 §4.6 source ↗

Find an Equation of a Line Parallel to a Given Line

In the following exercises, find an equation of a line parallel to the given line and contains the given point. Write the equation in slope–intercept form.

line 2x−y=6, point (3,0)

Answer

y = 2 x − 6

4.6-461 §4.6 source ↗

Find an Equation of a Line Parallel to a Given Line

In the following exercises, find an equation of a line parallel to the given line and contains the given point. Write the equation in slope–intercept form.

line 2x+3y=6, point (0,5)

Answer

y = − 2 3 x + 5

4.6-463 §4.6 source ↗

Find an Equation of a Line Parallel to a Given Line

In the following exercises, find an equation of a line parallel to the given line and contains the given point. Write the equation in slope–intercept form.

line x=−4, point (−3,−5)

Answer

x = −3

4.6-465 §4.6 source ↗

Find an Equation of a Line Parallel to a Given Line

In the following exercises, find an equation of a line parallel to the given line and contains the given point. Write the equation in slope–intercept form.

line x−6=0, point (4,−3)

Answer

x = 4

4.6-467 §4.6 source ↗

Find an Equation of a Line Parallel to a Given Line

In the following exercises, find an equation of a line parallel to the given line and contains the given point. Write the equation in slope–intercept form.

line y=1, point (3,−4)

Answer

y = −4

4.6-469 §4.6 source ↗

Find an Equation of a Line Parallel to a Given Line

In the following exercises, find an equation of a line parallel to the given line and contains the given point. Write the equation in slope–intercept form.

line y+7=0, point (1,−1)

Answer

y = −1

4.6-471 §4.6 source ↗

Find an Equation of a Line Perpendicular to a Given Line

In the following exercises, find an equation of a line perpendicular to the given line and contains the given point. Write the equation in slope–intercept form.

line y=−x+5, point (3,3)

Answer

y = x

4.6-473 §4.6 source ↗

Find an Equation of a Line Perpendicular to a Given Line

In the following exercises, find an equation of a line perpendicular to the given line and contains the given point. Write the equation in slope–intercept form.

line y=23x−4, point (2,−4)

Answer

y = − 3 2 x − 1

4.6-475 §4.6 source ↗

Find an Equation of a Line Perpendicular to a Given Line

In the following exercises, find an equation of a line perpendicular to the given line and contains the given point. Write the equation in slope–intercept form.

line 4x−3y=5, point (−3,2)

Answer

y = − 3 4 x − 1 4

4.6-477 §4.6 source ↗

Find an Equation of a Line Perpendicular to a Given Line

In the following exercises, find an equation of a line perpendicular to the given line and contains the given point. Write the equation in slope–intercept form.

line 4x+5y=−3, point (0,0)

Answer

y = 5 4 x

4.6-479 §4.6 source ↗

Find an Equation of a Line Perpendicular to a Given Line

In the following exercises, find an equation of a line perpendicular to the given line and contains the given point. Write the equation in slope–intercept form.

line y−6=0, point (−5,−3)

Answer

x = −5

4.6-481 §4.6 source ↗

Find an Equation of a Line Perpendicular to a Given Line

In the following exercises, find an equation of a line perpendicular to the given line and contains the given point. Write the equation in slope–intercept form.

line y-axis, point (2,1)

Answer

y = 1

4.6-483 §4.6 source ↗

In the following exercises, find the equation of each line. Write the equation in slope–intercept form.

Containing the points (2,7) and (3,8)

Answer

y = x + 5

4.6-485 §4.6 source ↗

In the following exercises, find the equation of each line. Write the equation in slope–intercept form.

m=56, containing point (6,7)

Answer

y = 5 6 x + 2

4.6-487 §4.6 source ↗

In the following exercises, find the equation of each line. Write the equation in slope–intercept form.

Parallel to the line 2x+3y=6, containing point (0,5)

Answer

y = − 2 3 x + 5

4.6-489 §4.6 source ↗

In the following exercises, find the equation of each line. Write the equation in slope–intercept form.

m=−35, containing point (10,−5)

Answer

y = − 3 5 x + 1

4.6-491 §4.6 source ↗

In the following exercises, find the equation of each line. Write the equation in slope–intercept form.

Perpendicular to the line y-axis, point (−6,2)

Answer

y = 2

4.6-493 §4.6 source ↗

In the following exercises, find the equation of each line. Write the equation in slope–intercept form.

Containing the points (−2,0) and (−3,−2)

Answer

y = 2 x + 4

4.6-495 §4.6 source ↗

In the following exercises, find the equation of each line. Write the equation in slope–intercept form.

Parallel to the line x=−4, containing point (−3,−5)

Answer

x = −3

4.6-497 §4.6 source ↗

In the following exercises, find the equation of each line. Write the equation in slope–intercept form.

Containing the points (−5,−3) and (4,−6)

Answer

y = − 1 3 x − 14 3

4.6-499 §4.6 source ↗

In the following exercises, find the equation of each line. Write the equation in slope–intercept form.

Perpendicular to the line 4x+3y=1, containing point (0,0)

Answer

y = 3 4 x

4.6-501 §4.6 source ↗

In the following exercises, find the equation of each line. Write the equation in slope–intercept form.

Fuel consumption. The city mpg, x, and highway mpg, y, of two cars are given by the points (29,40) and(19,28). Find a linear equation that models the relationship between city mpg and highway mpg.

Answer

y = 1.2 x + 5.2

4.6-503 §4.6 source ↗

In the following exercises, find the equation of each line. Write the equation in slope–intercept form.

Explain in your own words why the slopes of two perpendicular lines must have opposite signs.

Answer

Answers will vary.

Be Prepared 4.15 §4.7 source ↗

Solve: 4x+3>23.
If you missed this problem, review Example 2.73.
Example 2.73 in the book ↗

Answer

x > 5

Be Prepared 4.16 §4.7 source ↗

Translate from algebra to English: x<5.
If you missed this problem, review Example 1.12.
Example 1.12 in the book ↗

Answer

x is less than 5.

Be Prepared 4.17 §4.7 source ↗

Evaluate 3x−2y when x=1, y=−2.
If you missed this problem, review Example 1.55.
Example 1.55 in the book ↗

Answer

7

Try It 4.137 §4.7 source ↗

Determine whether each ordered pair is a solution to the inequality y>x−3:

ⓐ (0,0) ⓑ (4,9) ⓒ (−2,1) ⓓ (−5,−3) ⓔ (5,1)

Answer

ⓐ yes ⓑ yes ⓒ yes ⓓ yes ⓔ no

Try It 4.138 §4.7 source ↗

Determine whether each ordered pair is a solution to the inequality y<x+1:

ⓐ (0,0) ⓑ (8,6) ⓒ (−2,−1) ⓓ (3,4) ⓔ (−1,−4)

Answer

ⓐ yes ⓑ yes ⓒ no ⓓ no ⓔ yes

Try It 4.139 §4.7 source ↗

Write the inequality shown by the graph with the boundary line y=−2x+3.

The graph shows the x y-coordinate plane. The x- and y-axes each run from negative 10 to 10. The line y equals negative 2 x plus 3 is plotted as a solid arrow extending from the top left toward the bottom right. The coordinate plane to the right of the line is shaded.

Answer

y ≥ −2 x + 3

Try It 4.140 §4.7 source ↗

Write the inequality shown by the graph with the boundary line y=12x−4.

The graph shows the x y-coordinate plane. The x- and y-axes each run from negative 10 to 10. The line y equals one half x minus 4 is plotted as a solid arrow extending from the bottom left toward the top right. The coordinate plane to the bottom right of the line is shaded.

Answer

y ≤ 1 2 x − 4

Try It 4.141 §4.7 source ↗

Write the inequality shown by the shaded region in the graph with the boundary line x−4y=8.

The graph shows the x y-coordinate plane. The x- and y-axes each run from negative 10 to 10. The line x minus 4 y equals 8 is plotted as a solid arrow extending from the bottom left toward the top right. The coordinate plane to the top of the line is shaded.The graph shows the x y-coordinate plane. The x- and y-axes each run from negative 10 to 10. The line x minus 4 y equals 8 is plotted as a solid arrow extending from the bottom left toward the top right. The coordinate plane to the top of the line is shaded.

Answer

x − 4 y ≤ 8

Try It 4.142 §4.7 source ↗

Write the inequality shown by the shaded region in the graph with the boundary line 3x−y=6.

The graph shows the x y-coordinate plane. The x- and y-axes each run from negative 10 to 10. The line 3 x minus y equals 6 is plotted as a solid arrow extending from the bottom left toward the top right. The coordinate plane to the right of the line is shaded.

Answer

3 x − y ≥ 6

Try It 4.143 §4.7 source ↗

Graph the linear inequality y>52x−4.

Answer

The graph shows the x y-coordinate plane. The x- and y-axes each run from negative 10 to 10. The line y equals five-halves x minus 4 is plotted as a solid arrow extending from the bottom left toward the top right. The region above the line is shaded.

Try It 4.144 §4.7 source ↗

Graph the linear inequality y<23x−5.

Answer

The graph shows the x y-coordinate plane. The x- and y-axes each run from negative 10 to 10. The line y equals two-thirds x minus 5 is plotted as a dashed arrow extending from the bottom left toward the top right. The region below the line is shaded.

Try It 4.145 §4.7 source ↗

Graph the linear inequality 2x−3y≤6.

Answer

The graph shows the x y-coordinate plane. The x- and y-axes each run from negative 10 to 10. The line 2 x minus 3 y equals 6 is plotted as a solid arrow extending from the bottom left toward the top right. The region above the line is shaded.

Try It 4.146 §4.7 source ↗

Graph the linear inequality 2x−y>3.

Answer

The graph shows the x y-coordinate plane. The x- and y-axes each run from negative 10 to 10. The line 2 x minus y equals 3 is plotted as a dashed arrow extending from the bottom left toward the top right. The region below the line is shaded.

Try It 4.147 §4.7 source ↗

Graph the linear inequality y>−3x.

Answer

The graph shows the x y-coordinate plane. The x- and y-axes each run from negative 10 to 10. The line y equals negative 3 x is plotted as a dashed arrow extending from the top left toward the bottom right. The region to the right of the line is shaded.

Try It 4.148 §4.7 source ↗

Graph the linear inequality y≥−2x.

Answer

The graph shows the x y-coordinate plane. The x- and y-axes each run from negative 10 to 10. The line y equals negative 2 x is plotted as a solid arrow extending from the top left toward the bottom right. The region to the right of the line is shaded.

Try It 4.149 §4.7 source ↗

Graph the linear inequality y<5.

Answer

The graph shows the x y-coordinate plane. The x- and y-axes each run from negative 10 to 10. The line y equals 5 is plotted as a dashed arrow horizontally across the plane. The region above the line is shaded.The graph shows the x y-coordinate plane. The x- and y-axes each run from negative 10 to 10. The line y equals 5 is plotted as a dashed arrow horizontally across the plane. The region above the line is shaded.

Try It 4.150 §4.7 source ↗

Graph the linear inequality y≤−1.

Answer

The graph shows the x y-coordinate plane. The x- and y-axes each run from negative 10 to 10. The line y equals negative 1 is plotted as a dashed arrow horizontally across the plane. The region below the line is shaded.

4.7-505 §4.7 source ↗

Verify Solutions to an Inequality in Two Variables

In the following exercises, determine whether each ordered pair is a solution to the given inequality.

Determine whether each ordered pair is a solution to the inequality y>x−3:

ⓐ (0,0)

ⓑ (2,1)

ⓒ (−1,−5)

ⓓ (−6,−3)

ⓔ (1,0)

Answer

ⓐ yes ⓑ yes ⓒ no ⓓ yes ⓔ yes

4.7-507 §4.7 source ↗

Verify Solutions to an Inequality in Two Variables

In the following exercises, determine whether each ordered pair is a solution to the given inequality.

Determine whether each ordered pair is a solution to the inequality y<x+5:

ⓐ (−3,0)

ⓑ (1,6)

ⓒ (−6,−2)

ⓓ (0,1)

ⓔ (5,−4)

Answer

ⓐ yes ⓑ no ⓒ yes ⓓ yes ⓔ yes

4.7-509 §4.7 source ↗

Verify Solutions to an Inequality in Two Variables

In the following exercises, determine whether each ordered pair is a solution to the given inequality.

Determine whether each ordered pair is a solution to the inequality x+y>2:

ⓐ (1,1)

ⓑ (4,−3)

ⓒ (0,0)

ⓓ (−8,12)

ⓔ (3,0)

Answer

ⓐ no ⓑ no ⓒ no ⓓ yes ⓔ yes

4.7-511 §4.7 source ↗

Recognize the Relation Between the Solutions of an Inequality and its Graph

In the following exercises, write the inequality shown by the shaded region.

Write the inequality shown by the graph with the boundary line y=2x−4.
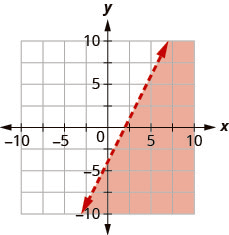
The graph shows the x y-coordinate plane. The x- and y-axes each run from negative 10 to 10. The line y equals 2x minus 4 is plotted as a solid line extending from the bottom left toward the top right. The region below the line is shaded.

Answer

y < 2 x − 4

4.7-513 §4.7 source ↗

Recognize the Relation Between the Solutions of an Inequality and its Graph

In the following exercises, write the inequality shown by the shaded region.

Write the inequality shown by the graph with the boundary line y=−13x−2.
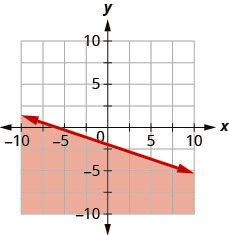
The graph shows the x y-coordinate plane. The x- and y-axes each run from negative 10 to 10. The line y equals negative one-third x minus 2 is plotted as a solid line extending from the top left toward the bottom right. The region below the line is shaded.

Answer

y ≤ − 1 3 x − 2

4.7-515 §4.7 source ↗

Recognize the Relation Between the Solutions of an Inequality and its Graph

In the following exercises, write the inequality shown by the shaded region.

Write the inequality shown by the shaded region in the graph with the boundary line x+y=3.
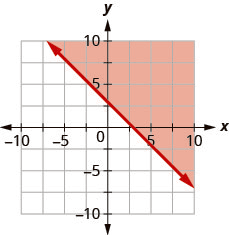
The graph shows the x y-coordinate plane. The x- and y-axes each run from negative 10 to 10. The line x plus y equals 3 is plotted as a solid line extending from the top left toward the bottom right. The region above the line is shaded.

Answer

x + y ≥ 3

4.7-517 §4.7 source ↗

Recognize the Relation Between the Solutions of an Inequality and its Graph

In the following exercises, write the inequality shown by the shaded region.

Write the inequality shown by the shaded region in the graph with the boundary line x+2y=−2.
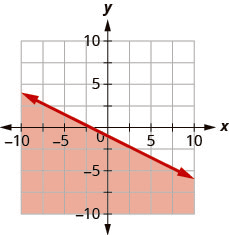
The graph shows the x y-coordinate plane. The x- and y-axes each run from negative 10 to 10. The line x plus 2 y equals negative 2 is plotted as a solid line extending from the top left toward the bottom right. The region below the line is shaded.

Answer

x + 2 y ≤ −2

4.7-519 §4.7 source ↗

Recognize the Relation Between the Solutions of an Inequality and its Graph

In the following exercises, write the inequality shown by the shaded region.

Write the inequality shown by the shaded region in the graph with the boundary line 2x−y=4.
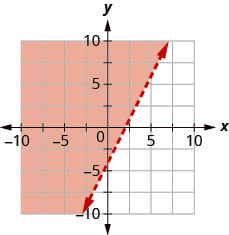
The graph shows the x y-coordinate plane. The x- and y-axes each run from negative 10 to 10. The line 2 x minus y equals 4 is plotted as a dashed line extending from the bottom left toward the top right. The region to the left of the line is shaded.The graph shows the x y-coordinate plane. The x- and y-axes each run from negative 10 to 10. The line 2 x minus y equals 4 is plotted as a dashed line extending from the bottom left toward the top right. The region to the left of the line is shaded.

Answer

2 x − y < 4

4.7-521 §4.7 source ↗

Recognize the Relation Between the Solutions of an Inequality and its Graph

In the following exercises, write the inequality shown by the shaded region.

Write the inequality shown by the shaded region in the graph with the boundary line 4x−3y=12.
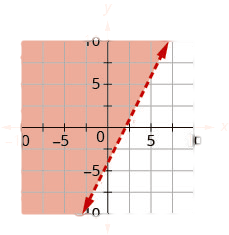
The graph shows the x y-coordinate plane. The x- and y-axes each run from negative 10 to 10. The line 4 x minus 3 y equals 12 is plotted as a dashed line extending from the bottom left toward the top right. The region below the line is shaded.

Answer

4 x − 3 y > 12

4.7-523 §4.7 source ↗

Graph Linear Inequalities

In the following exercises, graph each linear inequality.

Graph the linear inequality y<35x+2.

Answer

The graph shows the x y-coordinate plane. The x- and y-axes each run from negative 10 to 10. The line y equals three-fifths x plus 2 is plotted as a dashed line extending from the bottom left toward the top right. The region below the line is shaded.

4.7-525 §4.7 source ↗

Graph Linear Inequalities

In the following exercises, graph each linear inequality.

Graph the linear inequality y≥−13x−2.

Answer

The graph shows the x y-coordinate plane. The x- and y-axes each run from negative 10 to 10. The line y equals negative one-third x minus 2 is plotted as a solid line extending from the top left toward the bottom right. The region below the line is shaded.The graph shows the x y-coordinate plane. The x- and y-axes each run from negative 10 to 10. The line y equals negative one-third x minus 2 is plotted as a solid line extending from the top left toward the bottom right. The region below the line is shaded.

4.7-527 §4.7 source ↗

Graph Linear Inequalities

In the following exercises, graph each linear inequality.

Graph the linear inequality x−y≥−2.

Answer

The graph shows the x y-coordinate plane. The x- and y-axes each run from negative 10 to 10. The line x minus y equals negative 2 is plotted as a solid line extending from the bottom left toward the top right. The region below the line is shaded.

4.7-529 §4.7 source ↗

Graph Linear Inequalities

In the following exercises, graph each linear inequality.

Graph the linear inequality x+5y<−5.

Answer

The graph shows the x y-coordinate plane. The x- and y-axes each run from negative 10 to 10. The line x plus 5 y equals negative 5 is plotted as a dashed line extending from the top left toward the bottom right. The region below the line is shaded.

4.7-531 §4.7 source ↗

Graph Linear Inequalities

In the following exercises, graph each linear inequality.

Graph the linear inequality 4x+2y≥−8.

Answer

The graph shows the x y-coordinate plane. The x- and y-axes each run from negative 10 to 10. The line 4 x plus 2 y equals negative 8 is plotted as a solid line extending from the top left toward the bottom right. The region to the right of the line is shaded.The graph shows the x y-coordinate plane. The x- and y-axes each run from negative 10 to 10. The line 4 x plus 2 y equals negative 8 is plotted as a solid line extending from the top left toward the bottom right. The region to the right of the line is shaded.

4.7-533 §4.7 source ↗

Graph Linear Inequalities

In the following exercises, graph each linear inequality.

Graph the linear inequality y>x.

Answer

The graph shows the x y-coordinate plane. The x- and y-axes each run from negative 10 to 10. The line y equals x is plotted as a solid line extending from the bottom left toward the top right. The region above the line is shaded.

4.7-535 §4.7 source ↗

Graph Linear Inequalities

In the following exercises, graph each linear inequality.

Graph the linear inequality y≤−3x.

Answer

The graph shows the x y-coordinate plane. The x- and y-axes each run from negative 10 to 10. The line y equals negative 3 x is plotted as a solid line extending from the top left toward the bottom right. The region to the left of the line is shaded.

4.7-537 §4.7 source ↗

Graph Linear Inequalities

In the following exercises, graph each linear inequality.

Graph the linear inequality y<−1.

Answer

The graph shows the x y-coordinate plane. The x- and y-axes each run from negative 10 to 10. The line y equals negative 1 is plotted as a dashed horizontal line. The region below the line is shaded.

4.7-539 §4.7 source ↗

Graph Linear Inequalities

In the following exercises, graph each linear inequality.

Graph the linear inequality y≥2.

Answer

The graph shows the x y-coordinate plane. The x- and y-axes each run from negative 10 to 10. The line y equals 2 is plotted as a solid horizontal line. The region above the line is shaded.

4.7-541 §4.7 source ↗

Graph Linear Inequalities

In the following exercises, graph each linear inequality.

Graph the linear inequality x>−2.

Answer

The graph shows the x y-coordinate plane. The x- and y-axes each run from negative 10 to 10. The line x equals negative 2 is plotted as a dashed vertical line. The region to the right of the line is shaded.

4.7-543 §4.7 source ↗

Graph Linear Inequalities

In the following exercises, graph each linear inequality.

Graph the linear inequality x≤4.

Answer

The graph shows the x y-coordinate plane. The x- and y-axes each run from negative 10 to 10. The line x equals 4 is plotted as a solid vertical line. The region to the left of the line is shaded.The graph shows the x y-coordinate plane. The x- and y-axes each run from negative 10 to 10. The line x equals 4 is plotted as a solid vertical line. The region to the left of the line is shaded.

4.7-545 §4.7 source ↗

Graph Linear Inequalities

In the following exercises, graph each linear inequality.

Graph the linear inequality x−y<−3.

Answer

The graph shows the x y-coordinate plane. The x- and y-axes each run from negative 10 to 10. The line x minus y equals negative 3 is plotted as a dashed line extending from the bottom left toward the top right. The region above the line is shaded.

4.7-547 §4.7 source ↗

Graph Linear Inequalities

In the following exercises, graph each linear inequality.

Graph the linear inequality y≤54x.

Answer

The graph shows the x y-coordinate plane. The x- and y-axes each run from negative 10 to 10. The line y equals five-fourths x is plotted as a solid line extending from the bottom left toward the top right. The region below the line is shaded.

4.7-549 §4.7 source ↗

Graph Linear Inequalities

In the following exercises, graph each linear inequality.

Graph the linear inequality y<−3x−4.

Answer

The graph shows the x y-coordinate plane. The x- and y-axes each run from negative 10 to 10. The line y equals negative 3 x minus 4 is plotted as a dashed line extending from the top left toward the bottom right. The region to the left of the line is shaded.

4.7-551 §4.7 source ↗

Graph Linear Inequalities

In the following exercises, graph each linear inequality.

Graph the linear inequality x≥0.

Answer

The graph shows the x y-coordinate plane. The x- and y-axes each run from negative 10 to 10. The line x equals negative 0 is plotted as a solid vertical line along the y-axis. The region to the right of the line is shaded.

4.7-553 §4.7 source ↗

Graph Linear Inequalities

In the following exercises, graph each linear inequality.

Shopping. Tula has $20 to spend at the used book sale. Hardcover books cost $2 each and paperback books cost $0.50 each. If x is the number of hardcover books Tula can buy and y is the number of paperback books she can buy, the inequality 2x+12y≤20 models the situation.

ⓐ Graph the inequality.

ⓑ List three solutions to the inequality 2x+12y≤20 where both x and y are whole numbers.

Answer

ⓐ
The graph shows the x y-coordinate plane. The x- axis runs from 0 to 20 and the y-axis runs from 0 to 30. The line 2 x plus one-half y equals 20 is plotted as a solid line extending from the top left toward the bottom right. The region below the line is shaded.

ⓑ Answers will vary.

4.R-557 §4.R source ↗

Plot Points in a Rectangular Coordinate System

In the following exercises, plot each point in a rectangular coordinate system.

ⓐ (4,3)

ⓑ (−4,3)

ⓒ (−4,−3)

ⓓ (4,−3)

Answer

The graph shows the x y-coordinate plane. The x- and y-axes each run from negative 6 to 6. The point (4, 3) is plotted and labeled a. The point (negative 4, 3) is plotted and labeled b. The point (negative 4, negative 3) is plotted and labeled c. The point (4, negative 3) is plotted and labeled “d”.

4.R-559 §4.R source ↗

Plot Points in a Rectangular Coordinate System

In the following exercises, plot each point in a rectangular coordinate system.

ⓐ (2,32)

ⓑ (3,43)

ⓒ (13,−4)

ⓓ (12,−5)

Answer

The graph shows the x y-coordinate plane. The x- and y-axes each run from negative 6 to 6. The point (2, three halves) is plotted and labeled a. The point (3, four thirds) is plotted and labeled b. The point (one third, negative 4) is plotted and labeled c. The point (one-half, negative 5) is plotted and labeled “d”.

4.R-561 §4.R source ↗

Identify Points on a Graph

In the following exercises, name the ordered pair of each point shown in the rectangular coordinate system.

The graph shows the x y-coordinate plane. The x- and y-axes each run from negative 6 to 6. The point (2, 0) is plotted and labeled a. The point (0, negative 5) is plotted and labeled b. The point (negative 4, 0) is plotted and labeled c. The point (0, 3) is plotted and labeled “d”.

Answer

ⓐ (2,0) ⓑ (0,−5) ⓒ (−4.0) ⓓ (0,3)

4.R-563 §4.R source ↗

Verify Solutions to an Equation in Two Variables

In the following exercises, which ordered pairs are solutions to the given equations?

y = 6 x − 2

ⓐ (1,4)

ⓑ (13,0)

ⓒ (6,−2)

Answer

a, b

4.R-565 §4.R source ↗

Complete a Table of Solutions to a Linear Equation in Two Variables

In the following exercises, complete the table to find solutions to each linear equation.

y = − 1 2 x + 3

x y (x,y)
0
4
−2

Answer

x y (x,y)
0 3 (0,3)
4 1 (4, 1)
−2 4 (−2,4)

4.R-567 §4.R source ↗

Complete a Table of Solutions to a Linear Equation in Two Variables

In the following exercises, complete the table to find solutions to each linear equation.

3 x + 2 y = 6

x y (x,y)
0
0
−2

Answer

x y (x,y)
0 3 (0,3)
2 0 (2,0)
−2 6 (−2,6)

4.R-569 §4.R source ↗

Find Solutions to a Linear Equation in Two Variables

In the following exercises, find three solutions to each linear equation.

x + y = −4

Answer

Answers will vary.

4.R-571 §4.R source ↗

Find Solutions to a Linear Equation in Two Variables

In the following exercises, find three solutions to each linear equation.

y = − x − 1

Answer

Answers will vary.

4.R-573 §4.R source ↗

Recognize the Relation Between the Solutions of an Equation and its Graph

In the following exercises, for each ordered pair, decide:

y = 2 3 x − 1

ⓐ (0,−1)

ⓑ (3,1)

ⓒ (−3,−3)

ⓓ (6,4)

The graph shows the x y-coordinate plane. The x- and y-axes each run from negative 7 to 7. The line y equals two-thirds x minus 1 is plotted as an arrow extending from the bottom left toward the top right.

Answer

ⓐ yes; yes ⓑ yes; yes ⓒ yes; yes ⓓ no; no

4.R-575 §4.R source ↗

Graph a Linear Equation by Plotting Points

In the following exercises, graph by plotting points.

y = −3 x

Answer

The graph shows the x y-coordinate plane. The x- and y-axes each run from negative 7 to 7. The line y equals negative 3 x is plotted as an arrow extending from the top left toward the bottom right.

4.R-577 §4.R source ↗

Graph a Linear Equation by Plotting Points

In the following exercises, graph by plotting points.

x − y = 6

Answer

The graph shows the x y-coordinate plane. The x- and y-axes each run from negative 7 to 7. The line x minus y equals 6 is plotted as an arrow extending from the bottom left toward the top right.

4.R-579 §4.R source ↗

Graph a Linear Equation by Plotting Points

In the following exercises, graph by plotting points.

3 x − 2 y = 6

Answer

The graph shows the x y-coordinate plane. The x- and y-axes each run from negative 7 to 7. The line 3 x minus 2 y equals 6 is plotted as an arrow extending from the bottom left toward the top right.

4.R-581 §4.R source ↗

Graph Vertical and Horizontal lines

In the following exercises, graph each equation.

x = 3

Answer

The graph shows the x y-coordinate plane. The x- and y-axes each run from negative 7 to 7. The line x equals 3 is plotted as a vertical line.

4.R-583 §4.R source ↗

In the following exercises, graph each pair of equations in the same rectangular coordinate system.

y=43x and y=43

Answer

The graph shows the x y-coordinate plane. The x- and y-axes each run from negative 7 to 7. The line y equals four-thirds x is plotted as an arrow extending from the bottom left toward the top right. The line y equals four-thirds is plotted as a horizontal line.

4.R-585 §4.R source ↗

Identify the x- and y-Intercepts on a Graph

In the following exercises, find the x- and y-intercepts.

The graph shows the x y-coordinate plane. The x- and y-axes each run from negative 7 to 7. A line passing through the points (3, 0) and (0, 3) is plotted.

Answer

( 3 , 0 ) , ( 0 , 3 )

4.R-587 §4.R source ↗

Find the x- and y-Intercepts from an Equation of a Line

In the following exercises, find the intercepts of each equation.

x − y = −1

Answer

(−1,0), (0,1)

4.R-589 §4.R source ↗

Find the x- and y-Intercepts from an Equation of a Line

In the following exercises, find the intercepts of each equation.

2 x + 3 y = 12

Answer

( 6 , 0 ) , ( 0 , 4 )

4.R-591 §4.R source ↗

Find the x- and y-Intercepts from an Equation of a Line

In the following exercises, find the intercepts of each equation.

y = 3 x

Answer

( 0 , 0 )

4.R-593 §4.R source ↗

Graph a Line Using the Intercepts

In the following exercises, graph using the intercepts.

x + y = −2

Answer

The graph shows the x y-coordinate plane. The x- and y-axes each run from negative 7 to 7. The line x plus y equals negative 2 is plotted as an arrow extending from the top left toward the bottom right.

4.R-595 §4.R source ↗

Graph a Line Using the Intercepts

In the following exercises, graph using the intercepts.

2 x − y = 5

Answer

The graph shows the x y-coordinate plane. The x- and y-axes each run from negative 7 to 7. The line 2 x minus y equals 5 is plotted as an arrow extending from the bottom left toward the top right.

4.R-597 §4.R source ↗

Graph a Line Using the Intercepts

In the following exercises, graph using the intercepts.

y = 2 x

Answer

The graph shows the x y-coordinate plane. The x- and y-axes each run from negative 7 to 7. The line y equals 2 x is plotted as an arrow extending from the bottom left toward the top right.

4.R-599 §4.R source ↗

Use Geoboards to Model Slope

In the following exercises, find the slope modeled on each geoboard.

The figure shows a grid of evenly spaced dots. There are 5 rows and 5 columns. There is a rubber band style loop connecting the point in column 1 row 5 and the point in column 4 row 1.

Answer

4 3

4.R-601 §4.R source ↗

Use Geoboards to Model Slope

In the following exercises, find the slope modeled on each geoboard.

The figure shows a grid of evenly spaced dots. There are 5 rows and 5 columns. There is a rubber band style loop connecting the point in column 1 row 2 and the point in column 4 row 4.

Answer

− 2 3

4.R-603 §4.R source ↗

In the following exercises, model each slope. Draw a picture to show your results.

3 2

Answer

The figure shows a grid of evenly spaced dots. There are 5 rows and 5 columns. There is a rubber band style loop connecting the point in column 1 row 5 and the point in column 3 row 2.

4.R-605 §4.R source ↗

In the following exercises, model each slope. Draw a picture to show your results.

− 1 2

Answer

The figure shows a grid of evenly spaced dots. There are 5 rows and 5 columns. There is a rubber band style loop connecting the point in column 2 row 2 and the point in column 3 row 3.

4.R-607 §4.R source ↗

Use m=riserun to find the Slope of a Line from its Graph

In the following exercises, find the slope of each line shown.

The graph shows the x y-coordinate plane. The x- and y-axes each run from negative 7 to 7. A line passing through the points (negative 4, 0) and (0, 4) is plotted.

Answer

1

4.R-609 §4.R source ↗

Use m=riserun to find the Slope of a Line from its Graph

In the following exercises, find the slope of each line shown.

The graph shows the x y-coordinate plane. The x- and y-axes each run from negative 7 to 7. A line passing through the points (negative 3, 6) and (5, 2) is plotted.

Answer

− 1 2

4.R-611 §4.R source ↗

Find the Slope of Horizontal and Vertical Lines

In the following exercises, find the slope of each line.

x = 5

Answer

undefined

4.R-613 §4.R source ↗

Find the Slope of Horizontal and Vertical Lines

In the following exercises, find the slope of each line.

y = −1

Answer

0

4.R-615 §4.R source ↗

Use the Slope Formula to find the Slope of a Line between Two Points

In the following exercises, use the slope formula to find the slope of the line between each pair of points.

(3,5), (4,−1)

Answer

−6

4.R-617 §4.R source ↗

Use the Slope Formula to find the Slope of a Line between Two Points

In the following exercises, use the slope formula to find the slope of the line between each pair of points.

( 2 , 1 ) , ( 4 , 6 )

Answer

5 2

4.R-619 §4.R source ↗

Graph a Line Given a Point and the Slope

In the following exercises, graph each line with the given point and slope.

(−3,4); m=−13

Answer

The graph shows the x y-coordinate plane. The x- and y-axes each run from negative 7 to 7. A line passing through the points (negative 3, 4) and (0, 3) is plotted.

4.R-621 §4.R source ↗

Graph a Line Given a Point and the Slope

In the following exercises, graph each line with the given point and slope.

y-intercept 1; m=−34

Answer

The graph shows the x y-coordinate plane. The x- and y-axes each run from negative 7 to 7. A line passing through the points (0, 1) and (4, negative 2) is plotted.

4.R-623 §4.R source ↗

Solve Slope Applications

In the following exercises, solve these slope applications.

A mountain road rises 50 feet for a 500-foot run. What is its slope?

Answer

1 10

4.R-625 §4.R source ↗

Recognize the Relation Between the Graph and the Slope–Intercept Form of an Equation of a Line

In the following exercises, use the graph to find the slope and y-intercept of each line. Compare the values to the equation y=mx+b.

The graph shows the x y-coordinate plane. The x- and y-axes each run from negative 7 to 7. The line y equals two-thirds x plus 4 is plotted from the top left to the bottom right.

y = − 2 3 x + 4

Answer

slope m=−23 and y-intercept (0,4)

4.R-627 §4.R source ↗

Identify the Slope and y-Intercept from an Equation of a Line

In the following exercises, identify the slope and y-intercept of each line.

y = 5 3 x − 6

Answer

5 3 ; ( 0 , −6 )

4.R-629 §4.R source ↗

Identify the Slope and y-Intercept from an Equation of a Line

In the following exercises, identify the slope and y-intercept of each line.

4 x − 5 y = 8

Answer

4 5 ; ( 0 , − 8 5 )

4.R-631 §4.R source ↗

Graph a Line Using Its Slope and Intercept

In the following exercises, graph the line of each equation using its slope and y-intercept.

y = − x − 1

Answer

The graph shows the x y-coordinate plane. The x- and y-axes each run from negative 7 to 7. The line y equals negative x minus 1 is plotted from the top left to the bottom right.

4.R-633 §4.R source ↗

Graph a Line Using Its Slope and Intercept

In the following exercises, graph the line of each equation using its slope and y-intercept.

4 x − 3 y = 12

Answer

The graph shows the x y-coordinate plane. The x- and y-axes each run from negative 7 to 7. The line 4 x minus 3 y equals 12 is plotted from the bottom left to the top right.

4.R-635 §4.R source ↗

In the following exercises, determine the most convenient method to graph each line.

y = −3

Answer

horizontal line

4.R-637 §4.R source ↗

In the following exercises, determine the most convenient method to graph each line.

x − y = 2

Answer

intercepts

4.R-639 §4.R source ↗

In the following exercises, determine the most convenient method to graph each line.

y = 3 4 x − 1

Answer

plotting points

4.R-641 §4.R source ↗

Graph and Interpret Applications of Slope–Intercept

Marjorie teaches piano. The equation P=35s−250 models the relation between her weekly profit, P, in dollars and the number of student lessons, s, that she teaches.

ⓐ Find Marjorie’s profit for a week when she teaches no student lessons.

ⓑ Find the profit for a week when she teaches 20 student lessons.

ⓒ Interpret the slope and P–intercept of the equation.

ⓓ Graph the equation.

Answer

ⓐ −$250 ⓑ $450 ⓒ The slope, 35, means that Marjorie’s weekly profit, P, increases by $35 for each additional student lesson she teaches. The P–intercept means that when the number of lessons is 0, Marjorie loses $250. ⓓ

The graph shows the x y-coordinate plane where h is plotted along the x-axis and P is potted along the y-axis. The x-axis runs from 0 to 24. The y-axis runs from negative 300 to 500. The line P equals 35 h minus 250 is plotted from the bottom left to the top right.

4.R-643 §4.R source ↗

Use Slopes to Identify Parallel Lines

In the following exercises, use slopes and y-intercepts to determine if the lines are parallel.

2x− y= 8; x− 2y= 4

Answer

not parallel

4.R-645 §4.R source ↗

Use Slopes to Identify Perpendicular Lines

In the following exercises, use slopes and y-intercepts to determine if the lines are perpendicular.

3x− 2y= 5; 2x+ 3y= 6

Answer

perpendicular

4.R-647 §4.R source ↗

Find an Equation of the Line Given the Slope and y-Intercept

In the following exercises, find the equation of a line with given slope and y-intercept. Write the equation in slope–intercept form.

slope −5 and y-intercept (0,−3)

Answer

y = −5 x − 3

4.R-649 §4.R source ↗

Find an Equation of the Line Given the Slope and y-Intercept

In the following exercises, find the equation of a line with given slope and y-intercept. Write the equation in slope–intercept form.

slope −2 and y-intercept (0,0)

Answer

y = −2 x

4.R-651 §4.R source ↗

In the following exercises, find the equation of the line shown in each graph. Write the equation in slope–intercept form.

The graph shows the x y-coordinate plane. The x- and y-axes each run from negative 7 to 7. The line y equals negative 3 x plus 5 is plotted from the top left to the bottom right.

Answer

y = −3 x + 5

4.R-653 §4.R source ↗

In the following exercises, find the equation of the line shown in each graph. Write the equation in slope–intercept form.

The graph shows the x y-coordinate plane. The x- and y-axes each run from negative 7 to 7. The line y equals negative 4 is plotted as a horizontal line.

Answer

y = −4

4.R-655 §4.R source ↗

Find an Equation of the Line Given the Slope and a Point

In the following exercises, find the equation of a line with given slope and containing the given point. Write the equation in slope–intercept form.

m=35, point (10,6)

Answer

y = 3 5 x

4.R-657 §4.R source ↗

Find an Equation of the Line Given the Slope and a Point

In the following exercises, find the equation of a line with given slope and containing the given point. Write the equation in slope–intercept form.

m=−2, point (−1,−3)

Answer

y = −2 x − 5

4.R-659 §4.R source ↗

Find an Equation of the Line Given Two Points

In the following exercises, find the equation of a line containing the given points. Write the equation in slope–intercept form.

(7,1) and (5,0)

Answer

y = 1 2 x − 5 2

4.R-661 §4.R source ↗

Find an Equation of the Line Given Two Points

In the following exercises, find the equation of a line containing the given points. Write the equation in slope–intercept form.

(5,2) and (−1,2)

Answer

y = 2

4.R-663 §4.R source ↗

Find an Equation of a Line Parallel to a Given Line

In the following exercises, find an equation of a line parallel to the given line and contains the given point. Write the equation in slope–intercept form.

line 2x+5y=−10, point (10,4)

Answer

y = − 2 5 x + 8

4.R-665 §4.R source ↗

Find an Equation of a Line Parallel to a Given Line

In the following exercises, find an equation of a line parallel to the given line and contains the given point. Write the equation in slope–intercept form.

line y=−5, point (−4,3)

Answer

y = 3

4.R-667 §4.R source ↗

Find an Equation of a Line Perpendicular to a Given Line

In the following exercises, find an equation of a line perpendicular to the given line and contains the given point. Write the equation in slope–intercept form.

line 2x−3y=9, point (−4,0)

Answer

y = − 3 2 x − 6

4.R-669 §4.R source ↗

Find an Equation of a Line Perpendicular to a Given Line

In the following exercises, find an equation of a line perpendicular to the given line and contains the given point. Write the equation in slope–intercept form.

line x=−5 point (2,1)

Answer

y = 1

4.R-671 §4.R source ↗

Verify Solutions to an Inequality in Two Variables

In the following exercises, determine whether each ordered pair is a solution to the given inequality.

Determine whether each ordered pair is a solution to the inequality x+y>4:

ⓐ (6,1)

ⓑ (−3,6)

ⓒ (3,2)

ⓓ (−5,10)

ⓔ (0,0)

Answer

ⓐ yes ⓑ no ⓒ yes ⓓ yes ⓔ no

4.R-673 §4.R source ↗

Recognize the Relation Between the Solutions of an Inequality and its Graph

In the following exercises, write the inequality shown by the shaded region.

Write the inequality shown by the graph with the boundary line y=23x−3.

The graph shows the x y-coordinate plane. The x- and y-axes each run from negative 7 to 7. The line y equals two-thirds x minus 3 is plotted as a dashed line extending from the bottom left toward the top right. The region above the line is shaded.The graph shows the x y-coordinate plane. The x- and y-axes each run from negative 7 to 7. The line y equals two-thirds x minus 3 is plotted as a dashed line extending from the bottom left toward the top right. The region above the line is shaded.

Answer

y ≥ 2 3 x − 3

4.R-675 §4.R source ↗

Recognize the Relation Between the Solutions of an Inequality and its Graph

In the following exercises, write the inequality shown by the shaded region.

Write the inequality shown by the shaded region in the graph with the boundary line x−2y=6.
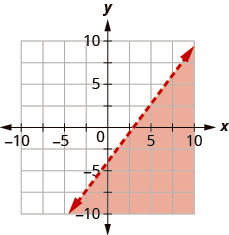
The graph shows the x y-coordinate plane. The x- and y-axes each run from negative 7 to 7. The line x minus 2 y equals 6 is plotted as a solid line extending from the bottom left toward the top right. The region below the line is shaded.

Answer

x − 2 y ≥ 6

4.R-677 §4.R source ↗

Graph Linear Inequalities

In the following exercises, graph each linear inequality.

Graph the linear inequality y<−14x+3.

Answer

The graph shows the x y-coordinate plane. The x- and y-axes each run from negative 7 to 7. The line y equals negative one-fourth x plus 3 is plotted as a solid line extending from the top left toward the bottom right. The region below the line is shaded.The graph shows the x y-coordinate plane. The x- and y-axes each run from negative 7 to 7. The line y equals negative one-fourth x plus 3 is plotted as a solid line extending from the top left toward the bottom right. The region below the line is shaded.

4.R-679 §4.R source ↗

Graph Linear Inequalities

In the following exercises, graph each linear inequality.

Graph the linear inequality 3x+2y>10.

Answer

The graph shows the x y-coordinate plane. The x- and y-axes each run from negative 7 to 7. The line 3 x plus 2 y equals 10 is plotted as a dashed line extending from the top left toward the bottom right. The region above the line is shaded.

4.R-681 §4.R source ↗

Graph Linear Inequalities

In the following exercises, graph each linear inequality.

Graph the linear inequality y<6.

Answer

The graph shows the x y-coordinate plane. The x- and y-axes each run from negative 7 to 7. The line y equals 6 is plotted as a dashed, horizontal line. The region below the line is shaded.The graph shows the x y-coordinate plane. The x- and y-axes each run from negative 7 to 7. The line y equals 6 is plotted as a dashed, horizontal line. The region below the line is shaded.

4.T-683 §4.T source ↗

Which of the given ordered pairs are solutions to the equation 3x−y=6?

ⓐ (3,3)

ⓑ (2,0)

ⓒ (4,−6)

Answer

ⓐ yes ⓑ yes ⓒ no

4.T-685 §4.T source ↗

Find the x- and y-intercepts of the equation 4x−3y=12.

Answer

(3,0), (0,−4)

4.T-687 §4.T source ↗

Find the slope of each line shown.

The graph shows the x y-coordinate plane. The x- and y-axes each run from negative 7 to 7. A vertical line passing through the point (2, 0) is plotted.

Answer

undefined

4.T-689 §4.T source ↗

Find the slope of each line shown.

Find the slope of the line between the points (5,2) and (−1,−4).

Answer

1

4.T-691 §4.T source ↗

Graph the line for each of the following equations.

y = 5 3 x − 1

Answer

The graph shows the x y-coordinate plane. The x- and y-axes each run from negative 7 to 7. The line y equals five-thirds x minus 1 is plotted. The line passes through the points (0, negative 1) and (three-fifths, 0).

4.T-693 §4.T source ↗

Graph the line for each of the following equations.

x − y = 2

Answer

The graph shows the x y-coordinate plane. The x- and y-axes each run from negative 7 to 7. The line x minus y equals 2 is plotted. The line passes through the points (0, negative 2) and (2, 0).

4.T-695 §4.T source ↗

Graph the line for each of the following equations.

y = 2

Answer

The graph shows the x y-coordinate plane. The x- and y-axes each run from negative 7 to 7. The line y equals 2 is plotted as a horizontal line passing through the point (0, 2).

4.T-697 §4.T source ↗

Find the equation of each line. Write the equation in slope–intercept form.
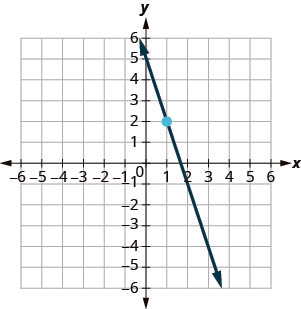
slope −34 and y-intercept (0,−2)

Answer

y = − 3 4 x − 2

4.T-699 §4.T source ↗

Find the equation of each line. Write the equation in slope–intercept form.
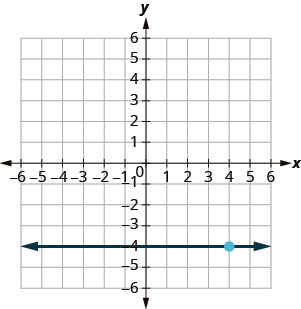
containing (10,1) and (6,−1)

Answer

y = 1 2 x − 4

4.T-701 §4.T source ↗

Find the equation of each line. Write the equation in slope–intercept form.

perpendicular to the line y=54x+2, containing the point (−10,3)

Answer

y = − 4 5 x − 5

4.T-703 §4.T source ↗

Graph each linear inequality.

y > 3 2 x + 5

Answer

The graph shows the x y-coordinate plane. The x- and y-axes each run from negative 7 to 7. The line y equals three-halves x plus 5 is plotted. The dashed line passes through the points (0, 5) and (2, 8).

4.T-705 §4.T source ↗

Graph each linear inequality.

y ≤ −5 x

Answer

The graph shows the x y-coordinate plane. The x- and y-axes each run from negative 7 to 7. The line y equals negative 5 x is plotted. The solid line passes through the points (0, 0) and (1, negative 5).

Loading chapter 5…

Problems and answers are adapted from Elementary Algebra 2e by Lynn Marecek and MaryAnne Anthony-Smith, OpenStax, and are used under the CC BY-NC-SA 4.0 licence. Access for free at https://openstax.org/books/elementary-algebra-2e/pages/1-introduction. Illustrations: Copyright Rice University, OpenStax, under CC BY-NC-SA 4.0 license. This adaptation is released under the same licence, is non-commercial, and is neither affiliated with nor endorsed by OpenStax or Rice University.