Every problem in the chapter beside the book’s answer, a chapter at a time as you scroll.
Chapter 4: Linear Functions
166 problems · 55 figuresTry It #1 §4.1 source ↗
Answer
Try It #2 §4.1 source ↗
Answer
Try It #3 §4.1 source ↗
Answer
Try It #4 §4.1 source ↗
A new plant food was introduced to a young tree to test its effect on the height of the tree. Table 2 shows the height of the tree, in feet, months since the measurements began. Write a linear function, where is the number of months since the start of the experiment.
| x | 0 | 2 | 4 | 8 | 12 |
| H(x) | 12.5 | 13.5 | 14.5 | 16.5 | 18.5 |
Answer
Try It #5 §4.1 source ↗
Answer
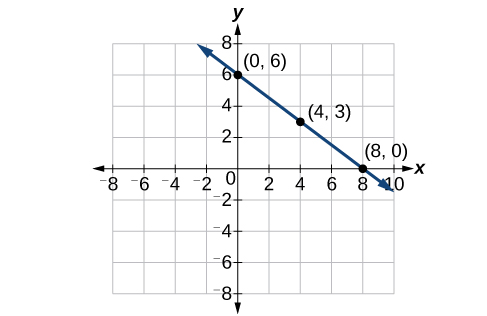
Try It #6 §4.1 source ↗
Answer
Try It #7 §4.1 source ↗
Answer
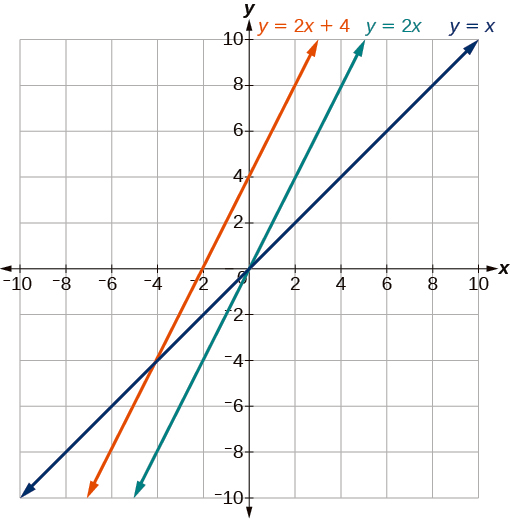
Try It #8 §4.1 source ↗
Answer
Try It #9 §4.1 source ↗
Given the function write an equation for the line passing through that is
ⓐparallel to
ⓑperpendicular to
Answer
ⓐ
ⓑ
Try It #10 §4.1 source ↗
Answer
4.1-1 §4.1 source ↗
Answer
4.1-3 §4.1 source ↗
Answer
4.1-5 §4.1 source ↗
Answer
4.1-7 §4.1 source ↗
For the following exercises, determine whether the equation of the curve can be written as a linear function.
Answer
4.1-9 §4.1 source ↗
For the following exercises, determine whether the equation of the curve can be written as a linear function.
Answer
4.1-11 §4.1 source ↗
For the following exercises, determine whether the equation of the curve can be written as a linear function.
Answer
4.1-13 §4.1 source ↗
For the following exercises, determine whether the equation of the curve can be written as a linear function.
Answer
4.1-15 §4.1 source ↗
For the following exercises, determine whether each function is increasing or decreasing.
Answer
4.1-17 §4.1 source ↗
For the following exercises, determine whether each function is increasing or decreasing.
Answer
4.1-19 §4.1 source ↗
For the following exercises, determine whether each function is increasing or decreasing.
Answer
4.1-21 §4.1 source ↗
For the following exercises, determine whether each function is increasing or decreasing.
Answer
4.1-23 §4.1 source ↗
For the following exercises, determine whether each function is increasing or decreasing.
Answer
4.1-25 §4.1 source ↗
For the following exercises, find the slope of the line that passes through the two given points.
and
Answer
4.1-27 §4.1 source ↗
For the following exercises, find the slope of the line that passes through the two given points.
and
Answer
4.1-29 §4.1 source ↗
For the following exercises, given each set of information, find a linear equation satisfying the conditions, if possible.
and
Answer
4.1-31 §4.1 source ↗
For the following exercises, given each set of information, find a linear equation satisfying the conditions, if possible.
Passes through and
Answer
4.1-33 §4.1 source ↗
For the following exercises, given each set of information, find a linear equation satisfying the conditions, if possible.
Passes through and
Answer
4.1-35 §4.1 source ↗
For the following exercises, given each set of information, find a linear equation satisfying the conditions, if possible.
x intercept at and y intercept at
Answer
4.1-37 §4.1 source ↗
For the following exercises, determine whether the lines given by the equations below are parallel, perpendicular, or neither.
Answer
4.1-39 §4.1 source ↗
For the following exercises, determine whether the lines given by the equations below are parallel, perpendicular, or neither.
Answer
4.1-41 §4.1 source ↗
For the following exercises, find the x- and y-intercepts of each equation.
Answer
4.1-43 §4.1 source ↗
For the following exercises, find the x- and y-intercepts of each equation.
Answer
4.1-45 §4.1 source ↗
For the following exercises, find the x- and y-intercepts of each equation.
Answer
4.1-47 §4.1 source ↗
For the following exercises, use the descriptions of each pair of lines given below to find the slopes of Line 1 and Line 2. Is each pair of lines parallel, perpendicular, or neither?
Line 1: Passes through and
Line 2: Passes through and
Answer
4.1-49 §4.1 source ↗
For the following exercises, use the descriptions of each pair of lines given below to find the slopes of Line 1 and Line 2. Is each pair of lines parallel, perpendicular, or neither?
Line 1: Passes through and
Line 2: Passes through and
Answer
4.1-51 §4.1 source ↗
For the following exercises, use the descriptions of each pair of lines given below to find the slopes of Line 1 and Line 2. Is each pair of lines parallel, perpendicular, or neither?
Line 1: Passes through and
Line 2: Passes through and
Answer
4.1-53 §4.1 source ↗
For the following exercises, write an equation for the line described.
Write an equation for a line parallel to and passing through the point
Answer
4.1-55 §4.1 source ↗
For the following exercises, write an equation for the line described.
Write an equation for a line perpendicular to and passing through the point
Answer
4.1-57 §4.1 source ↗
For the following exercises, find the slope of the line graphed.
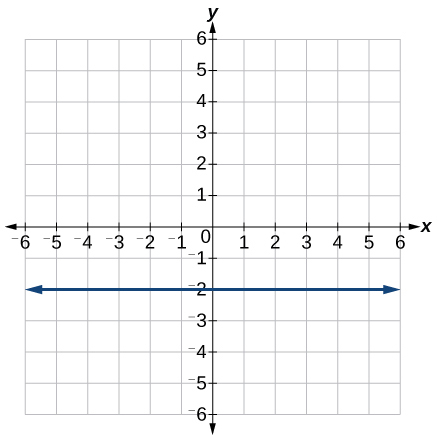
Answer
4.1-59 §4.1 source ↗
For the following exercises, write an equation for the line graphed.
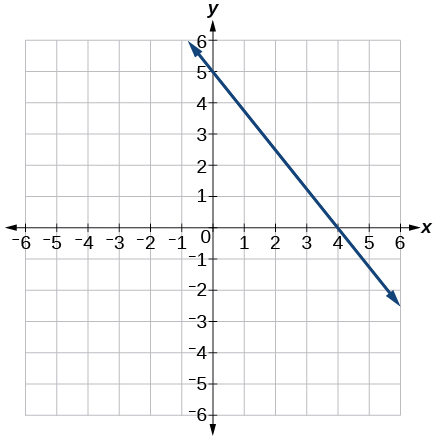
Answer
4.1-61 §4.1 source ↗
For the following exercises, write an equation for the line graphed.
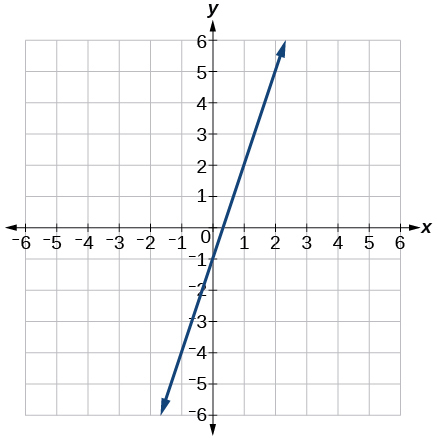
Answer
4.1-63 §4.1 source ↗
For the following exercises, write an equation for the line graphed.
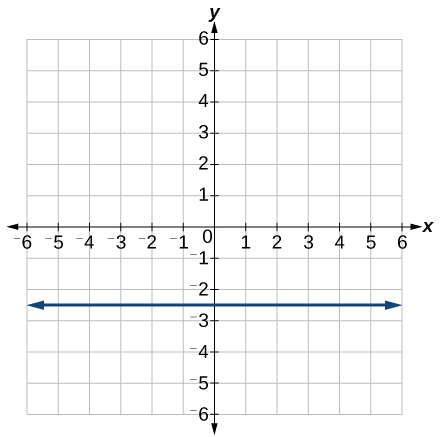
Answer
4.1-65 §4.1 source ↗
For the following exercises, match the given linear equation with its graph in Figure 33.
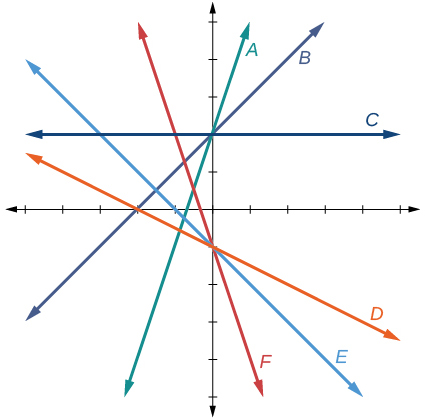 Figure 33
Answer
4.1-67 §4.1 source ↗
For the following exercises, match the given linear equation with its graph in Figure 33.
Figure 33
Answer
4.1-69 §4.1 source ↗
For the following exercises, match the given linear equation with its graph in Figure 33.
Figure 33
Answer
4.1-71 §4.1 source ↗
For the following exercises, sketch a line with the given features.
An x-intercept and y-intercept of
Answer
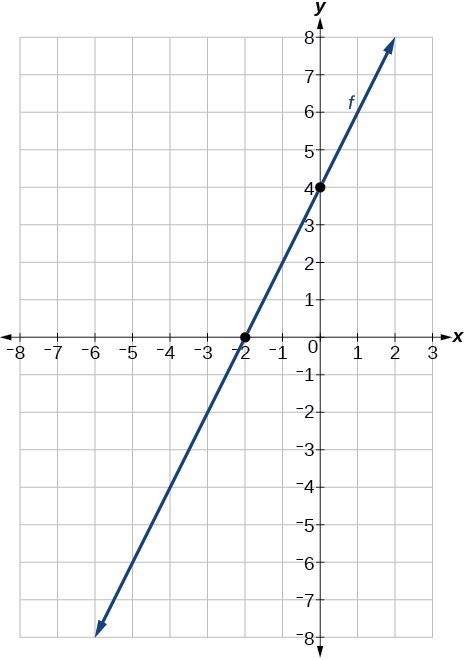
4.1-73 §4.1 source ↗
For the following exercises, sketch a line with the given features.
A y-intercept of and slope
Answer
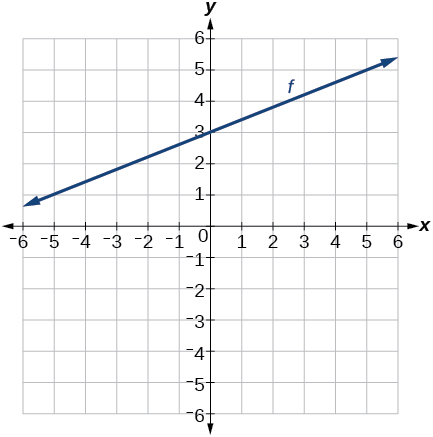
4.1-75 §4.1 source ↗
For the following exercises, sketch a line with the given features.
Passing through the points and
Answer
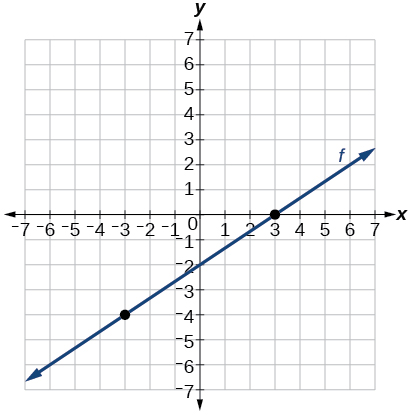
4.1-77 §4.1 source ↗
For the following exercises, sketch the graph of each equation.
Answer
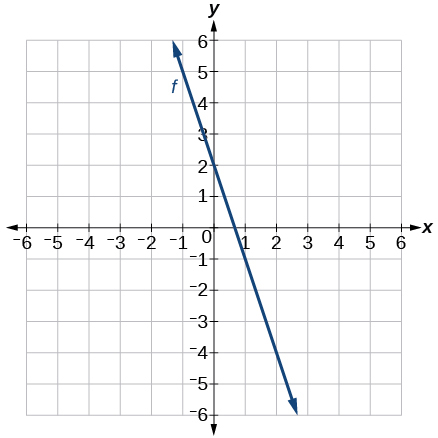
4.1-79 §4.1 source ↗
For the following exercises, sketch the graph of each equation.
Answer
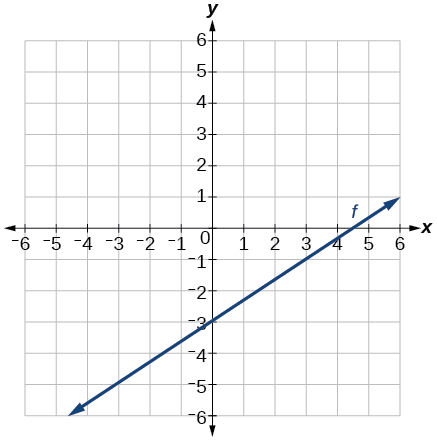
4.1-81 §4.1 source ↗
For the following exercises, sketch the graph of each equation.
Answer
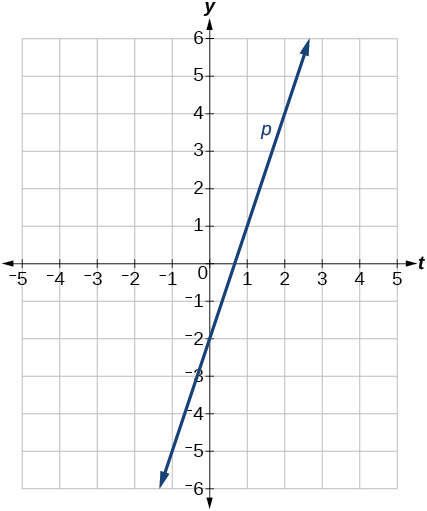
4.1-83 §4.1 source ↗
For the following exercises, sketch the graph of each equation.
Answer
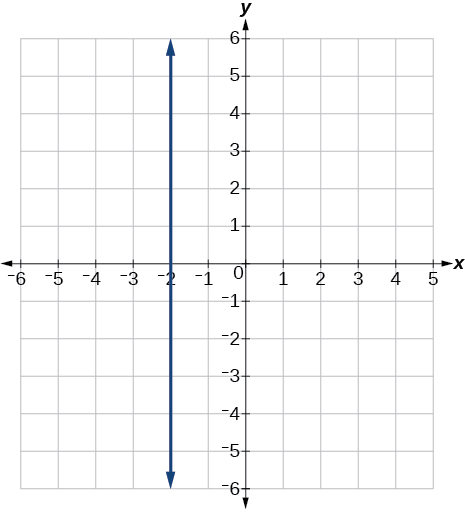
4.1-85 §4.1 source ↗
For the following exercises, write the equation of the line shown in the graph.
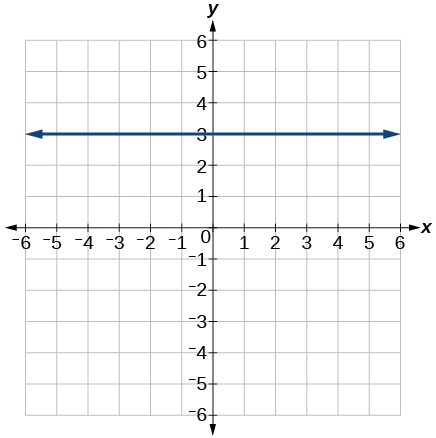
Answer
4.1-87 §4.1 source ↗
For the following exercises, write the equation of the line shown in the graph.
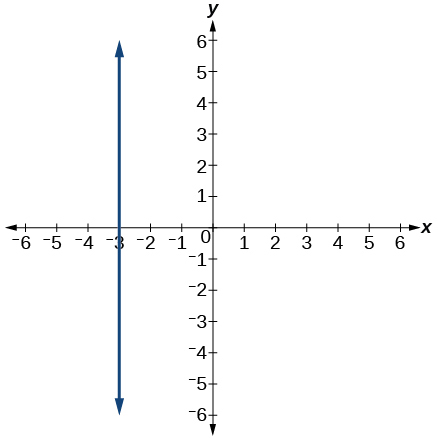
Answer
4.1-89 §4.1 source ↗
For the following exercises, which of the tables could represent a linear function? For each that could be linear, find a linear equation that models the data.
| 0 | 5 | 10 | 15 | |
| 5 | –10 | –25 | –40 |
Answer
4.1-91 §4.1 source ↗
For the following exercises, which of the tables could represent a linear function? For each that could be linear, find a linear equation that models the data.
| 0 | 5 | 10 | 15 | |
| –5 | 20 | 45 | 70 |
Answer
4.1-93 §4.1 source ↗
For the following exercises, which of the tables could represent a linear function? For each that could be linear, find a linear equation that models the data.
| 0 | 2 | 4 | 6 | |
| 6 | –19 | –44 | –69 |
Answer
4.1-95 §4.1 source ↗
For the following exercises, which of the tables could represent a linear function? For each that could be linear, find a linear equation that models the data.
| 2 | 4 | 6 | 8 | |
| –4 | 16 | 36 | 56 |
Answer
4.1-97 §4.1 source ↗
For the following exercises, use a calculator or graphing technology to complete the task.
If is a linear function, , and , find an equation for the function.
Answer
4.1-99 §4.1 source ↗
For the following exercises, use a calculator or graphing technology to complete the task.
Graph the function on a domain of
Answer
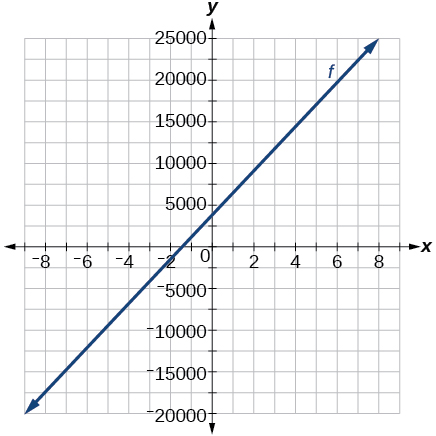
4.1-101 §4.1 source ↗
For the following exercises, use a calculator or graphing technology to complete the task.
Table 4 shows the input, and output, for a linear function
ⓐFill in the missing values of the table.
ⓑWrite the linear function
| p | 0.5 | 0.8 | 12 | b |
| q | 400 | 700 | a | 1,000,000 |
Answer
ⓐ
ⓑ
4.1-103 §4.1 source ↗
For the following exercises, use a calculator or graphing technology to complete the task.
Graph the linear function on a domain of for the function whose slope is 75 and y-intercept is Label the points for the input values of and
Answer
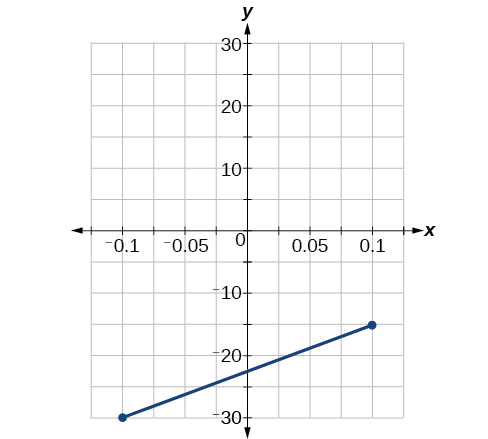
4.1-105 §4.1 source ↗
For the following exercises, use a calculator or graphing technology to complete the task.
Find the value of if a linear function goes through the following points and has the following slope:
Answer
4.1-107 §4.1 source ↗
For the following exercises, use a calculator or graphing technology to complete the task.
Find the equation of the line that passes through the following points:
and
Answer
4.1-109 §4.1 source ↗
For the following exercises, use a calculator or graphing technology to complete the task.
Find the equation of the line that passes through the following points:
and
Answer
4.1-111 §4.1 source ↗
For the following exercises, use a calculator or graphing technology to complete the task.
Find the equation of the line perpendicular to the line through the point
Answer
4.1-113 §4.1 source ↗
For the following exercises, use the functions
Where is greater than Where is greater than
Answer
4.1-115 §4.1 source ↗
For the following exercises, use the functions
A gym membership with two personal training sessions costs $125, while gym membership with five personal training sessions costs $260. What is cost per session?
Answer
4.1-117 §4.1 source ↗
For the following exercises, use the functions
A phone company charges for service according to the formula: where is the number of minutes talked, and is the monthly charge, in dollars. Find and interpret the rate of change and initial value.
Answer
4.1-119 §4.1 source ↗
For the following exercises, use the functions
A city’s population in the year 1960 was 287,500. In 1989 the population was 275,900. Compute the rate of growth of the population and make a statement about the population rate of change in people per year.
Answer
4.1-121 §4.1 source ↗
For the following exercises, use the functions
Suppose that average annual income (in dollars) for the years 1990 through 1999 is given by the linear function: , where is the number of years after 1990. Which of the following interprets the slope in the context of the problem?
ⓐAs of 1990, average annual income was $23,286.
ⓑIn the ten-year period from 1990–1999, average annual income increased by a total of $1,054.
ⓒEach year in the decade of the 1990s, average annual income increased by $1,054.
ⓓAverage annual income rose to a level of $23,286 by the end of 1999.
Answer
Try It #1 §4.2 source ↗
A company sells doughnuts. They incur a fixed cost of $25,000 for rent, insurance, and other expenses. It costs $0.25 to produce each doughnut.
ⓐ Write a linear model to represent the cost of the company as a function of the number of doughnuts produced.
ⓑ Find and interpret the y-intercept.
Answer
ⓑ The y-intercept is . If the company does not produce a single doughnut, they still incur a cost of $25,000.
Try It #2 §4.2 source ↗
A city’s population has been growing linearly. In 2008, the population was 28,200. By 2012, the population was 36,800. Assume this trend continues.
ⓐPredict the population in 2014.
ⓑIdentify the year in which the population will reach 54,000.
Answer
Try It #3 §4.2 source ↗
Answer
4.2-1 §4.2 source ↗
Answer
4.2-3 §4.2 source ↗
Answer
4.2-5 §4.2 source ↗
Answer
4.2-7 §4.2 source ↗
Answer
4.2-9 §4.2 source ↗
For the following exercises, consider this scenario: A town’s population has been decreasing at a constant rate. In 2010 the population was 5,900. By 2012 the population had dropped to 4,700. Assume this trend continues.
Predict the population in 2016.
Answer
4.2-11 §4.2 source ↗
For the following exercises, consider this scenario: A town’s population has been increased at a constant rate. In 2010 the population was 46,020. By 2012 the population had increased to 52,070. Assume this trend continues.
Predict the population in 2016.
Answer
4.2-13 §4.2 source ↗
For the following exercises, consider this scenario: A town has an initial population of 75,000. It grows at a constant rate of 2,500 per year for 5 years.
Find the linear function that models the town’s population as a function of the year, where is the number of years since the model began.
Answer
4.2-15 §4.2 source ↗
For the following exercises, consider this scenario: A town has an initial population of 75,000. It grows at a constant rate of 2,500 per year for 5 years.
If the function is graphed, find and interpret the x- and y-intercepts.
Answer
4.2-17 §4.2 source ↗
For the following exercises, consider this scenario: A town has an initial population of 75,000. It grows at a constant rate of 2,500 per year for 5 years.
When will the population reach 100,000?
Answer
4.2-19 §4.2 source ↗
For the following exercises, consider this scenario: The weight of a newborn is 7.5 pounds. The baby gained one-half pound a month for its first year.
Find the linear function that models the baby’s weight as a function of the age of the baby, in months,
Answer
4.2-21 §4.2 source ↗
For the following exercises, consider this scenario: The weight of a newborn is 7.5 pounds. The baby gained one-half pound a month for its first year.
If the function is graphed, find and interpret the x- and y-intercepts.
Answer
4.2-23 §4.2 source ↗
For the following exercises, consider this scenario: The weight of a newborn is 7.5 pounds. The baby gained one-half pound a month for its first year.
When did the baby weigh 10.4 pounds?
Answer
4.2-25 §4.2 source ↗
For the following exercises, consider this scenario: The number of people afflicted with the common cold in the winter months steadily decreased by 205 each year from 2005 until 2010. In 2005, 12,025 people were inflicted.
Find the linear function that models the number of people inflicted with the common cold as a function of the year,
Answer
4.2-27 §4.2 source ↗
For the following exercises, consider this scenario: The number of people afflicted with the common cold in the winter months steadily decreased by 205 each year from 2005 until 2010. In 2005, 12,025 people were inflicted.
If the function is graphed, find and interpret the x- and y-intercepts.
Answer
4.2-29 §4.2 source ↗
For the following exercises, consider this scenario: The number of people afflicted with the common cold in the winter months steadily decreased by 205 each year from 2005 until 2010. In 2005, 12,025 people were inflicted.
When will the number of people afflicted with the common cold reach 0?
Answer
4.2-31 §4.2 source ↗
For the following exercises, use the graph in Figure 7, which shows the profit, in thousands of dollars, of a company in a given year, where represents the number of years since 1980.
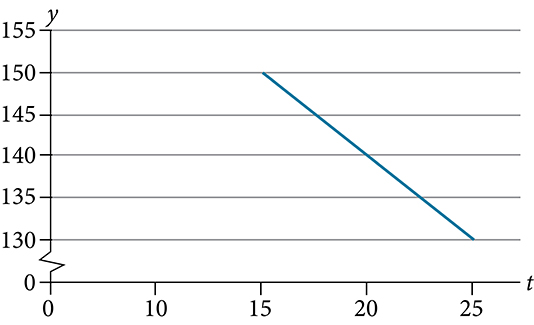 Figure 7
Find the linear function where depends on the number of years since 1980.
Answer
4.2-33 §4.2 source ↗
For the following exercises, use the graph in Figure 7, which shows the profit, in thousands of dollars, of a company in a given year, where represents the number of years since 1980.
Figure 7 Find and interpret the x-intercept.
Answer
4.2-35 §4.2 source ↗
For the following exercises, use the graph in Figure 8, which shows the profit, in thousands of dollars, of a company in a given year, where represents the number of years since 1980.
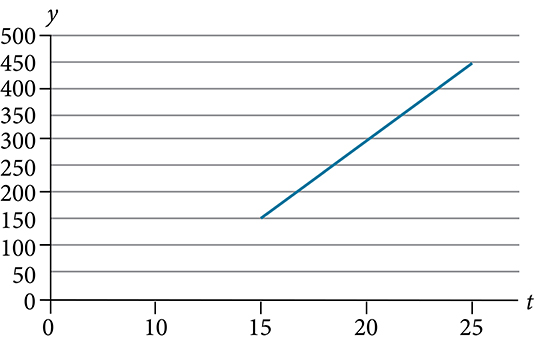 Figure 8
Find the linear function where depends on the number of years since 1980.
Answer
4.2-37 §4.2 source ↗
For the following exercises, use the graph in Figure 8, which shows the profit, in thousands of dollars, of a company in a given year, where represents the number of years since 1980.
Figure 8 Find and interpret the x-intercept.
Answer
4.2-39 §4.2 source ↗
For the following exercises, use the median home values in Mississippi and Hawaii (adjusted for inflation) shown in Table 2. Assume that the house values are changing linearly.
| Year | Mississippi | Hawaii |
|---|---|---|
| 1950 | $25,200 | $74,400 |
| 2000 | $71,400 | $272,700 |
In which state have home values increased at a higher rate?
Answer
4.2-41 §4.2 source ↗
For the following exercises, use the median home values in Mississippi and Hawaii (adjusted for inflation) shown in Table 2. Assume that the house values are changing linearly.
| Year | Mississippi | Hawaii |
|---|---|---|
| 1950 | $25,200 | $74,400 |
| 2000 | $71,400 | $272,700 |
If we assume the linear trend existed before 1950 and continues after 2000, the two states’ median house values will be (or were) equal in what year? (The answer might be absurd.)
Answer
4.2-43 §4.2 source ↗
For the following exercises, use the median home values in Indiana and Alabama (adjusted for inflation) shown in Table 3. Assume that the house values are changing linearly.
| Year | Indiana | Alabama |
|---|---|---|
| 1950 | $37,700 | $27,100 |
| 2000 | $94,300 | $85,100 |
If these trends were to continue, what would be the median home value in Indiana in 2010?
Answer
4.2-45 §4.2 source ↗
For the following exercises, use the median home values in Indiana and Alabama (adjusted for inflation) shown in Table 3. Assume that the house values are changing linearly.
| Year | Indiana | Alabama |
|---|---|---|
| 1950 | $37,700 | $27,100 |
| 2000 | $94,300 | $85,100 |
In 2004, a school population was 1001. By 2008 the population had grown to 1697. Assume the population is changing linearly.
ⓐHow much did the population grow between the year 2004 and 2008?
ⓑHow long did it take the population to grow from 1001 students to 1697 students?
ⓒWhat is the average population growth per year?
ⓓWhat was the population in the year 2000?
ⓔFind an equation for the population, of the school t years after 2000.
ⓕUsing your equation, predict the population of the school in 2011.
Answer
ⓐ696 people
ⓑ4 years
ⓒ174 people per year
ⓓ305 people
ⓔP(t) = 305 + 174t
ⓕ2,219 people
4.2-47 §4.2 source ↗
For the following exercises, use the median home values in Indiana and Alabama (adjusted for inflation) shown in Table 3. Assume that the house values are changing linearly.
| Year | Indiana | Alabama |
|---|---|---|
| 1950 | $37,700 | $27,100 |
| 2000 | $94,300 | $85,100 |
A phone company has a monthly cellular plan where a customer pays a flat monthly fee and then a certain amount of money per minute used for voice or video calling. If a customer uses 410 minutes, the monthly cost will be $71.50. If the customer uses 720 minutes, the monthly cost will be $118.
ⓐFind a linear equation for the monthly cost of the cell plan as a function of x, the number of monthly minutes used.
ⓑInterpret the slope and y-intercept of the equation.
ⓒUse your equation to find the total monthly cost if 687 minutes are used.
Answer
ⓐC(x) = 0.15x + 10
ⓑThe flat monthly fee is $10 and there is a $0.15 fee for each additional minute used
ⓒ$113.05
4.2-49 §4.2 source ↗
For the following exercises, use the median home values in Indiana and Alabama (adjusted for inflation) shown in Table 3. Assume that the house values are changing linearly.
| Year | Indiana | Alabama |
|---|---|---|
| 1950 | $37,700 | $27,100 |
| 2000 | $94,300 | $85,100 |
In 1990, the moose population in a park was measured to be 4,360. By 1999, the population was measured again to be 5,880. Assume the population continues to change linearly.
ⓐFind a formula for the moose population, P since 1991.
ⓑWhat does your model predict the moose population to be in 2003?
Answer
ⓐ
ⓑ 6,640 moose
4.2-51 §4.2 source ↗
For the following exercises, use the median home values in Indiana and Alabama (adjusted for inflation) shown in Table 3. Assume that the house values are changing linearly.
| Year | Indiana | Alabama |
|---|---|---|
| 1950 | $37,700 | $27,100 |
| 2000 | $94,300 | $85,100 |
The Federal Helium Reserve held about 16 billion cubic feet of helium in 2010 and is being depleted by about 2.1 billion cubic feet each year.
ⓐ Give a linear equation for the remaining federal helium reserves, in terms of the number of years since 2010.
ⓑ In 2015, what will the helium reserves be?
ⓒ If the rate of depletion doesn’t change, in what year will the Federal Helium Reserve be depleted?
Answer
ⓐ
ⓑ 5.5 billion cubic feet
ⓒ During the year 2017
4.2-53 §4.2 source ↗
For the following exercises, use the median home values in Indiana and Alabama (adjusted for inflation) shown in Table 3. Assume that the house values are changing linearly.
| Year | Indiana | Alabama |
|---|---|---|
| 1950 | $37,700 | $27,100 |
| 2000 | $94,300 | $85,100 |
You are choosing between two different prepaid cell phone plans. The first plan charges a rate of 26 cents per minute. The second plan charges a monthly fee of $19.95 plus 11 cents per minute. How many minutes would you have to use in a month in order for the second plan to be preferable?
Answer
4.2-55 §4.2 source ↗
For the following exercises, use the median home values in Indiana and Alabama (adjusted for inflation) shown in Table 3. Assume that the house values are changing linearly.
| Year | Indiana | Alabama |
|---|---|---|
| 1950 | $37,700 | $27,100 |
| 2000 | $94,300 | $85,100 |
When hired at a new job selling jewelry, you are given two pay options:
Option A: Base salary of $17,000 a year with a commission of 12% of your sales
Option B: Base salary of $20,000 a year with a commission of 5% of your sales
How much jewelry would you need to sell for option A to produce a larger income?
Answer
4.2-57 §4.2 source ↗
For the following exercises, use the median home values in Indiana and Alabama (adjusted for inflation) shown in Table 3. Assume that the house values are changing linearly.
| Year | Indiana | Alabama |
|---|---|---|
| 1950 | $37,700 | $27,100 |
| 2000 | $94,300 | $85,100 |
When hired at a new job selling electronics, you are given two pay options:
Option A: Base salary of $20,000 a year with a commission of 12% of your sales
Option B: Base salary of $26,000 a year with a commission of 3% of your sales
How much electronics would you need to sell for option A to produce a larger income?
Answer
Try It #1 §4.3 source ↗
Answer
Try It #2 §4.3 source ↗
Answer
4.3-1 §4.3 source ↗
Answer
4.3-3 §4.3 source ↗
Answer
4.3-5 §4.3 source ↗
Answer
4.3-7 §4.3 source ↗
A regression was run to determine whether there is a relationship between the diameter of a tree ( , in inches) and the tree’s age ( , in years). The results of the regression are given below. Use this to predict the age of a tree with diameter 10 inches.
Answer
4.3-9 §4.3 source ↗
For the following exercises, draw a scatter plot for the data provided. Does the data appear to be linearly related?
| 1 | 2 | 3 | 4 | 5 | 6 |
| 46 | 50 | 59 | 75 | 100 | 136 |
Answer
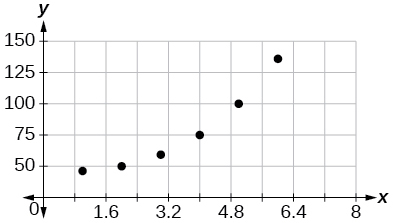
No.
4.3-11 §4.3 source ↗
For the following exercises, draw a scatter plot for the data provided. Does the data appear to be linearly related?
| 1 | 3 | 5 | 7 | 9 | 11 |
| 1 | 9 | 28 | 65 | 125 | 216 |
Answer
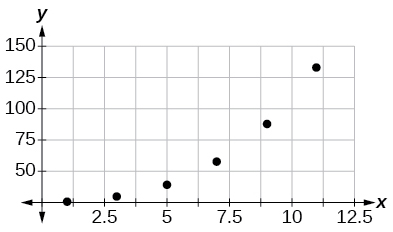
No.
4.3-13 §4.3 source ↗
For the following exercises, draw a scatter plot for the data provided. Does the data appear to be linearly related?
For the following data, draw a scatter plot. If we wanted to know when the temperature would reach 28°F, would the answer involve interpolation or extrapolation? Eyeball the line and estimate the answer.
| Temperature,°F | 16 | 18 | 20 | 25 | 30 |
| Time, seconds | 46 | 50 | 54 | 55 | 62 |
Answer
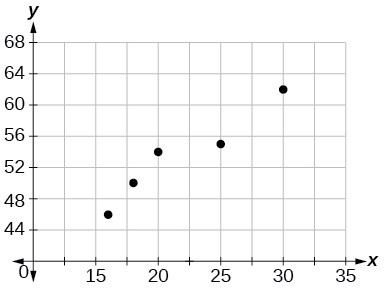
Interpolation. About
4.3-15 §4.3 source ↗
For the following exercises, match each scatterplot with one of the four specified correlations in Figure 9 and Figure 10.
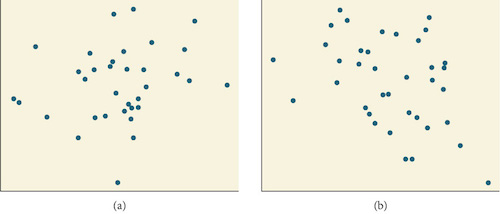
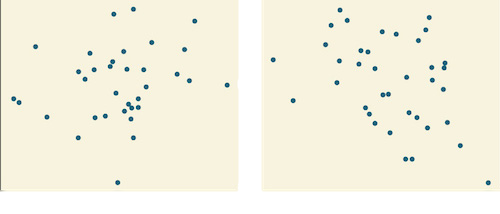 Figure 9
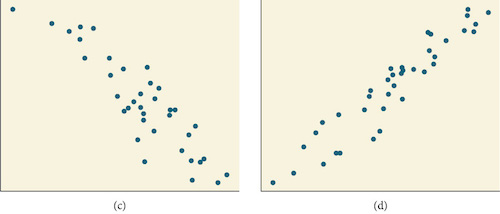
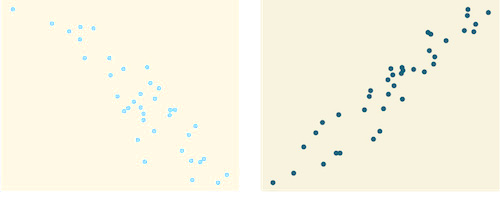 Figure 10
Answer
4.3-17 §4.3 source ↗
For the following exercises, match each scatterplot with one of the four specified correlations in Figure 9 and Figure 10.
Figure 9 Figure 10
Answer
4.3-19 §4.3 source ↗
For the following exercises, draw a best-fit line for the plotted data.
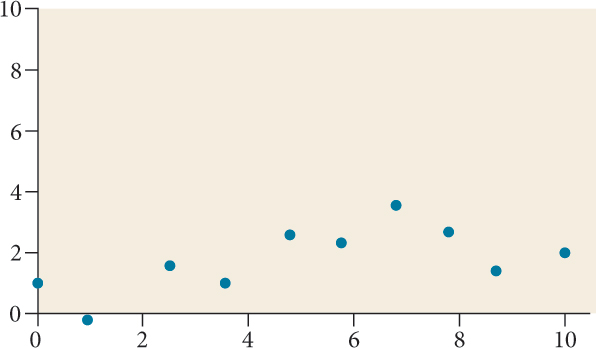
Answer
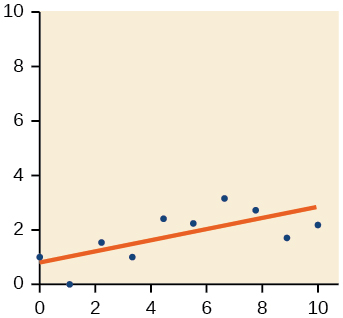
4.3-21 §4.3 source ↗
For the following exercises, draw a best-fit line for the plotted data.
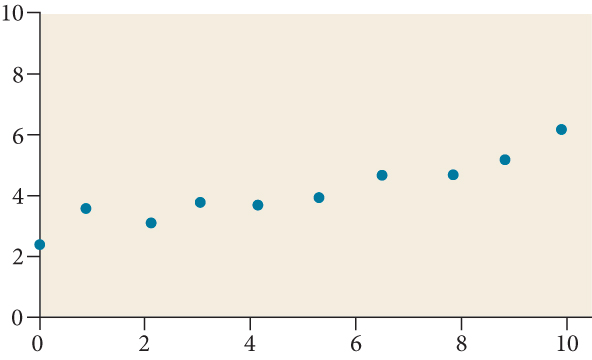
Answer
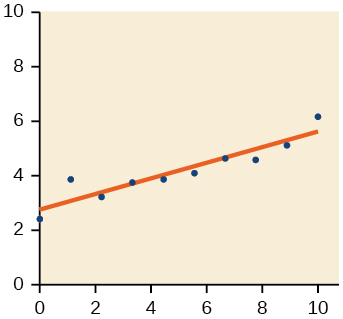
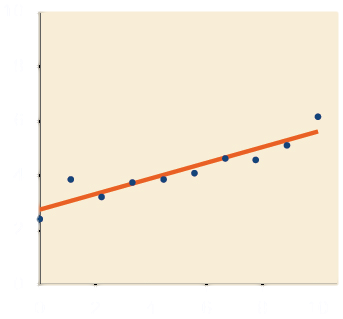
4.3-23 §4.3 source ↗
For the following exercises, draw a best-fit line for the plotted data.
The U.S. import of wine (in hectoliters) for several years is given in Table 5. Determine whether the trend appears linear. If so, and assuming the trend continues, in what year will imports exceed 12,000 hectoliters?
| Year | Imports |
|---|---|
| 1992 | 2665 |
| 1994 | 2688 |
| 1996 | 3565 |
| 1998 | 4129 |
| 2000 | 4584 |
| 2002 | 5655 |
| 2004 | 6549 |
| 2006 | 7950 |
| 2008 | 8487 |
| 2009 | 9462 |
Answer
4.3-25 §4.3 source ↗
For the following exercises, use each set of data to calculate the regression line using a calculator or other technology tool, and determine the correlation coefficient to 3 decimal places of accuracy.
| 8 | 15 | 26 | 31 | 56 | |
| 23 | 41 | 53 | 72 | 103 |
Answer
4.3-27 §4.3 source ↗
For the following exercises, use each set of data to calculate the regression line using a calculator or other technology tool, and determine the correlation coefficient to 3 decimal places of accuracy.
| 3 | 21.9 | 10 | 18.54 |
| 4 | 22.22 | 11 | 15.76 |
| 5 | 22.74 | 12 | 13.68 |
| 6 | 22.26 | 13 | 14.1 |
| 7 | 20.78 | 14 | 14.02 |
| 8 | 17.6 | 15 | 11.94 |
| 9 | 16.52 | 16 | 12.76 |
Answer
4.3-29 §4.3 source ↗
For the following exercises, use each set of data to calculate the regression line using a calculator or other technology tool, and determine the correlation coefficient to 3 decimal places of accuracy.
| 21 | 25 | 30 | 31 | 40 | 50 | |
| 17 | 11 | 2 | –1 | –18 | –40 |
Answer
4.3-31 §4.3 source ↗
For the following exercises, use each set of data to calculate the regression line using a calculator or other technology tool, and determine the correlation coefficient to 3 decimal places of accuracy.
| 900 | 988 | 1000 | 1010 | 1200 | 1205 | |
| 70 | 80 | 82 | 84 | 105 | 108 |
Answer
4.3-33 §4.3 source ↗
For the following exercises, use each set of data to calculate the regression line using a calculator or other technology tool, and determine the correlation coefficient to 3 decimal places of accuracy.
Graph Pick a set of five ordered pairs using inputs and use linear regression to verify the function.
Answer
4.3-35 §4.3 source ↗
For the following exercises, consider this scenario: The profit of a company decreased steadily over a ten-year span. The following ordered pairs shows dollars and the number of units sold in hundreds and the profit in thousands of dollars over the ten-year span, (number of units sold, profit) for specific recorded years:
Find to the nearest tenth and interpret the x-intercept.
Answer
4.3-37 §4.3 source ↗
For the following exercises, consider this scenario: The population of a city increased steadily over a ten-year span. The following ordered pairs shows the population and the year over the ten-year span, (population, year) for specific recorded years:
Use linear regression to determine a function where the year depends on the population. Round to three decimal places of accuracy.
Answer
4.3-39 §4.3 source ↗
For the following exercises, consider this scenario: The profit of a company increased steadily over a ten-year span. The following ordered pairs show the number of units sold in hundreds and the profit in thousands of dollars over the ten year span, (number of units sold, profit) for specific recorded years:
Use linear regression to determine a function y, where the profit in thousands of dollars depends on the number of units sold in hundreds.
Answer
4.3-41 §4.3 source ↗
For the following exercises, consider this scenario: The profit of a company decreased steadily over a ten-year span. The following ordered pairs show dollars and the number of units sold in hundreds and the profit in thousands of dollars over the ten-year span (number of units sold, profit) for specific recorded years:
Use linear regression to determine a function y, where the profit in thousands of dollars depends on the number of units sold in hundreds.
Answer
4.R-1 §4.R source ↗
Answer
4.R-3 §4.R source ↗
Determine whether the function is increasing or decreasing.
Answer
4.R-5 §4.R source ↗
Given each set of information, find a linear equation that satisfies the given conditions, if possible.
Passes through and
Answer
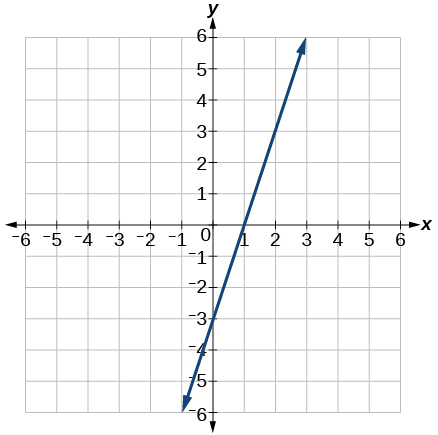
4.R-7 §4.R source ↗
Find the slope of the line shown in the graph.
Answer
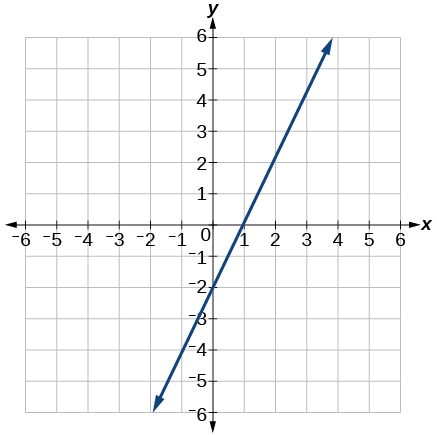
4.R-9 §4.R source ↗
Write an equation in slope-intercept form for the line shown.
Answer
4.R-11 §4.R source ↗
Does the following table represent a linear function? If so, find the linear equation that models the data.
| x | 6 | 8 | 12 | 26 |
| g(x) | –8 | –12 | –18 | –46 |
Answer
4.R-13 §4.R source ↗
For the following exercises, determine whether the lines given by the equations below are parallel, perpendicular, or neither parallel nor perpendicular:
Answer
4.R-15 §4.R source ↗
For the following exercises, find the x- and y- intercepts of the given equation
Answer
4.R-17 §4.R source ↗
For the following exercises, use the descriptions of the pairs of lines to find the slopes of Line 1 and Line 2. Is each pair of lines parallel, perpendicular, or neither?
Line 1: Passes through and
Line 2: Passes through and
Answer
4.R-19 §4.R source ↗
For the following exercises, use the descriptions of the pairs of lines to find the slopes of Line 1 and Line 2. Is each pair of lines parallel, perpendicular, or neither?
Write an equation for a line perpendicular to and passing through the point (5, 20).
Answer
4.R-21 §4.R source ↗
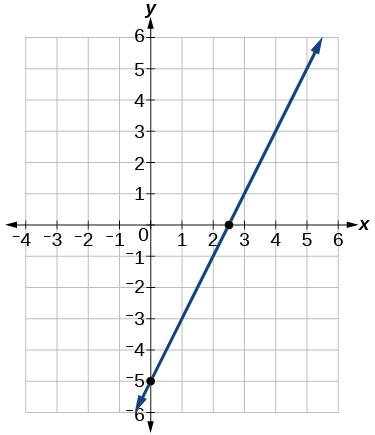
For the following exercises, use the descriptions of the pairs of lines to find the slopes of Line 1 and Line 2. Is each pair of lines parallel, perpendicular, or neither?
Sketch a graph of the linear function
Answer
4.R-23 §4.R source ↗
For the following exercises, use the descriptions of the pairs of lines to find the slopes of Line 1 and Line 2. Is each pair of lines parallel, perpendicular, or neither?
A car rental company offers two plans for renting a car.
Plan A: 25 dollars per day and 10 cents per mile
Plan B: 50 dollars per day with free unlimited mileage
How many miles would you need to drive for plan B to save you money?
Answer
4.R-25 §4.R source ↗
For the following exercises, use the descriptions of the pairs of lines to find the slopes of Line 1 and Line 2. Is each pair of lines parallel, perpendicular, or neither?
A town’s population increases at a constant rate. In 2010 the population was 55,000. By 2012 the population had increased to 76,000. If this trend continues, predict the population in 2016.
Answer
4.R-27 §4.R source ↗
For the following exercises, use the graph in Figure 1 showing the profit, in thousands of dollars, of a company in a given year, where represents years since 1980.
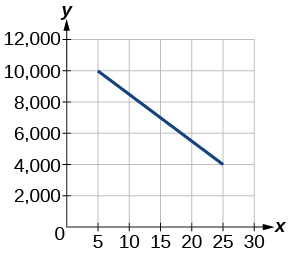 Figure 1
Find the linear function y, where y depends on the number of years since 1980.
Answer
4.R-29 §4.R source ↗
For the following exercise, consider this scenario: In 2004, a school population was 1,700. By 2012 the population had grown to 2,500.
Assume the population is changing linearly.
ⓐHow much did the population grow between the year 2004 and 2012?
ⓑWhat is the average population growth per year?
ⓒFind an equation for the population, P, of the school t years after 2004.
Answer
ⓐ 800
ⓑ 100 students per year
ⓒ
4.R-31 §4.R source ↗
For the following exercises, consider this scenario: In 2000, the moose population in a park was measured to be 6,500. By 2010, the population was measured to be 12,500. Assume the population continues to change linearly.
What does your model predict the moose population to be in 2020?
Answer
4.R-33 §4.R source ↗
For the following exercises, consider this scenario: The median home values in subdivisions Pima Central and East Valley (adjusted for inflation) are shown in Table 1. Assume that the house values are changing linearly.
| Year | Pima Central | East Valley |
|---|---|---|
| 1970 | 32,000 | 120,250 |
| 2010 | 85,000 | 150,000 |
If these trends were to continue, what would be the median home value in Pima Central in 2015?
Answer
4.R-35 §4.R source ↗
For the following exercises, consider this scenario: The median home values in subdivisions Pima Central and East Valley (adjusted for inflation) are shown in Table 1. Assume that the house values are changing linearly.
| Year | Pima Central | East Valley |
|---|---|---|
| 1970 | 32,000 | 120,250 |
| 2010 | 85,000 | 150,000 |
Draw a scatter plot for the data in Table 3. If we wanted to know when the population would reach 15,000, would the answer involve interpolation or extrapolation?
| Year | Population |
|---|---|
| 1990 | 5,600 |
| 1995 | 5,950 |
| 2000 | 6,300 |
| 2005 | 6,600 |
| 2010 | 6,900 |
Answer
Extrapolation
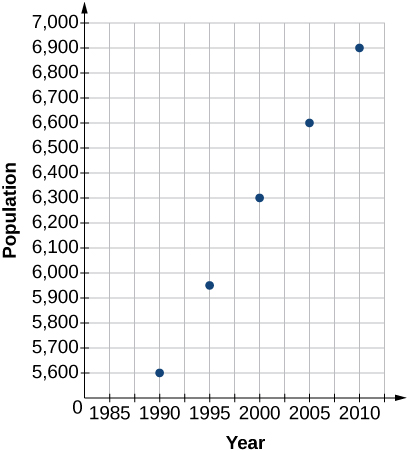
4.R-37 §4.R source ↗
For the following exercises, consider this scenario: The median home values in subdivisions Pima Central and East Valley (adjusted for inflation) are shown in Table 1. Assume that the house values are changing linearly.
| Year | Pima Central | East Valley |
|---|---|---|
| 1970 | 32,000 | 120,250 |
| 2010 | 85,000 | 150,000 |
Draw a best-fit line for the plotted data.
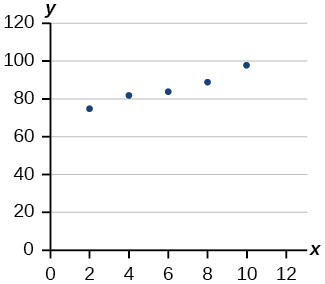
Answer
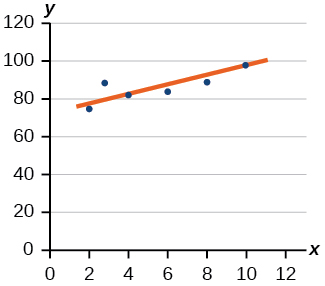
4.R-39 §4.R source ↗
For the following exercises, consider the data in Table 5, which shows the percent of unemployed in a city of people 25 years or older who are college graduates is given below, by year.
| Year | 2000 | 2002 | 2005 | 2007 | 2010 |
| Percent Graduates | 6.5 | 7.0 | 7.4 | 8.2 | 9.0 |
In what year will the percentage exceed 12%?
Answer
4.R-41 §4.R source ↗
For the following exercises, consider the data in Table 5, which shows the percent of unemployed in a city of people 25 years or older who are college graduates is given below, by year.
| Year | 2000 | 2002 | 2005 | 2007 | 2010 |
| Percent Graduates | 6.5 | 7.0 | 7.4 | 8.2 | 9.0 |
Based on the set of data given in Table 7, calculate the regression line using a calculator or other technology tool, and determine the correlation coefficient to three decimal places.
| 10 | 12 | 15 | 18 | 20 | |
| 36 | 34 | 30 | 28 | 22 |
Answer
4.R-43 §4.R source ↗
For the following exercises, consider this scenario: The population of a city increased steadily over a ten-year span. The following ordered pairs show the population and the year over the ten-year span (population, year) for specific recorded years:
Predict when the population will hit 12,000.
Answer
4.R-45 §4.R source ↗
For the following exercises, consider this scenario: The population of a city increased steadily over a ten-year span. The following ordered pairs show the population and the year over the ten-year span (population, year) for specific recorded years:
According to the model, what is the population in 2014?
Answer
4.T-1 §4.T source ↗
Answer
4.T-3 §4.T source ↗
Answer
4.T-5 §4.T source ↗
Answer
4.T-7 §4.T source ↗
Write an equation for line in Figure 2.
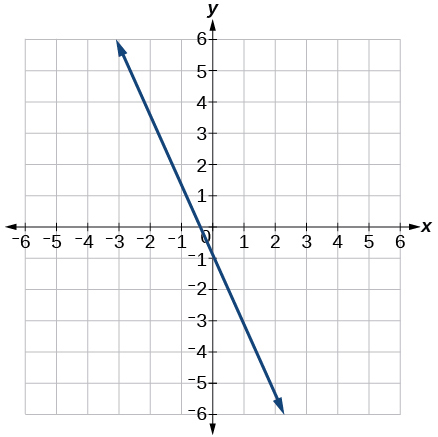 Figure 2
Answer
4.T-9 §4.T source ↗
Does Table 2 represent a linear function? If so, find a linear equation that models the data.
| x | 1 | 3 | 7 | 11 |
| g(x) | 4 | 9 | 19 | 12 |
Answer
4.T-11 §4.T source ↗
For the following exercises, determine whether the lines given by the equations below are parallel, perpendicular, or neither parallel nor perpendicular.
Answer
4.T-13 §4.T source ↗
For the following exercises, determine whether the lines given by the equations below are parallel, perpendicular, or neither parallel nor perpendicular.
Find the x- and y-intercepts of the equation
Answer
4.T-15 §4.T source ↗
For the following exercises, determine whether the lines given by the equations below are parallel, perpendicular, or neither parallel nor perpendicular.
Write an equation for a line perpendicular to and passing through the point
Answer
4.T-17 §4.T source ↗
For the following exercises, determine whether the lines given by the equations below are parallel, perpendicular, or neither parallel nor perpendicular.
Graph of the linear function
Answer
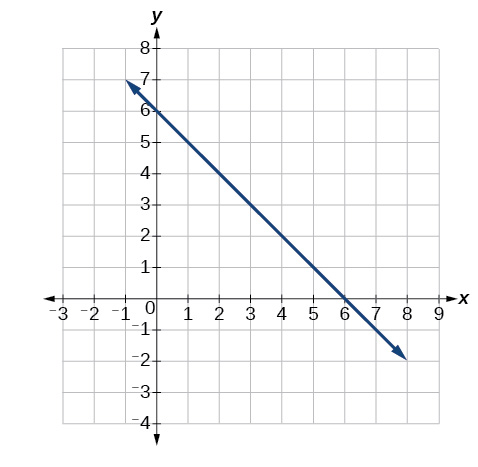
Slope = −1 and y-intercept = 6
4.T-19 §4.T source ↗
For the following exercises, determine whether the lines given by the equations below are parallel, perpendicular, or neither parallel nor perpendicular.
A car rental company offers two plans for renting a car.
Plan A: $25 per day and $0.10 per mile
Plan B: $40 per day with free unlimited mileage
How many miles would you need to drive for plan B to save you money?
Answer
4.T-21 §4.T source ↗
For the following exercises, determine whether the lines given by the equations below are parallel, perpendicular, or neither parallel nor perpendicular.
A town’s population increases at a constant rate. In 2010 the population was 65,000. By 2012 the population had increased to 90,000. Assuming this trend continues, predict the population in 2018.
Answer
4.T-23 §4.T source ↗
For the following exercises, use the graph in Figure 3, showing the profit, in thousands of dollars, of a company in a given year, where represents years since 1980.
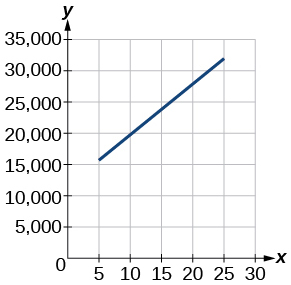 Figure 3
Find the linear function where depends on the number of years since 1980.
Answer
4.T-25 §4.T source ↗
For the following exercises, use the graph in Figure 3, showing the profit, in thousands of dollars, of a company in a given year, where represents years since 1980.
Figure 3 In 2004, a school population was 1250. By 2012 the population had dropped to 875. Assume the population is changing linearly.
ⓐHow much did the population drop between the year 2004 and 2012?
ⓑWhat is the average population decline per year?
ⓒFind an equation for the population, P, of the school t years after 2004.
Answer
ⓐ375
ⓑdropped an average of 46.875, or about 47 people per year
ⓒy = −46.875t + 1250
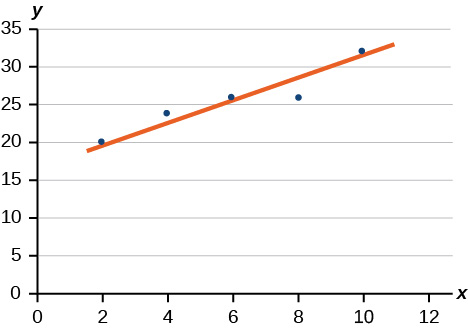
4.T-27 §4.T source ↗
For the following exercises, use the graph in Figure 3, showing the profit, in thousands of dollars, of a company in a given year, where represents years since 1980.
Figure 3 Draw a best-fit line for the plotted data.
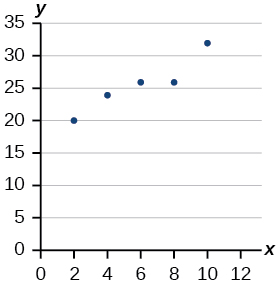
Answer
4.T-29 §4.T source ↗
For the following exercises, use Table 4, which shows the percent of unemployed persons 25 years or older who are college graduates in a particular city, by year.
| Year | 2000 | 2002 | 2005 | 2007 | 2010 |
| Percent Graduates | 8.5 | 8.0 | 7.2 | 6.7 | 6.4 |
In what year will the percentage drop below 4%?
Answer
4.T-31 §4.T source ↗
For the following exercises, consider this scenario: The population of a city increased steadily over a ten-year span. The following ordered pairs shows the population (in hundreds) and the year over the ten-year span, (population, year) for specific recorded years:
Use linear regression to determine a function y, where the year depends on the population. Round to three decimal places of accuracy.
Answer
4.T-33 §4.T source ↗
For the following exercises, consider this scenario: The population of a city increased steadily over a ten-year span. The following ordered pairs shows the population (in hundreds) and the year over the ten-year span, (population, year) for specific recorded years:
What is the correlation coefficient for this model?
Answer
Loading chapter 5…
Problems and answers are adapted from College Algebra 2e by Jay Abramson, OpenStax, and are used under the CC BY-NC-SA 4.0 licence. Access for free at https://openstax.org/books/college-algebra-2e/pages/1-introduction-to-prerequisites. Illustrations: Copyright Rice University, OpenStax, under CC BY-NC-SA 4.0 license. This adaptation is released under the same licence, is non-commercial, and is neither affiliated with nor endorsed by OpenStax or Rice University.