Every problem in the chapter beside the book’s answer, a chapter at a time as you scroll.
Chapter 6: Exponential and Logarithmic Functions
370 problems · 90 figuresTry It #1 §6.1 source ↗
Which of the following equations represent exponential functions?
•
•
•
•
Answer
Try It #2 §6.1 source ↗
Answer
Try It #3 §6.1 source ↗
Answer
Try It #4 §6.1 source ↗
Answer
Try It #5 §6.1 source ↗
Answer
Try It #6 §6.1 source ↗
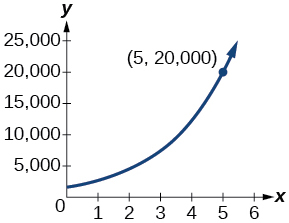
Find an equation for the exponential function graphed in Figure 6.
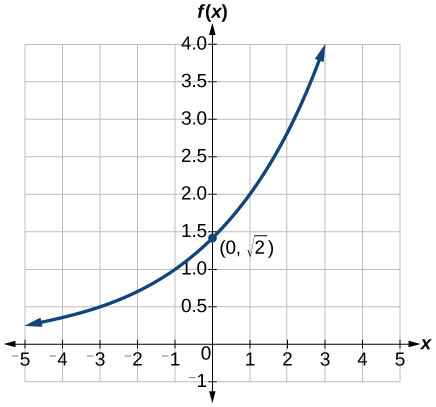 Figure 6
Answer
Try It #7 §6.1 source ↗
Answer
Try It #8 §6.1 source ↗
Answer
Try It #9 §6.1 source ↗
Answer
Try It #10 §6.1 source ↗
Answer
Try It #11 §6.1 source ↗
Answer
Try It #12 §6.1 source ↗
Answer
6.1-1 §6.1 source ↗
Answer
6.1-3 §6.1 source ↗
Answer
6.1-5 §6.1 source ↗
For the following exercises, identify whether the statement represents an exponential function. Explain.
A population of bacteria decreases by a factor of every hours.
Answer
6.1-7 §6.1 source ↗
For the following exercises, identify whether the statement represents an exponential function. Explain.
For each training session, a personal trainer charges his clients less than the previous training session.
Answer
6.1-9 §6.1 source ↗
For the following exercises, consider this scenario: For each year the population of a forest of trees is represented by the function In a neighboring forest, the population of the same type of tree is represented by the function (Round answers to the nearest whole number.)
Which forest’s population is growing at a faster rate?
Answer
6.1-11 §6.1 source ↗
For the following exercises, consider this scenario: For each year the population of a forest of trees is represented by the function In a neighboring forest, the population of the same type of tree is represented by the function (Round answers to the nearest whole number.)
Assuming the population growth models continue to represent the growth of the forests, which forest will have a greater number of trees after years? By how many?
Answer
6.1-13 §6.1 source ↗
For the following exercises, consider this scenario: For each year the population of a forest of trees is represented by the function In a neighboring forest, the population of the same type of tree is represented by the function (Round answers to the nearest whole number.)
Discuss the above results from the previous four exercises. Assuming the population growth models continue to represent the growth of the forests, which forest will have the greater number of trees in the long run? Why? What are some factors that might influence the long-term validity of the exponential growth model?
Answer
6.1-15 §6.1 source ↗
For the following exercises, determine whether the equation represents exponential growth, exponential decay, or neither. Explain.
Answer
6.1-17 §6.1 source ↗
For the following exercises, determine whether the equation represents exponential growth, exponential decay, or neither. Explain.
Answer
6.1-19 §6.1 source ↗
For the following exercises, find the formula for an exponential function that passes through the two points given.
and
Answer
6.1-21 §6.1 source ↗
For the following exercises, find the formula for an exponential function that passes through the two points given.
and
Answer
6.1-23 §6.1 source ↗
For the following exercises, determine whether the table could represent a function that is linear, exponential, or neither. If it appears to be exponential, find a function that passes through the points.
| 1 | 2 | 3 | 4 | |
| 70 | 40 | 10 | -20 |
Answer
6.1-25 §6.1 source ↗
For the following exercises, determine whether the table could represent a function that is linear, exponential, or neither. If it appears to be exponential, find a function that passes through the points.
| 1 | 2 | 3 | 4 | |
| 80 | 61 | 42.9 | 25.61 |
Answer
6.1-27 §6.1 source ↗
For the following exercises, determine whether the table could represent a function that is linear, exponential, or neither. If it appears to be exponential, find a function that passes through the points.
| 1 | 2 | 3 | 4 | |
| -3.25 | 2 | 7.25 | 12.5 |
Answer
6.1-29 §6.1 source ↗
For the following exercises, use the compound interest formula,
What was the initial deposit made to the account in the previous exercise?
Answer
6.1-31 §6.1 source ↗
For the following exercises, use the compound interest formula,
An account is opened with an initial deposit of $6,500 and earns interest compounded semi-annually. What will the account be worth in years?
Answer
6.1-33 §6.1 source ↗
For the following exercises, use the compound interest formula,
Solve the compound interest formula for the principal, .
Answer
6.1-35 §6.1 source ↗
For the following exercises, use the compound interest formula,
How much more would the account in the previous two exercises be worth if it were earning interest for more years?
Answer
6.1-37 §6.1 source ↗
For the following exercises, use the compound interest formula,
Use the formula found in the previous exercise to calculate the interest rate for an account that was compounded semi-annually, had an initial deposit of $9,000 and was worth $13,373.53 after 10 years.
Answer
6.1-39 §6.1 source ↗
For the following exercises, determine whether the equation represents continuous growth, continuous decay, or neither. Explain.
Answer
6.1-41 §6.1 source ↗
For the following exercises, determine whether the equation represents continuous growth, continuous decay, or neither. Explain.
Answer
6.1-43 §6.1 source ↗
For the following exercises, determine whether the equation represents continuous growth, continuous decay, or neither. Explain.
How much less would the account from Exercise 42 be worth after years if it were compounded monthly instead?
Answer
6.1-45 §6.1 source ↗
For the following exercises, evaluate each function. Round answers to four decimal places, if necessary.
for
Answer
6.1-47 §6.1 source ↗
For the following exercises, evaluate each function. Round answers to four decimal places, if necessary.
for
Answer
6.1-49 §6.1 source ↗
For the following exercises, evaluate each function. Round answers to four decimal places, if necessary.
for
Answer
6.1-51 §6.1 source ↗
For the following exercises, use a graphing calculator to find the equation of an exponential function given the points on the curve.
and
Answer
6.1-53 §6.1 source ↗
For the following exercises, use a graphing calculator to find the equation of an exponential function given the points on the curve.
and
Answer
6.1-55 §6.1 source ↗
For the following exercises, use a graphing calculator to find the equation of an exponential function given the points on the curve.
and
Answer
6.1-57 §6.1 source ↗
For the following exercises, use a graphing calculator to find the equation of an exponential function given the points on the curve.
Repeat the previous exercise to find the formula for the APY of an account that compounds daily. Use the results from this and the previous exercise to develop a function for the APY of any account that compounds times per year.
Answer
6.1-59 §6.1 source ↗
For the following exercises, use a graphing calculator to find the equation of an exponential function given the points on the curve.
In an exponential decay function, the base of the exponent is a value between 0 and 1. Thus, for some number the exponential decay function can be written as Use this formula, along with the fact that to show that an exponential decay function takes the form for some positive number .
Answer
6.1-61 §6.1 source ↗
For the following exercises, use a graphing calculator to find the equation of an exponential function given the points on the curve.
The fox population in a certain region has an annual growth rate of 9% per year. In the year 2012, there were 23,900 fox counted in the area. What is the fox population predicted to be in the year 2020?
Answer
6.1-63 §6.1 source ↗
For the following exercises, use a graphing calculator to find the equation of an exponential function given the points on the curve.
In the year 1985, a house was valued at $110,000. By the year 2005, the value had appreciated to $145,000. What was the annual growth rate between 1985 and 2005? Assume that the value continued to grow by the same percentage. What was the value of the house in the year 2010?
Answer
6.1-65 §6.1 source ↗
For the following exercises, use a graphing calculator to find the equation of an exponential function given the points on the curve.
Jaylen wants to save $54,000 for a down payment on a home. How much will he need to invest in an account with 8.2% APR, compounding daily, in order to reach his goal in 5 years?
Answer
6.1-67 §6.1 source ↗
For the following exercises, use a graphing calculator to find the equation of an exponential function given the points on the curve.
Alyssa opened a retirement account with 7.25% APR in the year 2000. Her initial deposit was $13,500. How much will the account be worth in 2025 if interest compounds monthly? How much more would she make if interest compounded continuously?
Answer
Try It #1 §6.2 source ↗
Answer
The domain is the range is the horizontal asymptote is
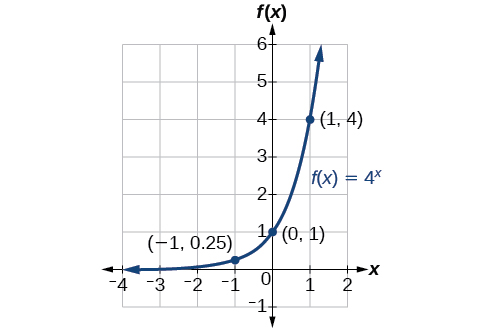
Try It #2 §6.2 source ↗
Answer
The domain is the range is the horizontal asymptote is
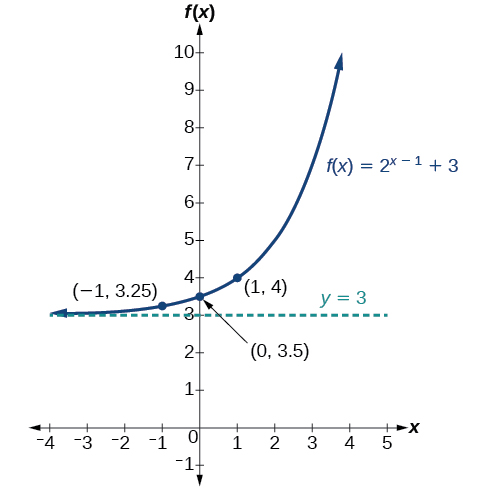
Try It #3 §6.2 source ↗
Answer
Try It #4 §6.2 source ↗
Answer
The domain is the range is the horizontal asymptote is
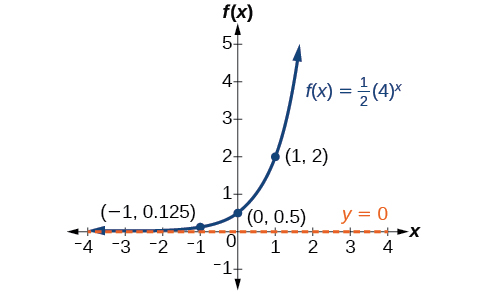
Try It #5 §6.2 source ↗
Answer
The domain is the range is the horizontal asymptote is
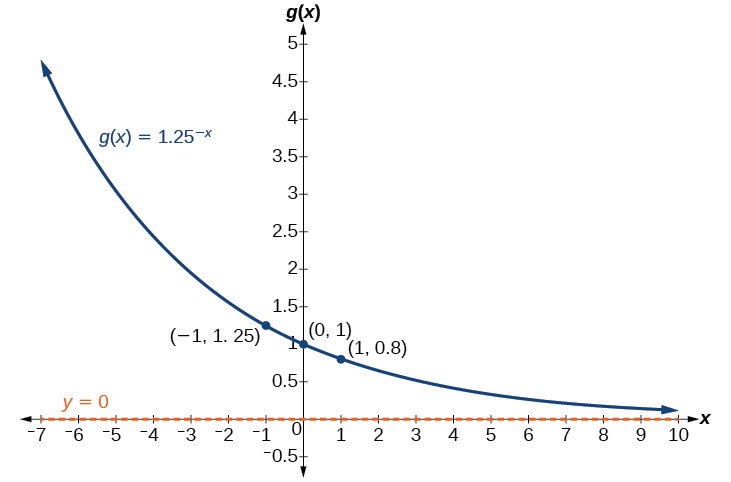
Try It #6 §6.2 source ↗
Write the equation for function described below. Give the horizontal asymptote, the domain, and the range.
• is compressed vertically by a factor of reflected across the x-axis and then shifted down units.
Answer
6.2-1 §6.2 source ↗
Answer
6.2-3 §6.2 source ↗
Answer
6.2-5 §6.2 source ↗
Answer
6.2-7 §6.2 source ↗
Answer
6.2-9 §6.2 source ↗
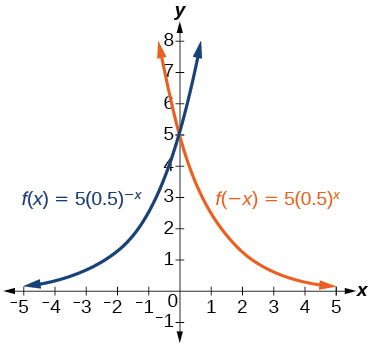
For the following exercises, graph the function and its reflection about the y-axis on the same axes, and give the y-intercept.
Answer
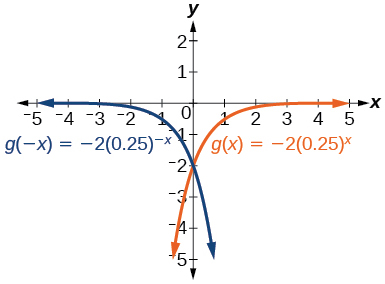
y-intercept:
6.2-11 §6.2 source ↗
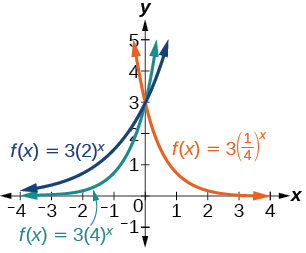
For the following exercises, graph each set of functions on the same axes.
and
Answer
6.2-13 §6.2 source ↗
For the following exercises, match each function with one of the graphs in Figure 12.
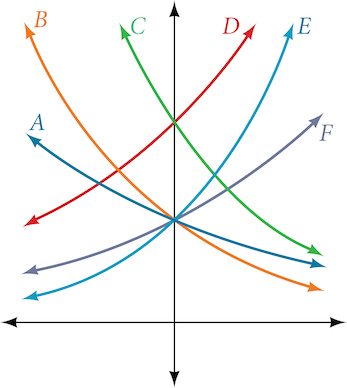 Figure 12
Answer
6.2-15 §6.2 source ↗
For the following exercises, match each function with one of the graphs in Figure 12.
Figure 12
Answer
6.2-17 §6.2 source ↗
For the following exercises, match each function with one of the graphs in Figure 12.
Figure 12
Answer
6.2-19 §6.2 source ↗
For the following exercises, use the graphs shown in Figure 13. All have the form
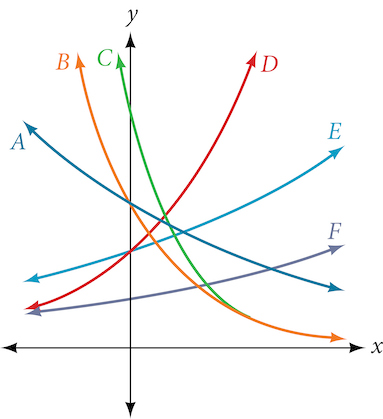 Figure 13
Which graph has the largest value for
Answer
6.2-21 §6.2 source ↗
For the following exercises, use the graphs shown in Figure 13. All have the form
Figure 13 Which graph has the largest value for
Answer
6.2-23 §6.2 source ↗
For the following exercises, graph the function and its reflection about the x-axis on the same axes.
Answer
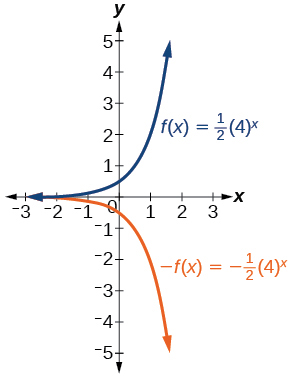
6.2-25 §6.2 source ↗
For the following exercises, graph the function and its reflection about the x-axis on the same axes.
Answer
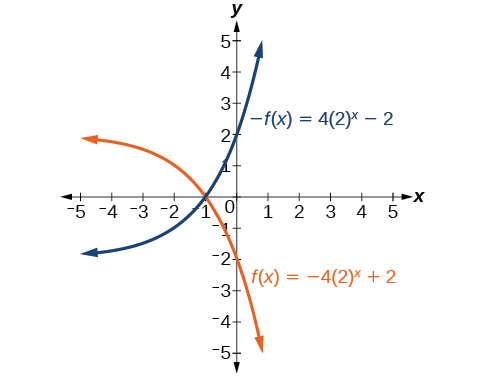
6.2-27 §6.2 source ↗
For the following exercises, graph the transformation of Give the horizontal asymptote, the domain, and the range.
Answer
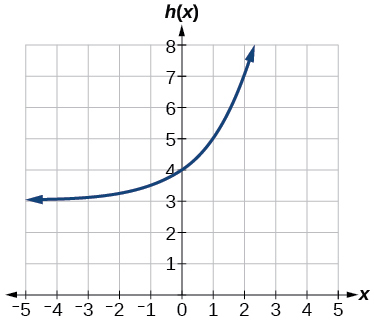
Horizontal asymptote: Domain: all real numbers; Range: all real numbers strictly greater than
6.2-29 §6.2 source ↗
For the following exercises, describe the end behavior of the graphs of the functions.
Answer
As ,
6.2-31 §6.2 source ↗
For the following exercises, describe the end behavior of the graphs of the functions.
Answer
As ,
6.2-33 §6.2 source ↗
For the following exercises, start with the graph of Then write a function that results from the given transformation.
Shift 3 units downward
Answer
6.2-35 §6.2 source ↗
For the following exercises, start with the graph of Then write a function that results from the given transformation.
Shift 5 units right
Answer
6.2-37 §6.2 source ↗
For the following exercises, start with the graph of Then write a function that results from the given transformation.
Reflect about the y-axis
Answer
6.2-39 §6.2 source ↗
For the following exercises, each graph is a transformation of Write an equation describing the transformation.
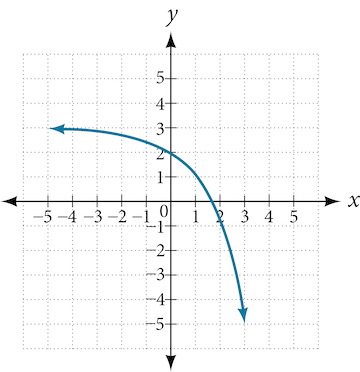
Answer
6.2-41 §6.2 source ↗
For the following exercises, find an exponential equation for the graph.
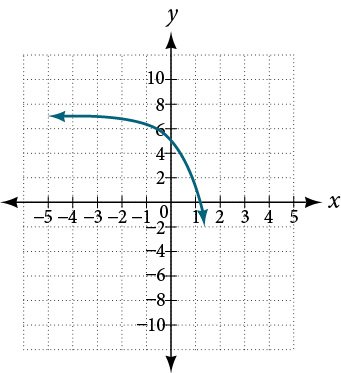
Answer
6.2-43 §6.2 source ↗
For the following exercises, evaluate the exponential functions for the indicated value of
for
Answer
6.2-45 §6.2 source ↗
For the following exercises, evaluate the exponential functions for the indicated value of
for
Answer
6.2-47 §6.2 source ↗
For the following exercises, use a graphing calculator to approximate the solutions of the equation. Round to the nearest thousandth.
Answer
6.2-49 §6.2 source ↗
For the following exercises, use a graphing calculator to approximate the solutions of the equation. Round to the nearest thousandth.
Answer
6.2-51 §6.2 source ↗
For the following exercises, use a graphing calculator to approximate the solutions of the equation. Round to the nearest thousandth.
Explore and discuss the graphs of and Then make a conjecture about the relationship between the graphs of the functions and for any real number
Answer
6.2-53 §6.2 source ↗
For the following exercises, use a graphing calculator to approximate the solutions of the equation. Round to the nearest thousandth.
Explore and discuss the graphs of and Then make a conjecture about the relationship between the graphs of the functions and for any real number n and real number
Answer
Try It #1 §6.3 source ↗
Write the following logarithmic equations in exponential form.
ⓐ
ⓑ
Answer
ⓐ is equivalent to
ⓑ is equivalent to
Try It #2 §6.3 source ↗
Write the following exponential equations in logarithmic form.
ⓐ
ⓑ
ⓒ
Answer
ⓐ is equivalent to
ⓑ is equivalent to
ⓒ is equivalent to
Try It #3 §6.3 source ↗
Answer
Try It #4 §6.3 source ↗
Answer
Try It #5 §6.3 source ↗
Answer
Try It #6 §6.3 source ↗
Answer
Try It #7 §6.3 source ↗
Answer
Try It #8 §6.3 source ↗
Answer
6.3-1 §6.3 source ↗
Answer
6.3-3 §6.3 source ↗
Answer
6.3-5 §6.3 source ↗
Answer
6.3-7 §6.3 source ↗
For the following exercises, rewrite each equation in exponential form.
Answer
6.3-9 §6.3 source ↗
For the following exercises, rewrite each equation in exponential form.
Answer
6.3-11 §6.3 source ↗
For the following exercises, rewrite each equation in exponential form.
Answer
6.3-13 §6.3 source ↗
For the following exercises, rewrite each equation in exponential form.
Answer
6.3-15 §6.3 source ↗
For the following exercises, rewrite each equation in exponential form.
Answer
6.3-17 §6.3 source ↗
For the following exercises, rewrite each equation in logarithmic form.
Answer
6.3-19 §6.3 source ↗
For the following exercises, rewrite each equation in logarithmic form.
Answer
6.3-21 §6.3 source ↗
For the following exercises, rewrite each equation in logarithmic form.
Answer
6.3-23 §6.3 source ↗
For the following exercises, rewrite each equation in logarithmic form.
Answer
6.3-25 §6.3 source ↗
For the following exercises, rewrite each equation in logarithmic form.
Answer
6.3-27 §6.3 source ↗
For the following exercises, solve for by converting the logarithmic equation to exponential form.
Answer
6.3-29 §6.3 source ↗
For the following exercises, solve for by converting the logarithmic equation to exponential form.
Answer
6.3-31 §6.3 source ↗
For the following exercises, solve for by converting the logarithmic equation to exponential form.
Answer
6.3-33 §6.3 source ↗
For the following exercises, solve for by converting the logarithmic equation to exponential form.
Answer
6.3-35 §6.3 source ↗
For the following exercises, solve for by converting the logarithmic equation to exponential form.
Answer
6.3-37 §6.3 source ↗
For the following exercises, use the definition of common and natural logarithms to simplify.
Answer
6.3-39 §6.3 source ↗
For the following exercises, use the definition of common and natural logarithms to simplify.
Answer
6.3-41 §6.3 source ↗
For the following exercises, use the definition of common and natural logarithms to simplify.
Answer
6.3-43 §6.3 source ↗
For the following exercises, evaluate the base logarithmic expression without using a calculator.
Answer
6.3-45 §6.3 source ↗
For the following exercises, evaluate the base logarithmic expression without using a calculator.
Answer
6.3-47 §6.3 source ↗
For the following exercises, evaluate the common logarithmic expression without using a calculator.
Answer
6.3-49 §6.3 source ↗
For the following exercises, evaluate the common logarithmic expression without using a calculator.
Answer
6.3-51 §6.3 source ↗
For the following exercises, evaluate the natural logarithmic expression without using a calculator.
Answer
6.3-53 §6.3 source ↗
For the following exercises, evaluate the natural logarithmic expression without using a calculator.
Answer
6.3-55 §6.3 source ↗
For the following exercises, evaluate each expression using a calculator. Round to the nearest thousandth.
Answer
6.3-57 §6.3 source ↗
For the following exercises, evaluate each expression using a calculator. Round to the nearest thousandth.
Answer
6.3-59 §6.3 source ↗
For the following exercises, evaluate each expression using a calculator. Round to the nearest thousandth.
Is in the domain of the function If so, what is the value of the function when Verify the result.
Answer
6.3-61 §6.3 source ↗
For the following exercises, evaluate each expression using a calculator. Round to the nearest thousandth.
Is there a number such that If so, what is that number? Verify the result.
Answer
6.3-63 §6.3 source ↗
For the following exercises, evaluate each expression using a calculator. Round to the nearest thousandth.
Is the following true: Verify the result.
Answer
6.3-65 §6.3 source ↗
For the following exercises, evaluate each expression using a calculator. Round to the nearest thousandth.
Refer to the previous exercise. Suppose the light meter on a camera indicates an of and the desired exposure time is 16 seconds. What should the f-stop setting be?
Answer
Try It #1 §6.4 source ↗
Answer
Try It #2 §6.4 source ↗
Answer
Try It #3 §6.4 source ↗
Answer
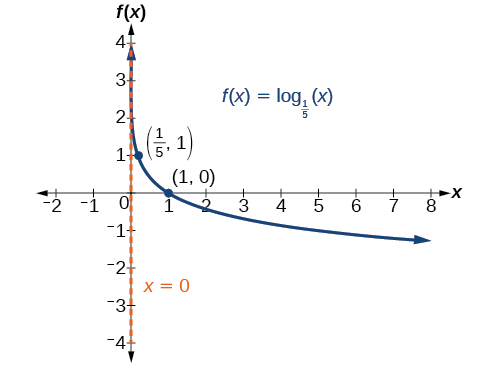
The domain is the range is and the vertical asymptote is
Try It #4 §6.4 source ↗
Answer
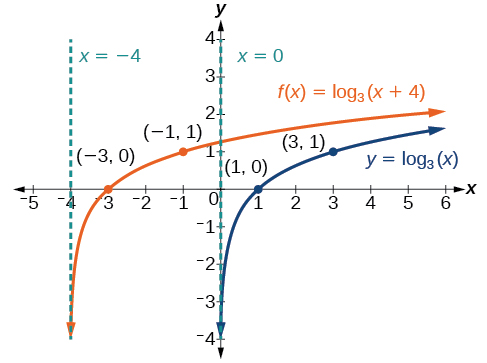
The domain is the range and the asymptote
Try It #5 §6.4 source ↗
Answer
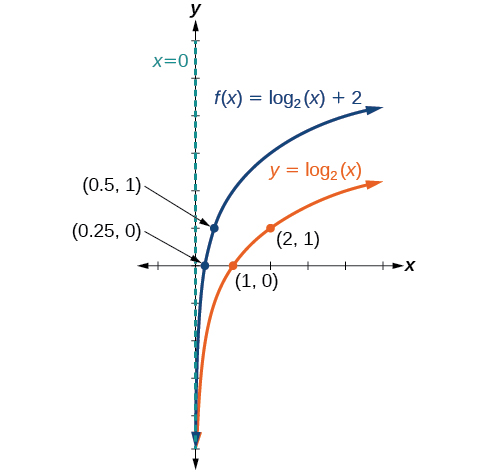
The domain is the range is and the vertical asymptote is
Try It #6 §6.4 source ↗
Answer
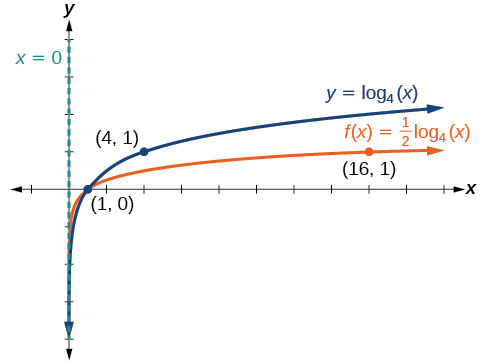
The domain is the range is and the vertical asymptote is
Try It #7 §6.4 source ↗
Answer
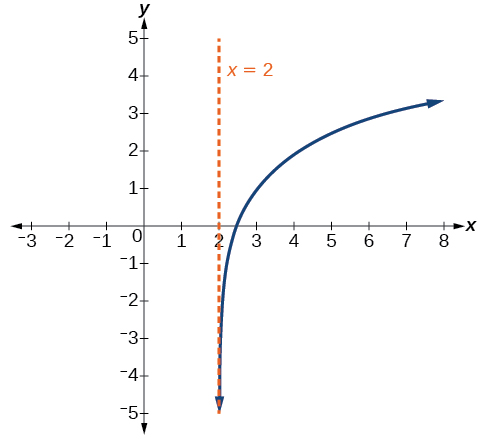
The domain is the range is and the vertical asymptote is
Try It #8 §6.4 source ↗
Answer
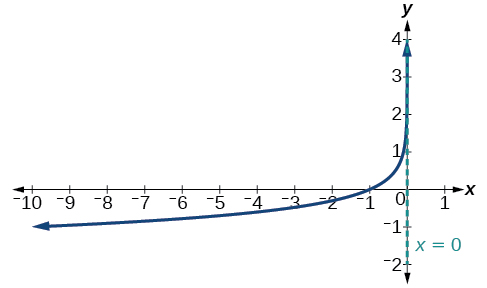
The domain is the range is and the vertical asymptote is
Try It #9 §6.4 source ↗
Answer
Try It #10 §6.4 source ↗
Answer
Try It #11 §6.4 source ↗
Give the equation of the natural logarithm graphed in Figure 16.
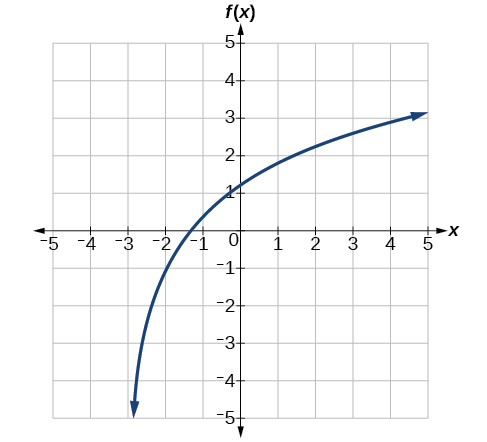 Figure 16
Answer
6.4-1 §6.4 source ↗
Answer
6.4-3 §6.4 source ↗
Answer
6.4-5 §6.4 source ↗
Answer
6.4-7 §6.4 source ↗
For the following exercises, state the domain and range of the function.
Answer
6.4-9 §6.4 source ↗
For the following exercises, state the domain and range of the function.
Answer
6.4-11 §6.4 source ↗
For the following exercises, state the domain and the vertical asymptote of the function.
Answer
6.4-13 §6.4 source ↗
For the following exercises, state the domain and the vertical asymptote of the function.
Answer
6.4-15 §6.4 source ↗
For the following exercises, state the domain and the vertical asymptote of the function.
Answer
6.4-17 §6.4 source ↗
For the following exercises, state the domain, vertical asymptote, and end behavior of the function.
Answer
Vertical asymptote: ; End behavior: as and as
6.4-19 §6.4 source ↗
For the following exercises, state the domain, vertical asymptote, and end behavior of the function.
Answer
End behavior: as , and as ,
6.4-21 §6.4 source ↗
For the following exercises, state the domain, range, and x- and y-intercepts, if they exist. If they do not exist, write DNE.
Answer
6.4-23 §6.4 source ↗
For the following exercises, state the domain, range, and x- and y-intercepts, if they exist. If they do not exist, write DNE.
Answer
6.4-25 §6.4 source ↗
For the following exercises, state the domain, range, and x- and y-intercepts, if they exist. If they do not exist, write DNE.
Answer
6.4-27 §6.4 source ↗
For the following exercises, match each function in Figure 17 with the letter corresponding to its graph.
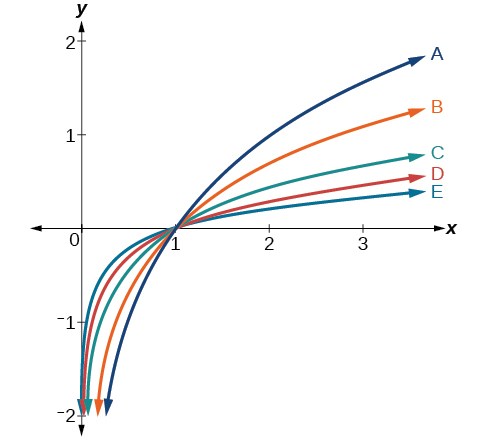 Figure 17
Answer
6.4-29 §6.4 source ↗
For the following exercises, match each function in Figure 17 with the letter corresponding to its graph.
Figure 17
Answer
6.4-31 §6.4 source ↗
For the following exercises, match each function in Figure 18 with the letter corresponding to its graph.
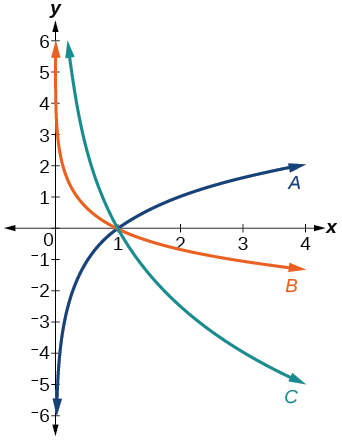 Figure 18
Answer
6.4-33 §6.4 source ↗
For the following exercises, match each function in Figure 18 with the letter corresponding to its graph.
Figure 18
Answer
6.4-35 §6.4 source ↗
For the following exercises, sketch the graphs of each pair of functions on the same axis.
and
Answer
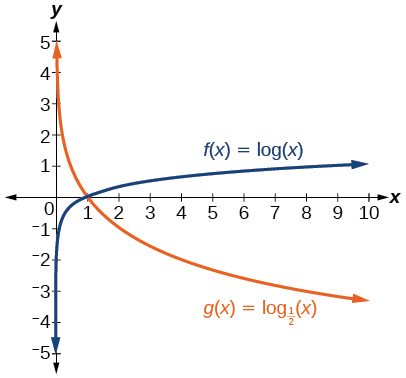
6.4-37 §6.4 source ↗
For the following exercises, sketch the graphs of each pair of functions on the same axis.
and
Answer
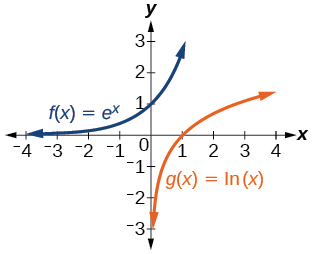
6.4-39 §6.4 source ↗
For the following exercises, match each function in Figure 19 with the letter corresponding to its graph.
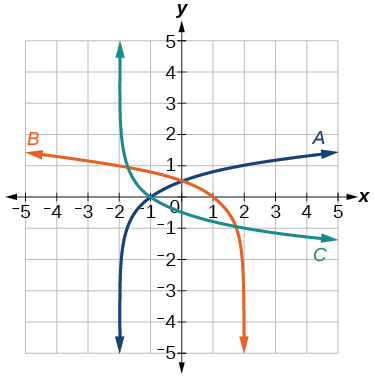 Figure 19
Answer
6.4-41 §6.4 source ↗
For the following exercises, sketch the graph of the indicated function.
Answer
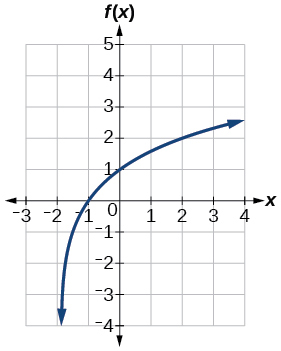
6.4-43 §6.4 source ↗
For the following exercises, sketch the graph of the indicated function.
Answer
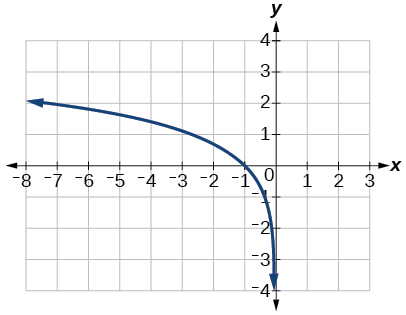
6.4-45 §6.4 source ↗
For the following exercises, sketch the graph of the indicated function.
Answer
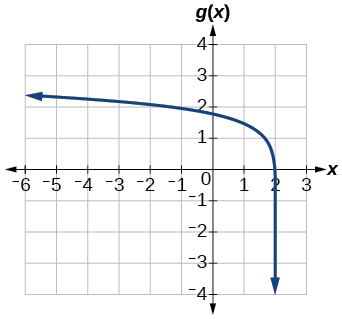
6.4-47 §6.4 source ↗
For the following exercises, write a logarithmic equation corresponding to the graph shown.
Use as the parent function.
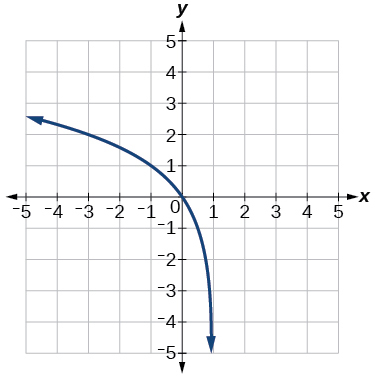
Answer
6.4-49 §6.4 source ↗
For the following exercises, write a logarithmic equation corresponding to the graph shown.
Use as the parent function.
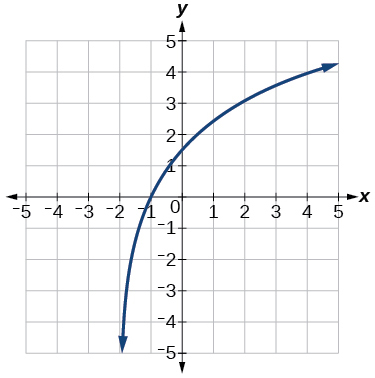
Answer
6.4-51 §6.4 source ↗
For the following exercises, use a graphing calculator to find approximate solutions to each equation.
Answer
6.4-53 §6.4 source ↗
For the following exercises, use a graphing calculator to find approximate solutions to each equation.
Answer
6.4-55 §6.4 source ↗
For the following exercises, use a graphing calculator to find approximate solutions to each equation.
Answer
6.4-57 §6.4 source ↗
For the following exercises, use a graphing calculator to find approximate solutions to each equation.
Explore and discuss the graphs of and Make a conjecture based on the result.
Answer
6.4-59 §6.4 source ↗
For the following exercises, use a graphing calculator to find approximate solutions to each equation.
What is the domain of the function Discuss the result.
Answer
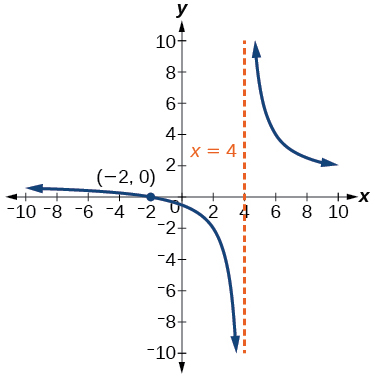
Recall that the argument of a logarithmic function must be positive, so we determine where . From the graph of the function note that the graph lies above the x-axis on the interval and again to the right of the vertical asymptote, that is Therefore, the domain is
Try It #1 §6.5 source ↗
Answer
Try It #2 §6.5 source ↗
Answer
Try It #3 §6.5 source ↗
Answer
Try It #4 §6.5 source ↗
Answer
Try It #5 §6.5 source ↗
Answer
Try It #6 §6.5 source ↗
Answer
Try It #7 §6.5 source ↗
Answer
Try It #8 §6.5 source ↗
Answer
Try It #9 §6.5 source ↗
Answer
Try It #10 §6.5 source ↗
Answer
Try It #11 §6.5 source ↗
Answer
Try It #12 §6.5 source ↗
Answer
Try It #13 §6.5 source ↗
Answer
Try It #14 §6.5 source ↗
Answer
6.5-1 §6.5 source ↗
Answer
6.5-3 §6.5 source ↗
For the following exercises, expand each logarithm as much as possible. Rewrite each expression as a sum, difference, or product of logs.
Answer
6.5-5 §6.5 source ↗
For the following exercises, expand each logarithm as much as possible. Rewrite each expression as a sum, difference, or product of logs.
Answer
6.5-7 §6.5 source ↗
For the following exercises, expand each logarithm as much as possible. Rewrite each expression as a sum, difference, or product of logs.
Answer
6.5-9 §6.5 source ↗
For the following exercises, condense to a single logarithm if possible.
Answer
6.5-11 §6.5 source ↗
For the following exercises, condense to a single logarithm if possible.
Answer
6.5-13 §6.5 source ↗
For the following exercises, condense to a single logarithm if possible.
Answer
6.5-15 §6.5 source ↗
For the following exercises, use the properties of logarithms to expand each logarithm as much as possible. Rewrite each expression as a sum, difference, or product of logs.
Answer
6.5-17 §6.5 source ↗
For the following exercises, use the properties of logarithms to expand each logarithm as much as possible. Rewrite each expression as a sum, difference, or product of logs.
Answer
6.5-19 §6.5 source ↗
For the following exercises, use the properties of logarithms to expand each logarithm as much as possible. Rewrite each expression as a sum, difference, or product of logs.
Answer
6.5-21 §6.5 source ↗
For the following exercises, condense each expression to a single logarithm using the properties of logarithms.
Answer
6.5-23 §6.5 source ↗
For the following exercises, condense each expression to a single logarithm using the properties of logarithms.
Answer
6.5-25 §6.5 source ↗
For the following exercises, rewrite each expression as an equivalent ratio of logs using the indicated base.
to base
Answer
6.5-27 §6.5 source ↗
For the following exercises, suppose and Use the change-of-base formula along with properties of logarithms to rewrite each expression in terms of and Show the steps for solving.
Answer
6.5-29 §6.5 source ↗
For the following exercises, suppose and Use the change-of-base formula along with properties of logarithms to rewrite each expression in terms of and Show the steps for solving.
Answer
6.5-31 §6.5 source ↗
For the following exercises, use properties of logarithms to evaluate without using a calculator.
Answer
6.5-33 §6.5 source ↗
For the following exercises, use the change-of-base formula to evaluate each expression as a quotient of natural logs. Use a calculator to approximate each to five decimal places.
Answer
6.5-35 §6.5 source ↗
For the following exercises, use the change-of-base formula to evaluate each expression as a quotient of natural logs. Use a calculator to approximate each to five decimal places.
Answer
6.5-37 §6.5 source ↗
For the following exercises, use the change-of-base formula to evaluate each expression as a quotient of natural logs. Use a calculator to approximate each to five decimal places.
Answer
6.5-39 §6.5 source ↗
For the following exercises, use the change-of-base formula to evaluate each expression as a quotient of natural logs. Use a calculator to approximate each to five decimal places.
Use the quotient rule for logarithms to find all values such that Show the steps for solving.
Answer
By the quotient rule:
Rewriting as an exponential equation and solving for
Checking, we find that is defined, so
6.5-41 §6.5 source ↗
For the following exercises, use the change-of-base formula to evaluate each expression as a quotient of natural logs. Use a calculator to approximate each to five decimal places.
Prove that for any positive integers and
Answer
Try It #1 §6.6 source ↗
Answer
Try It #2 §6.6 source ↗
Answer
Try It #3 §6.6 source ↗
Answer
Try It #4 §6.6 source ↗
Answer
Try It #5 §6.6 source ↗
Answer
Try It #6 §6.6 source ↗
Answer
Try It #7 §6.6 source ↗
Answer
Try It #8 §6.6 source ↗
Answer
Try It #9 §6.6 source ↗
Answer
Try It #10 §6.6 source ↗
Answer
Try It #11 §6.6 source ↗
Answer
Try It #12 §6.6 source ↗
Answer
Try It #13 §6.6 source ↗
Answer
6.6-1 §6.6 source ↗
Answer
6.6-3 §6.6 source ↗
Answer
6.6-5 §6.6 source ↗
For the following exercises, use like bases to solve the exponential equation.
Answer
6.6-7 §6.6 source ↗
For the following exercises, use like bases to solve the exponential equation.
Answer
6.6-9 §6.6 source ↗
For the following exercises, use like bases to solve the exponential equation.
Answer
6.6-11 §6.6 source ↗
For the following exercises, use logarithms to solve.
Answer
6.6-13 §6.6 source ↗
For the following exercises, use logarithms to solve.
Answer
6.6-15 §6.6 source ↗
For the following exercises, use logarithms to solve.
Answer
6.6-17 §6.6 source ↗
For the following exercises, use logarithms to solve.
Answer
6.6-19 §6.6 source ↗
For the following exercises, use logarithms to solve.
Answer
6.6-21 §6.6 source ↗
For the following exercises, use logarithms to solve.
Answer
6.6-23 §6.6 source ↗
For the following exercises, use logarithms to solve.
Answer
6.6-25 §6.6 source ↗
For the following exercises, use logarithms to solve.
Answer
6.6-27 §6.6 source ↗
For the following exercises, use logarithms to solve.
Answer
6.6-29 §6.6 source ↗
For the following exercises, use the definition of a logarithm to rewrite the equation as an exponential equation.
Answer
6.6-31 §6.6 source ↗
For the following exercises, use the definition of a logarithm to solve the equation.
Answer
6.6-33 §6.6 source ↗
For the following exercises, use the definition of a logarithm to solve the equation.
Answer
6.6-35 §6.6 source ↗
For the following exercises, use the definition of a logarithm to solve the equation.
Answer
6.6-37 §6.6 source ↗
For the following exercises, use the one-to-one property of logarithms to solve.
Answer
6.6-39 §6.6 source ↗
For the following exercises, use the one-to-one property of logarithms to solve.
Answer
6.6-41 §6.6 source ↗
For the following exercises, use the one-to-one property of logarithms to solve.
Answer
6.6-43 §6.6 source ↗
For the following exercises, use the one-to-one property of logarithms to solve.
Answer
6.6-45 §6.6 source ↗
For the following exercises, solve each equation for
Answer
6.6-47 §6.6 source ↗
For the following exercises, solve each equation for
Answer
6.6-49 §6.6 source ↗
For the following exercises, solve each equation for
Answer
6.6-51 §6.6 source ↗
For the following exercises, solve the equation for if there is a solution. Then graph both sides of the equation, and observe the point of intersection (if it exists) to verify the solution.
Answer
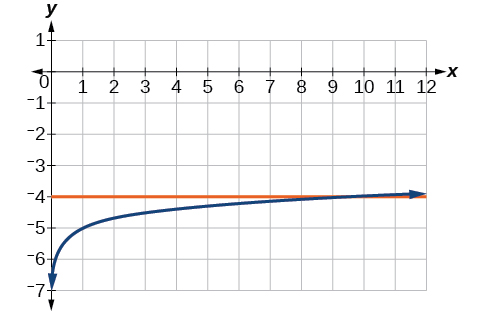
6.6-53 §6.6 source ↗
For the following exercises, solve the equation for if there is a solution. Then graph both sides of the equation, and observe the point of intersection (if it exists) to verify the solution.
Answer
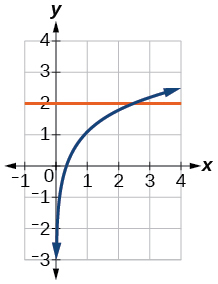
6.6-55 §6.6 source ↗
For the following exercises, solve the equation for if there is a solution. Then graph both sides of the equation, and observe the point of intersection (if it exists) to verify the solution.
Answer
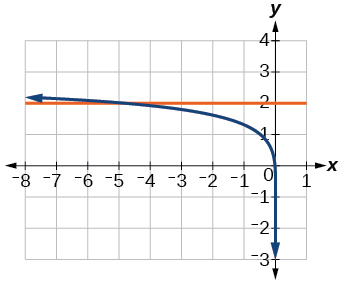
6.6-57 §6.6 source ↗
For the following exercises, solve the equation for if there is a solution. Then graph both sides of the equation, and observe the point of intersection (if it exists) to verify the solution.
Answer
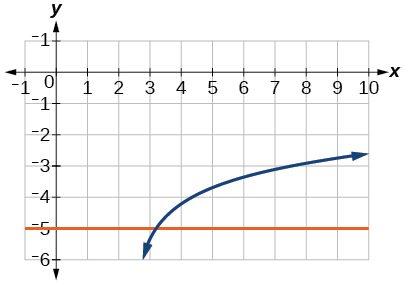
6.6-59 §6.6 source ↗
For the following exercises, solve the equation for if there is a solution. Then graph both sides of the equation, and observe the point of intersection (if it exists) to verify the solution.
Answer
No solution
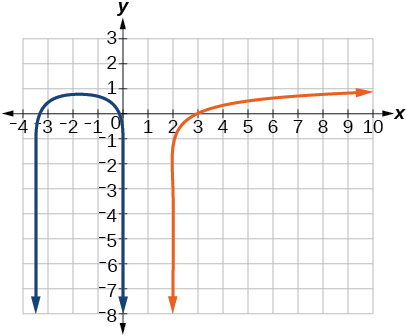
6.6-61 §6.6 source ↗
For the following exercises, solve the equation for if there is a solution. Then graph both sides of the equation, and observe the point of intersection (if it exists) to verify the solution.
Answer
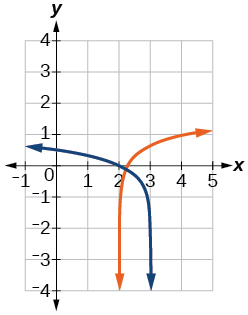
6.6-63 §6.6 source ↗
For the following exercises, solve the equation for if there is a solution. Then graph both sides of the equation, and observe the point of intersection (if it exists) to verify the solution.
Answer
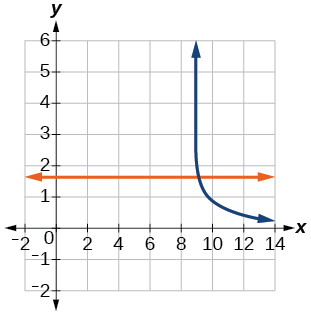
6.6-65 §6.6 source ↗
For the following exercises, solve for the indicated value, and graph the situation showing the solution point.
An account with an initial deposit of earns annual interest, compounded continuously. How much will the account be worth after 20 years?
Answer
about
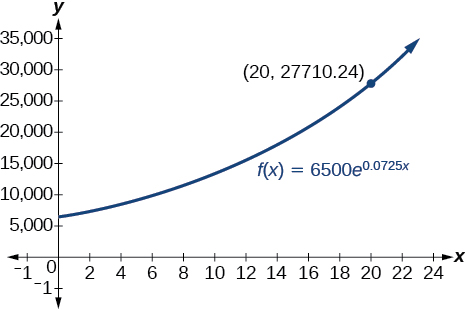
6.6-67 §6.6 source ↗
For the following exercises, solve for the indicated value, and graph the situation showing the solution point.
The population of a small town is modeled by the equation where is measured in years. In approximately how many years will the town’s population reach
Answer
about 5 years
6.6-69 §6.6 source ↗
For the following exercises, solve each equation by rewriting the exponential expression using the indicated logarithm. Then use a calculator to approximate the variable to 3 decimal places.
using the natural log
Answer
6.6-71 §6.6 source ↗
For the following exercises, solve each equation by rewriting the exponential expression using the indicated logarithm. Then use a calculator to approximate the variable to 3 decimal places.
using the common log
Answer
6.6-73 §6.6 source ↗
For the following exercises, use a calculator to solve the equation. Unless indicated otherwise, round all answers to the nearest ten-thousandth.
Answer
6.6-75 §6.6 source ↗
For the following exercises, use a calculator to solve the equation. Unless indicated otherwise, round all answers to the nearest ten-thousandth.
Answer
6.6-77 §6.6 source ↗
For the following exercises, use a calculator to solve the equation. Unless indicated otherwise, round all answers to the nearest ten-thousandth.
The magnitude M of an earthquake is represented by the equation where is the amount of energy released by the earthquake in joules and is the assigned minimal measure released by an earthquake. To the nearest hundredth, what would the magnitude be of an earthquake releasing joules of energy?
Answer
6.6-79 §6.6 source ↗
For the following exercises, use a calculator to solve the equation. Unless indicated otherwise, round all answers to the nearest ten-thousandth.
Recall the formula for continually compounding interest, Use the definition of a logarithm along with properties of logarithms to solve the formula for time such that is equal to a single logarithm.
Answer
6.6-81 §6.6 source ↗
For the following exercises, use a calculator to solve the equation. Unless indicated otherwise, round all answers to the nearest ten-thousandth.
Newton’s Law of Cooling states that the temperature of an object at any time t can be described by the equation where is the temperature of the surrounding environment, is the initial temperature of the object, and is the cooling rate. Use the definition of a logarithm along with properties of logarithms to solve the formula for time such that is equal to a single logarithm.
Answer
Try It #1 §6.7 source ↗
Answer
Try It #2 §6.7 source ↗
Answer
Try It #3 §6.7 source ↗
Answer
Try It #4 §6.7 source ↗
Answer
Try It #5 §6.7 source ↗
Answer
Try It #6 §6.7 source ↗
Does a linear, exponential, or logarithmic model best fit the data in Table 2? Find the model.
| 1 | 2 | 3 | 4 | 5 | 6 | 7 | 8 | 9 | |
| 3.297 | 5.437 | 8.963 | 14.778 | 24.365 | 40.172 | 66.231 | 109.196 | 180.034 |
Answer
Try It #7 §6.7 source ↗
Answer
6.7-1 §6.7 source ↗
Answer
6.7-3 §6.7 source ↗
Answer
6.7-5 §6.7 source ↗
Answer
6.7-7 §6.7 source ↗
For the following exercises, use the logistic growth model
Find and interpret Round to the nearest tenth.
Answer
6.7-9 §6.7 source ↗
For the following exercises, use the logistic growth model
Find the carrying capacity.
Answer
6.7-11 §6.7 source ↗
For the following exercises, use the logistic growth model
Determine whether the data from the table could best be represented as a function that is linear, exponential, or logarithmic. Then write a formula for a model that represents the data.
| –2 | 0.694 |
| –1 | 0.833 |
| 0 | 1 |
| 1 | 1.2 |
| 2 | 1.44 |
| 3 | 1.728 |
| 4 | 2.074 |
| 5 | 2.488 |
Answer
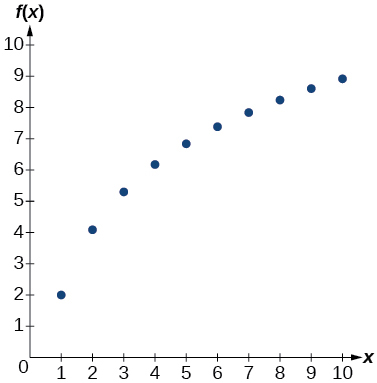
6.7-13 §6.7 source ↗
For the following exercises, enter the data from each table into a graphing calculator and graph the resulting scatter plots. Determine whether the data from the table could represent a function that is linear, exponential, or logarithmic.
| 1 | 2 |
| 2 | 4.079 |
| 3 | 5.296 |
| 4 | 6.159 |
| 5 | 6.828 |
| 6 | 7.375 |
| 7 | 7.838 |
| 8 | 8.238 |
| 9 | 8.592 |
| 10 | 8.908 |
Answer
logarithmic
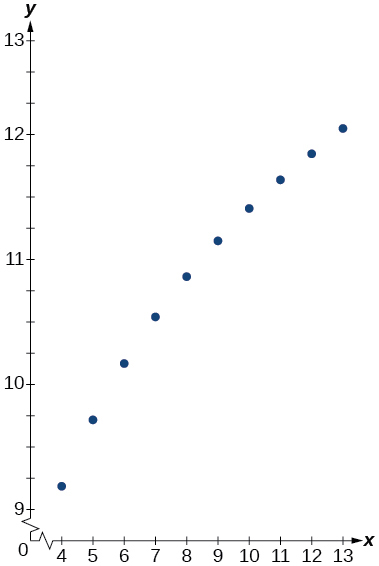
6.7-15 §6.7 source ↗
For the following exercises, enter the data from each table into a graphing calculator and graph the resulting scatter plots. Determine whether the data from the table could represent a function that is linear, exponential, or logarithmic.
| 4 | 9.429 |
| 5 | 9.972 |
| 6 | 10.415 |
| 7 | 10.79 |
| 8 | 11.115 |
| 9 | 11.401 |
| 10 | 11.657 |
| 11 | 11.889 |
| 12 | 12.101 |
| 13 | 12.295 |
Answer
logarithmic
6.7-17 §6.7 source ↗
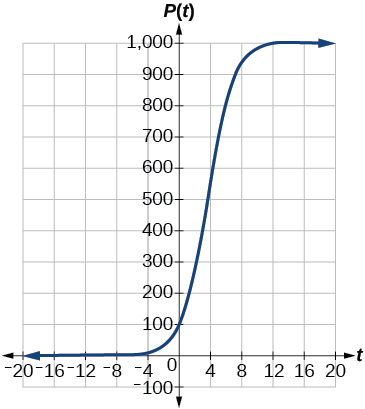
For the following exercises, use a graphing calculator and this scenario: the population of a fish farm in years is modeled by the equation
Graph the function.
Answer
6.7-19 §6.7 source ↗
For the following exercises, use a graphing calculator and this scenario: the population of a fish farm in years is modeled by the equation
To the nearest tenth, what is the doubling time for the fish population?
Answer
6.7-21 §6.7 source ↗
For the following exercises, use a graphing calculator and this scenario: the population of a fish farm in years is modeled by the equation
To the nearest tenth, how long will it take for the population to reach
Answer
6.7-23 §6.7 source ↗
For the following exercises, use a graphing calculator and this scenario: the population of a fish farm in years is modeled by the equation
A substance has a half-life of 2.045 minutes. If the initial amount of the substance was 132.8 grams, how many half-lives will have passed before the substance decays to 8.3 grams? What is the total time of decay?
Answer
6.7-25 §6.7 source ↗
For the following exercises, use a graphing calculator and this scenario: the population of a fish farm in years is modeled by the equation
Recall the formula for calculating the magnitude of an earthquake, Show each step for solving this equation algebraically for the seismic moment
Answer
6.7-27 §6.7 source ↗
For the following exercises, use a graphing calculator and this scenario: the population of a fish farm in years is modeled by the equation
Prove that for positive
Answer
Let for some non-negative real number such that Then,
6.7-29 §6.7 source ↗
For the following exercises, use this scenario: A doctor prescribes 125 milligrams of a therapeutic drug that decays by about 30% each hour.
Write an exponential model representing the amount of the drug remaining in the patient’s system after hours. Then use the formula to find the amount of the drug that would remain in the patient’s system after 3 hours. Round to the nearest milligram.
Answer
6.7-31 §6.7 source ↗
For the following exercises, use this scenario: A tumor is injected with grams of Iodine-125, which has a decay rate of per day.
To the nearest day, how long will it take for half of the Iodine-125 to decay?
Answer
6.7-33 §6.7 source ↗
For the following exercises, use this scenario: A tumor is injected with grams of Iodine-125, which has a decay rate of per day.
A scientist begins with grams of a radioactive substance. After minutes, the sample has decayed to grams. Rounding to five decimal places, write an exponential equation representing this situation. To the nearest minute, what is the half-life of this substance?
Answer
6.7-35 §6.7 source ↗
For the following exercises, use this scenario: A tumor is injected with grams of Iodine-125, which has a decay rate of per day.
The half-life of Erbium-165 is hours. What is the hourly decay rate? Express the decimal result to four decimal places and the percentage to two decimal places.
Answer
6.7-37 §6.7 source ↗
For the following exercises, use this scenario: A tumor is injected with grams of Iodine-125, which has a decay rate of per day.
A research student is working with a culture of bacteria that doubles in size every twenty minutes. The initial population count was bacteria. Rounding to five decimal places, write an exponential equation representing this situation. To the nearest whole number, what is the population size after hours?
Answer
6.7-39 §6.7 source ↗
For the following exercises, use this scenario: A biologist recorded a count of bacteria present in a culture after 5 minutes and 1000 bacteria present after 20 minutes.
Rounding to six decimal places, write an exponential equation representing this situation. To the nearest minute, how long did it take the population to double?
Answer
6.7-41 §6.7 source ↗
For the following exercises, use this scenario: A pot of warm soup with an internal temperature of Fahrenheit was taken off the stove to cool in a room. After fifteen minutes, the internal temperature of the soup was
To the nearest minute, how long will it take the soup to cool to
Answer
6.7-43 §6.7 source ↗
For the following exercises, use this scenario: A turkey is taken out of the oven with an internal temperature of and is allowed to cool in a room. After half an hour, the internal temperature of the turkey is
Write a formula that models this situation.
Answer
6.7-45 §6.7 source ↗
For the following exercises, use this scenario: A turkey is taken out of the oven with an internal temperature of and is allowed to cool in a room. After half an hour, the internal temperature of the turkey is
To the nearest minute, how long will it take the turkey to cool to
Answer
6.7-47 §6.7 source ↗
For the following exercises, find the value of the number shown on each logarithmic scale. Round all answers to the nearest thousandth.

Answer
6.7-49 §6.7 source ↗
For the following exercises, find the value of the number shown on each logarithmic scale. Round all answers to the nearest thousandth.
Recall the formula for calculating the magnitude of an earthquake, One earthquake has magnitude on the MMS scale. If a second earthquake has times as much energy as the first, find the magnitude of the second quake. Round to the nearest hundredth.
Answer
6.7-51 §6.7 source ↗
For the following exercises, use this scenario: The equation models the number of people in a town who have heard a rumor after t days.
To the nearest whole number, how many people will have heard the rumor after 3 days?
Answer
6.7-53 §6.7 source ↗
For the following exercise, choose the correct answer choice.
A doctor injects a patient with 13 milligrams of radioactive dye that decays exponentially. After 12 minutes, there are 4.75 milligrams of dye remaining in the patient’s system. Which is an appropriate model for this situation?
ⓐ
ⓑ
ⓒ
ⓓ
Answer
Try It #1 §6.8 source ↗
Table 2 shows a recent graduate’s credit card balance each month after graduation.
| Month | 1 | 2 | 3 | 4 | 5 | 6 | 7 | 8 |
| Debt ($) | 620.00 | 761.88 | 899.80 | 1039.93 | 1270.63 | 1589.04 | 1851.31 | 2154.92 |
ⓐ Use exponential regression to fit a model to these data.
ⓑ If spending continues at this rate, what will the graduate’s credit card debt be one year after graduating?
Answer
ⓐ The exponential regression model that fits these data is
ⓑ If spending continues at this rate, the graduate’s credit card debt will be $4,499.38 after one year.
Try It #2 §6.8 source ↗
Sales of a video game released in the year 2000 took off at first, but then steadily slowed as time moved on. Table 4 shows the number of games sold, in thousands, from the years 2000–2010.
| Year | 2000 | 2001 | 2002 | 2003 | 2004 | 2005 |
| Number Sold (thousands) | 142 | 149 | 154 | 155 | 159 | 161 |
| Year | 2006 | 2007 | 2008 | 2009 | 2010 | - |
| Number Sold (thousands) | 163 | 164 | 164 | 166 | 167 | - |
ⓐ Let represent time in years starting with for the year 2000. Let represent the number of games sold in thousands. Use logarithmic regression to fit a model to these data.
ⓑ If games continue to sell at this rate, how many games will sell in 2015? Round to the nearest thousand.
Answer
ⓐ The logarithmic regression model that fits these data is
ⓑ If sales continue at this rate, about 171,000 games will be sold in the year 2015.
Try It #3 §6.8 source ↗
Table 6 shows the population, in thousands, of harbor seals in the Wadden Sea over the years 1997 to 2012.
| Year | Seal Population (Thousands) | Year | Seal Population (Thousands) |
|---|---|---|---|
| 1997 | 3.493 | 2005 | 19.590 |
| 1998 | 5.282 | 2006 | 21.955 |
| 1999 | 6.357 | 2007 | 22.862 |
| 2000 | 9.201 | 2008 | 23.869 |
| 2001 | 11.224 | 2009 | 24.243 |
| 2002 | 12.964 | 2010 | 24.344 |
| 2003 | 16.226 | 2011 | 24.919 |
| 2004 | 18.137 | 2012 | 25.108 |
ⓐ Let represent time in years starting with for the year 1997. Let represent the number of seals in thousands. Use logistic regression to fit a model to these data.
ⓑ Use the model to predict the seal population for the year 2020.
ⓒ To the nearest whole number, what is the limiting value of this model?
Answer
ⓐ The logistic regression model that fits these data is
ⓑ If the population continues to grow at this rate, there will be about seals in 2020.
ⓒ To the nearest whole number, the carrying capacity is 25,657.
6.8-1 §6.8 source ↗
Answer
6.8-3 §6.8 source ↗
Answer
6.8-5 §6.8 source ↗
Answer
6.8-7 §6.8 source ↗
For the following exercises, match the given function of best fit with the appropriate scatterplot in Figure 7 through Figure 11. Answer using the letter beneath the matching graph.
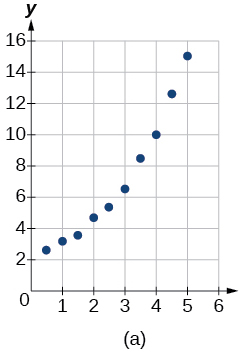 Figure 7
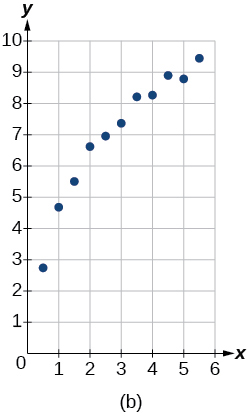 Figure 8
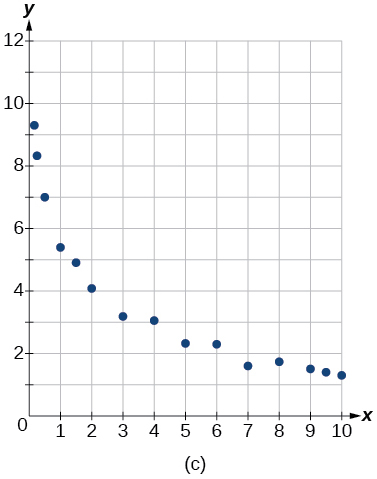 Figure 9
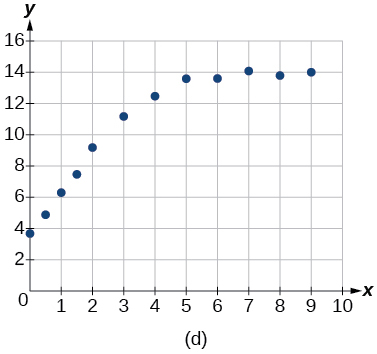 Figure 10
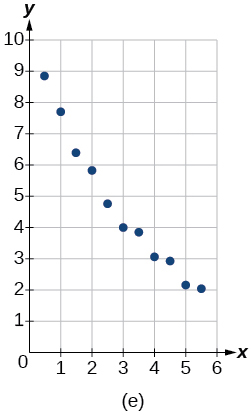 Figure 11
Answer
6.8-9 §6.8 source ↗
For the following exercises, match the given function of best fit with the appropriate scatterplot in Figure 7 through Figure 11. Answer using the letter beneath the matching graph.
Figure 7 Figure 8 Figure 9 Figure 10 Figure 11
Answer
6.8-11 §6.8 source ↗
For the following exercises, match the given function of best fit with the appropriate scatterplot in Figure 7 through Figure 11. Answer using the letter beneath the matching graph.
Figure 7 Figure 8 Figure 9 Figure 10 Figure 11 To the nearest whole number, what is the initial value of a population modeled by the logistic equation What is the carrying capacity?
Answer
6.8-13 §6.8 source ↗
For the following exercises, match the given function of best fit with the appropriate scatterplot in Figure 7 through Figure 11. Answer using the letter beneath the matching graph.
Figure 7 Figure 8 Figure 9 Figure 10 Figure 11 A logarithmic model is given by the equation To the nearest hundredth, for what value of does
Answer
6.8-15 §6.8 source ↗
For the following exercises, match the given function of best fit with the appropriate scatterplot in Figure 7 through Figure 11. Answer using the letter beneath the matching graph.
Figure 7 Figure 8 Figure 9 Figure 10 Figure 11 What is the y-intercept on the graph of the logistic model given in the previous exercise?
Answer
6.8-17 §6.8 source ↗
For the following exercises, use this scenario: The population of a koi pond over months is modeled by the function
What was the initial population of koi?
Answer
6.8-19 §6.8 source ↗
For the following exercises, use this scenario: The population of a koi pond over months is modeled by the function
How many months will it take before there are koi in the pond?
Answer
6.8-21 §6.8 source ↗
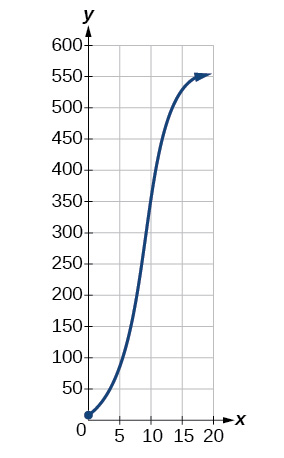
For the following exercises, use this scenario: The population of an endangered species habitat for wolves is modeled by the function where is given in years.
Graph the population model to show the population over a span of years.
Answer
6.8-23 §6.8 source ↗
For the following exercises, use this scenario: The population of an endangered species habitat for wolves is modeled by the function where is given in years.
How many wolves will the habitat have after years?
Answer
6.8-25 §6.8 source ↗
For the following exercises, use this scenario: The population of an endangered species habitat for wolves is modeled by the function where is given in years.
Use the intersect feature to approximate the number of years it will take before the population of the habitat reaches half its carrying capacity.
Answer
6.8-27 §6.8 source ↗
For the following exercises, refer to Table 7.
| x | 1 | 2 | 3 | 4 | 5 | 6 |
| f(x) | 1125 | 1495 | 2310 | 3294 | 4650 | 6361 |
Use the regression feature to find an exponential function that best fits the data in the table.
Answer
6.8-29 §6.8 source ↗
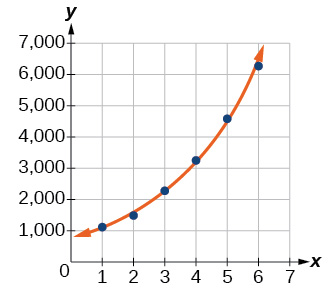
For the following exercises, refer to Table 7.
| x | 1 | 2 | 3 | 4 | 5 | 6 |
| f(x) | 1125 | 1495 | 2310 | 3294 | 4650 | 6361 |
Graph the exponential equation on the scatter diagram.
Answer
6.8-31 §6.8 source ↗
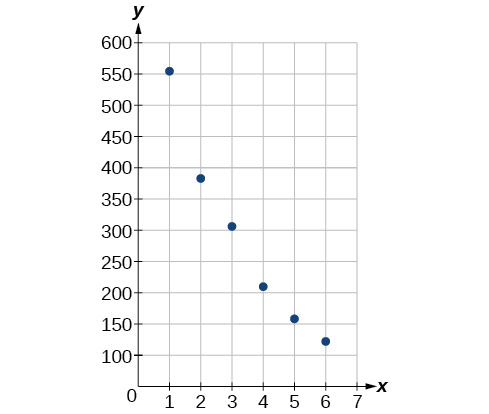
For the following exercises, refer to Table 8.
| x | 1 | 2 | 3 | 4 | 5 | 6 |
| f(x) | 555 | 383 | 307 | 210 | 158 | 122 |
Use a graphing calculator to create a scatter diagram of the data.
Answer
6.8-33 §6.8 source ↗
For the following exercises, refer to Table 8.
| x | 1 | 2 | 3 | 4 | 5 | 6 |
| f(x) | 555 | 383 | 307 | 210 | 158 | 122 |
Write the exponential function as an exponential equation with base
Answer
6.8-35 §6.8 source ↗
For the following exercises, refer to Table 8.
| x | 1 | 2 | 3 | 4 | 5 | 6 |
| f(x) | 555 | 383 | 307 | 210 | 158 | 122 |
Use the intersect feature to find the value of for which
Answer
6.8-37 §6.8 source ↗
For the following exercises, refer to Table 9.
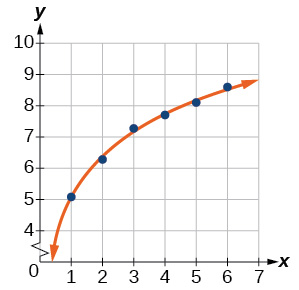
| x | 1 | 2 | 3 | 4 | 5 | 6 |
| f(x) | 5.1 | 6.3 | 7.3 | 7.7 | 8.1 | 8.6 |
Use the LOGarithm option of the REGression feature to find a logarithmic function of the form that best fits the data in the table.
Answer
6.8-39 §6.8 source ↗
For the following exercises, refer to Table 9.
| x | 1 | 2 | 3 | 4 | 5 | 6 |
| f(x) | 5.1 | 6.3 | 7.3 | 7.7 | 8.1 | 8.6 |
Graph the logarithmic equation on the scatter diagram.
Answer
6.8-41 §6.8 source ↗
For the following exercises, refer to Table 10.
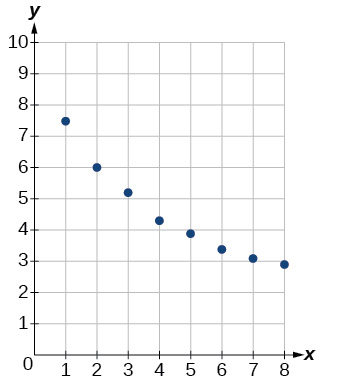
| x | 1 | 2 | 3 | 4 | 5 | 6 | 7 | 8 |
| f(x) | 7.5 | 6 | 5.2 | 4.3 | 3.9 | 3.4 | 3.1 | 2.9 |
Use a graphing calculator to create a scatter diagram of the data.
Answer
6.8-43 §6.8 source ↗
For the following exercises, refer to Table 10.
| x | 1 | 2 | 3 | 4 | 5 | 6 | 7 | 8 |
| f(x) | 7.5 | 6 | 5.2 | 4.3 | 3.9 | 3.4 | 3.1 | 2.9 |
Use the logarithmic function to find the value of the function when
Answer
6.8-45 §6.8 source ↗
For the following exercises, refer to Table 10.
| x | 1 | 2 | 3 | 4 | 5 | 6 | 7 | 8 |
| f(x) | 7.5 | 6 | 5.2 | 4.3 | 3.9 | 3.4 | 3.1 | 2.9 |
Use the intersect feature to find the value of for which
Answer
6.8-47 §6.8 source ↗
For the following exercises, refer to Table 11.
| x | 1 | 2 | 3 | 4 | 5 | 6 | 7 | 8 | 9 | 10 |
| f(x) | 8.7 | 12.3 | 15.4 | 18.5 | 20.7 | 22.5 | 23.3 | 24 | 24.6 | 24.8 |
Use the LOGISTIC regression option to find a logistic growth model of the form that best fits the data in the table.
Answer
6.8-49 §6.8 source ↗
For the following exercises, refer to Table 11.
| x | 1 | 2 | 3 | 4 | 5 | 6 | 7 | 8 | 9 | 10 |
| f(x) | 8.7 | 12.3 | 15.4 | 18.5 | 20.7 | 22.5 | 23.3 | 24 | 24.6 | 24.8 |
To the nearest whole number, what is the predicted carrying capacity of the model?
Answer
6.8-51 §6.8 source ↗
For the following exercises, refer to Table 12.
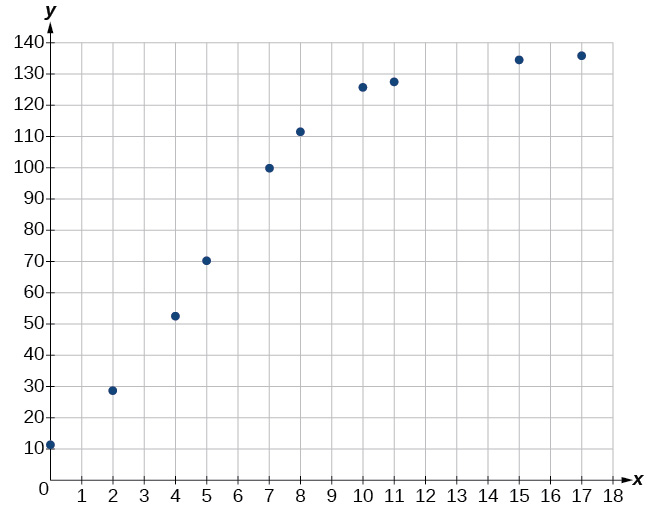
| 0 | 2 | 4 | 5 | 7 | 8 | 10 | 11 | 15 | 17 | |
| 12 | 28.6 | 52.8 | 70.3 | 99.9 | 112.5 | 125.8 | 127.9 | 135.1 | 135.9 |
Use a graphing calculator to create a scatter diagram of the data.
Answer
6.8-53 §6.8 source ↗
For the following exercises, refer to Table 12.
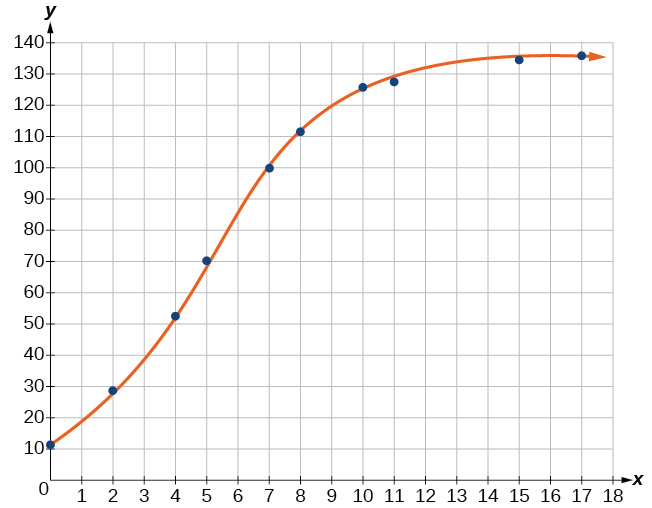
| 0 | 2 | 4 | 5 | 7 | 8 | 10 | 11 | 15 | 17 | |
| 12 | 28.6 | 52.8 | 70.3 | 99.9 | 112.5 | 125.8 | 127.9 | 135.1 | 135.9 |
Graph the logistic equation on the scatter diagram.
Answer
6.8-55 §6.8 source ↗
For the following exercises, refer to Table 12.
| 0 | 2 | 4 | 5 | 7 | 8 | 10 | 11 | 15 | 17 | |
| 12 | 28.6 | 52.8 | 70.3 | 99.9 | 112.5 | 125.8 | 127.9 | 135.1 | 135.9 |
Use the intersect feature to find the value of for which the model reaches half its carrying capacity.
Answer
6.8-57 §6.8 source ↗
For the following exercises, refer to Table 12.
| 0 | 2 | 4 | 5 | 7 | 8 | 10 | 11 | 15 | 17 | |
| 12 | 28.6 | 52.8 | 70.3 | 99.9 | 112.5 | 125.8 | 127.9 | 135.1 | 135.9 |
Use a graphing utility to find an exponential regression formula and a logarithmic regression formula for the points and Round all numbers to 6 decimal places. Graph the points and both formulas along with the line on the same axis. Make a conjecture about the relationship of the regression formulas.
Answer
6.8-59 §6.8 source ↗
For the following exercises, refer to Table 12.
| 0 | 2 | 4 | 5 | 7 | 8 | 10 | 11 | 15 | 17 | |
| 12 | 28.6 | 52.8 | 70.3 | 99.9 | 112.5 | 125.8 | 127.9 | 135.1 | 135.9 |
Find the inverse function for the logistic function Show all steps.
Answer
6.R-1 §6.R source ↗
Answer
6.R-3 §6.R source ↗
Answer
6.R-5 §6.R source ↗
Answer
6.R-7 §6.R source ↗
Answer
6.R-9 §6.R source ↗
Answer
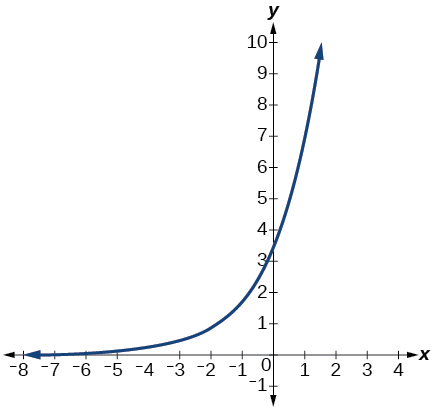
domain: all real numbers; range: all real numbers strictly greater than zero; y-intercept: (0, 3.5);
6.R-11 §6.R source ↗
Answer
6.R-13 §6.R source ↗
Answer
6.R-15 §6.R source ↗
Answer
6.R-17 §6.R source ↗
Answer
6.R-19 §6.R source ↗
Answer
6.R-21 §6.R source ↗
Answer
6.R-23 §6.R source ↗
Answer
6.R-25 §6.R source ↗
Answer
6.R-27 §6.R source ↗
Answer
6.R-29 §6.R source ↗
Answer
6.R-31 §6.R source ↗
Answer
6.R-33 §6.R source ↗
Answer
6.R-35 §6.R source ↗
Answer
6.R-37 §6.R source ↗
Answer
6.R-39 §6.R source ↗
Answer
6.R-41 §6.R source ↗
Answer
6.R-43 §6.R source ↗
Answer
6.R-45 §6.R source ↗
Answer
6.R-47 §6.R source ↗
Answer
6.R-49 §6.R source ↗
Answer
6.R-51 §6.R source ↗
Answer
6.R-53 §6.R source ↗
Answer
6.R-55 §6.R source ↗
For the following exercises, use this scenario: A doctor prescribes milligrams of a therapeutic drug that decays by about each hour.
Write an exponential model representing the amount of the drug remaining in the patient’s system after hours. Then use the formula to find the amount of the drug that would remain in the patient’s system after hours. Round to the nearest hundredth of a gram.
Answer
6.R-57 §6.R source ↗
For the following exercises, use this scenario: A soup with an internal temperature of Fahrenheit was taken off the stove to cool in a room. After fifteen minutes, the internal temperature of the soup was
How many minutes will it take the soup to cool to
Answer
6.R-59 §6.R source ↗
For the following exercises, use this scenario: The equation models the number of people in a school who have heard a rumor after days.
To the nearest tenth, how many days will it be before the rumor spreads to half the carrying capacity?
Answer
6.R-61 §6.R source ↗
For the following exercises, enter the data from each table into a graphing calculator and graph the resulting scatter plots. Determine whether the data from the table would likely represent a function that is linear, exponential, or logarithmic.
| x | f(x) |
| 1 | 3.05 |
| 2 | 4.42 |
| 3 | 6.4 |
| 4 | 9.28 |
| 5 | 13.46 |
| 6 | 19.52 |
| 7 | 28.3 |
| 8 | 41.04 |
| 9 | 59.5 |
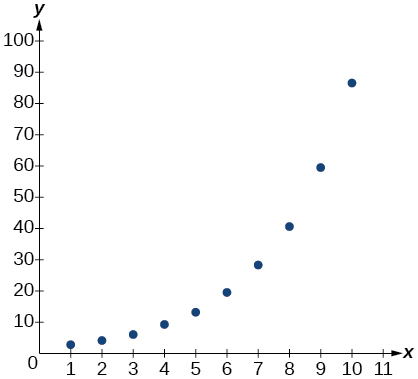
| 10 | 86.28 |
Answer
exponential
6.R-63 §6.R source ↗
For the following exercises, enter the data from each table into a graphing calculator and graph the resulting scatter plots. Determine whether the data from the table would likely represent a function that is linear, exponential, or logarithmic.
Find a formula for an exponential equation that goes through the points and Then express the formula as an equivalent equation with base e.
Answer
6.R-65 §6.R source ↗
For the following exercises, enter the data from each table into a graphing calculator and graph the resulting scatter plots. Determine whether the data from the table would likely represent a function that is linear, exponential, or logarithmic.
The population of a culture of bacteria is modeled by the logistic equation where is in days. To the nearest tenth, how many days will it take the culture to reach of its carrying capacity?
Answer
6.R-67 §6.R source ↗
For the following exercises, use a graphing utility to create a scatter diagram of the data given in the table. Observe the shape of the scatter diagram to determine whether the data is best described by an exponential, logarithmic, or logistic model. Then use the appropriate regression feature to find an equation that models the data. When necessary, round values to five decimal places.
| x | f(x) |
| 0.15 | 36.21 |
| 0.25 | 28.88 |
| 0.5 | 24.39 |
| 0.75 | 18.28 |
| 1 | 16.5 |
| 1.5 | 12.99 |
| 2 | 9.91 |
| 2.25 | 8.57 |
| 2.75 | 7.23 |
| 3 | 5.99 |
| 3.5 | 4.81 |
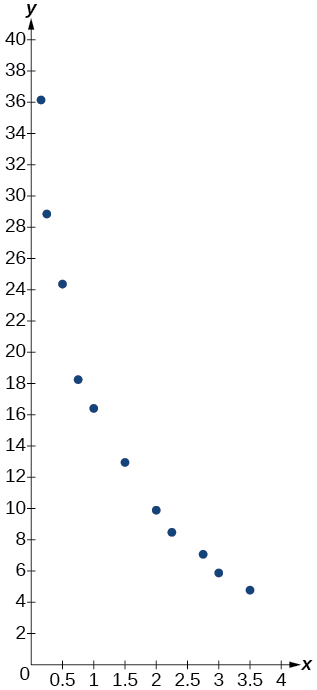
Answer
logarithmic;
6.T-1 §6.T source ↗
Answer
6.T-3 §6.T source ↗
Answer
6.T-5 §6.T source ↗
Answer
y-intercept:
6.T-7 §6.T source ↗
Answer
6.T-9 §6.T source ↗
Answer
6.T-11 §6.T source ↗
Answer
6.T-13 §6.T source ↗
Answer
6.T-15 §6.T source ↗
Answer
6.T-17 §6.T source ↗
Answer
6.T-19 §6.T source ↗
Answer
6.T-21 §6.T source ↗
Answer
6.T-23 §6.T source ↗
Answer
6.T-25 §6.T source ↗
Answer
6.T-27 §6.T source ↗
Answer
6.T-29 §6.T source ↗
Answer
6.T-31 §6.T source ↗
Answer
6.T-33 §6.T source ↗
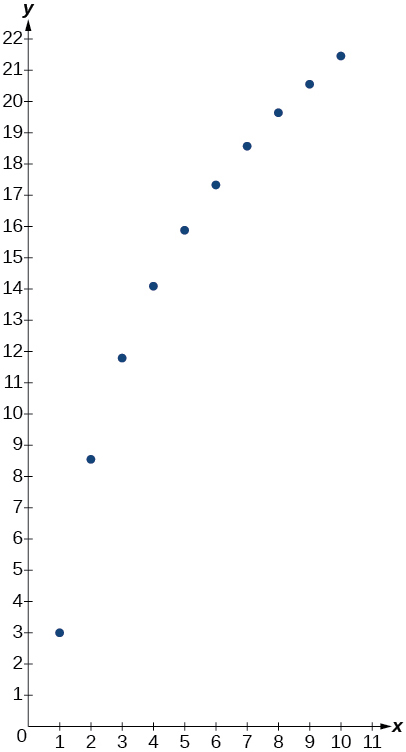
Enter the data from Table 1 into a graphing calculator and graph the resulting scatter plot. Determine whether the data from the table would likely represent a function that is linear, exponential, or logarithmic.
| x | f(x) |
| 1 | 3 |
| 2 | 8.55 |
| 3 | 11.79 |
| 4 | 14.09 |
| 5 | 15.88 |
| 6 | 17.33 |
| 7 | 18.57 |
| 8 | 19.64 |
| 9 | 20.58 |
| 10 | 21.42 |
Answer
logarithmic
6.T-35 §6.T source ↗
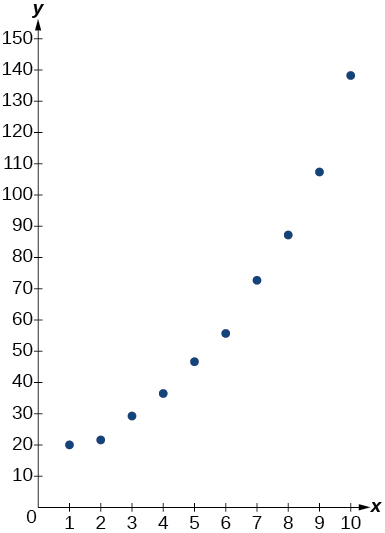
For the following exercises, use a graphing utility to create a scatter diagram of the data given in the table. Observe the shape of the scatter diagram to determine whether the data is best described by an exponential, logarithmic, or logistic model. Then use the appropriate regression feature to find an equation that models the data. When necessary, round values to five decimal places.
| x | f(x) |
| 1 | 20 |
| 2 | 21.6 |
| 3 | 29.2 |
| 4 | 36.4 |
| 5 | 46.6 |
| 6 | 55.7 |
| 7 | 72.6 |
| 8 | 87.1 |
| 9 | 107.2 |
| 10 | 138.1 |
Answer
exponential;
6.T-37 §6.T source ↗
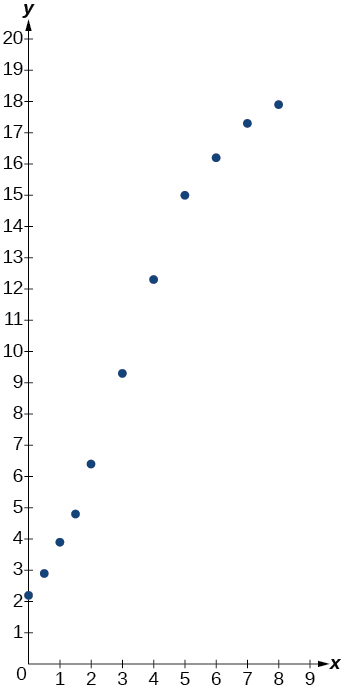
For the following exercises, use a graphing utility to create a scatter diagram of the data given in the table. Observe the shape of the scatter diagram to determine whether the data is best described by an exponential, logarithmic, or logistic model. Then use the appropriate regression feature to find an equation that models the data. When necessary, round values to five decimal places.
| x | f(x) |
| 0 | 2.2 |
| 0.5 | 2.9 |
| 1 | 3.9 |
| 1.5 | 4.8 |
| 2 | 6.4 |
| 3 | 9.3 |
| 4 | 12.3 |
| 5 | 15 |
| 6 | 16.2 |
| 7 | 17.3 |
| 8 | 17.9 |
Answer
logistic;
Loading chapter 7…
Problems and answers are adapted from College Algebra 2e by Jay Abramson, OpenStax, and are used under the CC BY-NC-SA 4.0 licence. Access for free at https://openstax.org/books/college-algebra-2e/pages/1-introduction-to-prerequisites. Illustrations: Copyright Rice University, OpenStax, under CC BY-NC-SA 4.0 license. This adaptation is released under the same licence, is non-commercial, and is neither affiliated with nor endorsed by OpenStax or Rice University.