Every problem in the chapter beside the book’s answer, a chapter at a time as you scroll.
Chapter 6: Periodic Functions
157 problems · 80 figuresTry It #1 §6.1 source ↗
Answer
Try It #2 §6.1 source ↗
Answer
Try It #3 §6.1 source ↗
Answer
Try It #4 §6.1 source ↗
Answer
Try It #5 §6.1 source ↗
Answer
Try It #6 §6.1 source ↗
Determine the formula for the sine function in Figure 16.
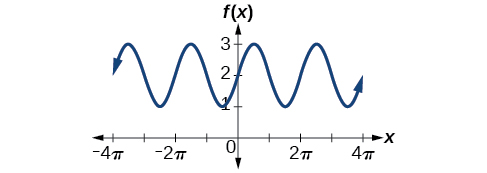 Figure 16
Answer
Try It #7 §6.1 source ↗
Write a formula for the function graphed in Figure 18.
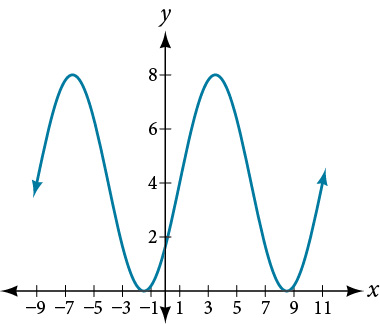 Figure 18
Answer
Try It #8 §6.1 source ↗
Answer
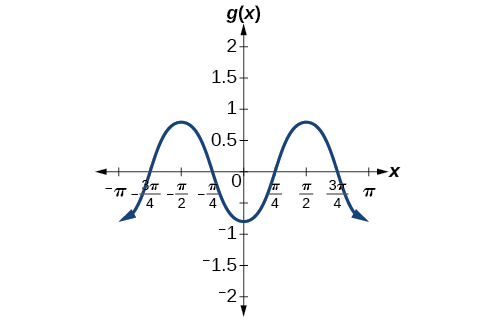
midline: amplitude: period: phase shift: or none
Try It #9 §6.1 source ↗
Answer
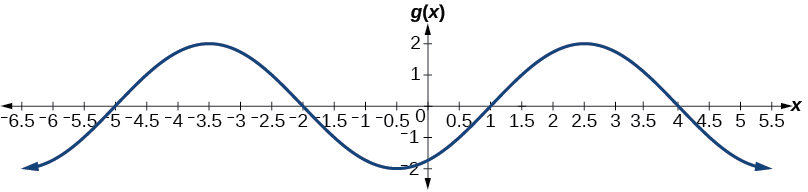
midline: amplitude: period: phase shift:
Try It #10 §6.1 source ↗
Answer
7
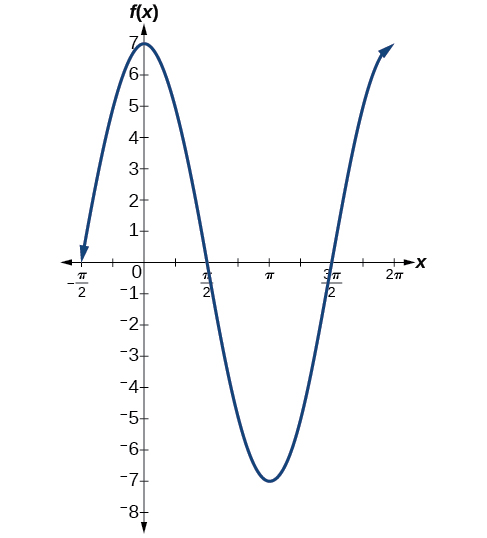
Try It #11 §6.1 source ↗
A weight is attached to a spring that is then hung from a board, as shown in Figure 25. As the spring oscillates up and down, the position of the weight relative to the board ranges from in. (at time to in. (at time below the board. Assume the position of is given as a sinusoidal function of Sketch a graph of the function, and then find a cosine function that gives the position in terms of
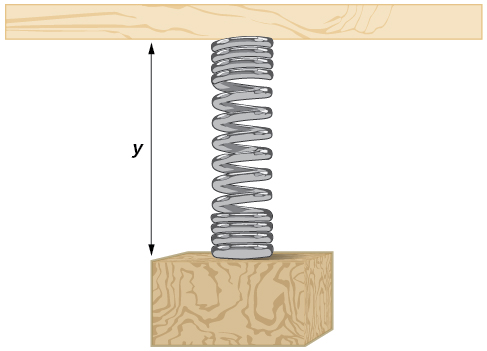 Figure 25
Answer
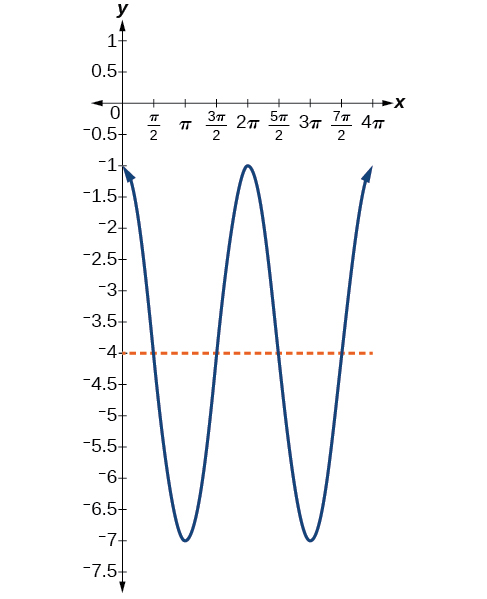
6.1-1 §6.1 source ↗
Answer
6.1-3 §6.1 source ↗
Answer
6.1-5 §6.1 source ↗
Answer
6.1-7 §6.1 source ↗
For the following exercises, graph two full periods of each function and state the amplitude, period, and midline. State the maximum and minimum y-values and their corresponding x-values on one period for Round answers to two decimal places if necessary.
Answer
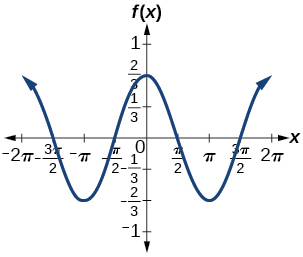
amplitude: period: midline: maximum: occurs at minimum: occurs at for one period, the graph starts at 0 and ends at
6.1-9 §6.1 source ↗
For the following exercises, graph two full periods of each function and state the amplitude, period, and midline. State the maximum and minimum y-values and their corresponding x-values on one period for Round answers to two decimal places if necessary.
Answer
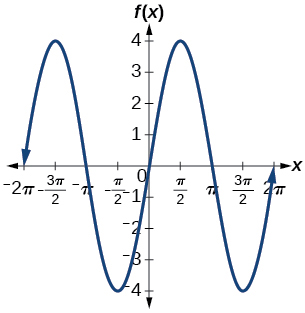
amplitude: 4; period: midline: maximum occurs at minimum: occurs at one full period occurs from to
6.1-11 §6.1 source ↗
For the following exercises, graph two full periods of each function and state the amplitude, period, and midline. State the maximum and minimum y-values and their corresponding x-values on one period for Round answers to two decimal places if necessary.
Answer
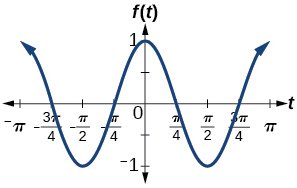
amplitude: 1; period: midline: maximum: occurs at minimum: occurs at one full period is graphed from to
6.1-13 §6.1 source ↗
For the following exercises, graph two full periods of each function and state the amplitude, period, and midline. State the maximum and minimum y-values and their corresponding x-values on one period for Round answers to two decimal places if necessary.
Answer
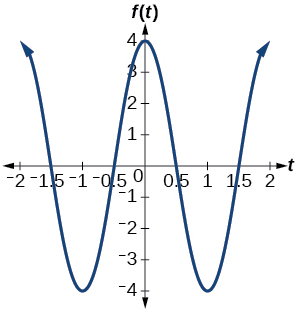
amplitude: 4; period: 2; midline: maximum: occurs at minimum: occurs at
6.1-15 §6.1 source ↗
For the following exercises, graph two full periods of each function and state the amplitude, period, and midline. State the maximum and minimum y-values and their corresponding x-values on one period for Round answers to two decimal places if necessary.
Answer
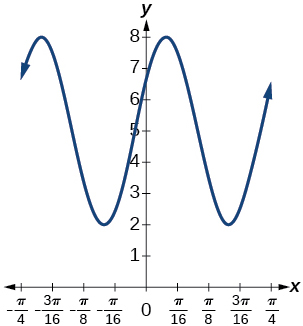
amplitude: 3; period: midline: maximum: occurs at minimum: occurs at horizontal shift: vertical translation 5; one period occurs from to
6.1-17 §6.1 source ↗
For the following exercises, graph two full periods of each function and state the amplitude, period, and midline. State the maximum and minimum y-values and their corresponding x-values on one period for Round answers to two decimal places if necessary.
Answer
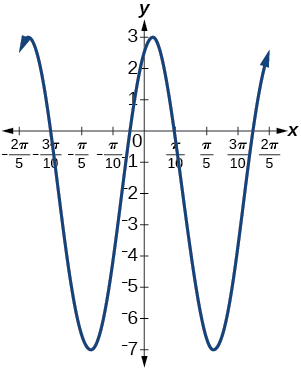
amplitude: 5; period: midline: maximum: occurs at minimum: occurs at phase shift: vertical translation: one full period can be graphed on to
6.1-19 §6.1 source ↗
For the following exercises, graph one full period of each function, starting at For each function, state the amplitude, period, and midline. State the maximum and minimum y-values and their corresponding x-values on one period for State the phase shift and vertical translation, if applicable. Round answers to two decimal places if necessary.
Answer
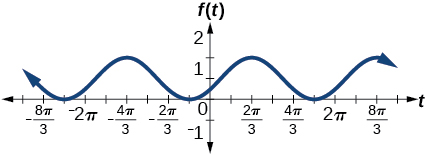
amplitude: 1 ; period: midline: maximum: occurs at minimum: occurs at phase shift: vertical translation: 1; one full period is from to
6.1-21 §6.1 source ↗
For the following exercises, graph one full period of each function, starting at For each function, state the amplitude, period, and midline. State the maximum and minimum y-values and their corresponding x-values on one period for State the phase shift and vertical translation, if applicable. Round answers to two decimal places if necessary.
Answer
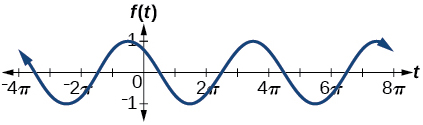
amplitude: 1; period: midline: maximum: occurs at minimum: occurs at phase shift: vertical shift: 0
6.1-23 §6.1 source ↗
For the following exercises, graph one full period of each function, starting at For each function, state the amplitude, period, and midline. State the maximum and minimum y-values and their corresponding x-values on one period for State the phase shift and vertical translation, if applicable. Round answers to two decimal places if necessary.
Determine the amplitude, midline, period, and an equation involving the sine function for the graph shown in Figure 26.
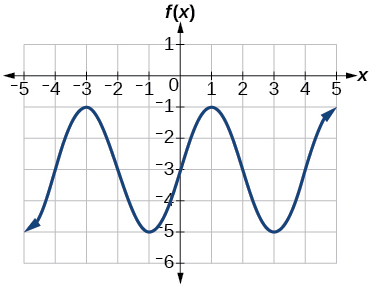 Figure 26
Answer
6.1-25 §6.1 source ↗
For the following exercises, graph one full period of each function, starting at For each function, state the amplitude, period, and midline. State the maximum and minimum y-values and their corresponding x-values on one period for State the phase shift and vertical translation, if applicable. Round answers to two decimal places if necessary.
Determine the amplitude, period, midline, and an equation involving cosine for the graph shown in Figure 28.
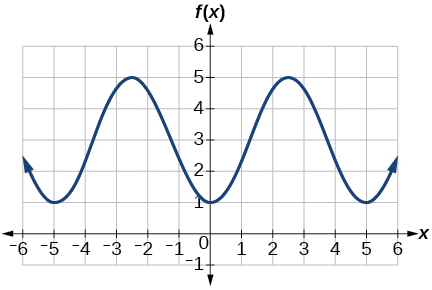 Figure 28
Answer
6.1-27 §6.1 source ↗
For the following exercises, graph one full period of each function, starting at For each function, state the amplitude, period, and midline. State the maximum and minimum y-values and their corresponding x-values on one period for State the phase shift and vertical translation, if applicable. Round answers to two decimal places if necessary.
Determine the amplitude, period, midline, and an equation involving cosine for the graph shown in Figure 30.
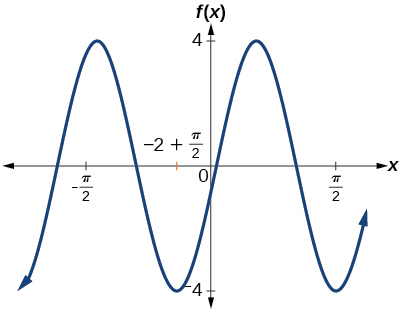 Figure 30
Answer
6.1-29 §6.1 source ↗
For the following exercises, graph one full period of each function, starting at For each function, state the amplitude, period, and midline. State the maximum and minimum y-values and their corresponding x-values on one period for State the phase shift and vertical translation, if applicable. Round answers to two decimal places if necessary.
Determine the amplitude, period, midline, and an equation involving cosine for the graph shown in Figure 32.
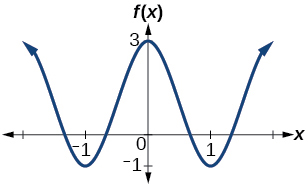 Figure 32
Answer
6.1-31 §6.1 source ↗
For the following exercises, let
On solve
Answer
6.1-33 §6.1 source ↗
For the following exercises, let
Evaluate
Answer
6.1-35 §6.1 source ↗
For the following exercises, let
On the maximum value(s) of the function occur(s) at what x-value(s)?
Answer
6.1-37 §6.1 source ↗
For the following exercises, let
Show that This means that is an odd function and possesses symmetry with respect to ________________.
Answer
6.1-39 §6.1 source ↗
For the following exercises, let
On solve
Answer
6.1-41 §6.1 source ↗
For the following exercises, let
On find the x-values at which the function has a maximum or minimum value.
Answer
6.1-43 §6.1 source ↗
For the following exercises, let
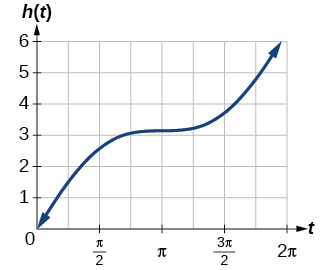
Graph on Explain why the graph appears as it does.
Answer
A linear function is added to a periodic sine function. The graph does not have an amplitude because as the linear function increases without bound the combined function will increase without bound as well. The graph is bounded between the graphs of and because sine oscillates between −1 and 1.
6.1-45 §6.1 source ↗
For the following exercises, let
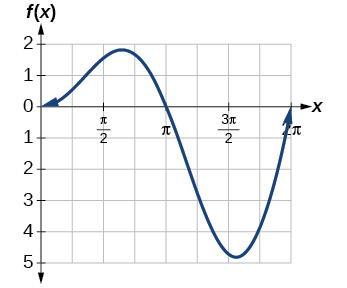
Graph on and verbalize how the graph varies from the graph of
Answer
There is no amplitude because the function is not bounded.
6.1-47 §6.1 source ↗
For the following exercises, let
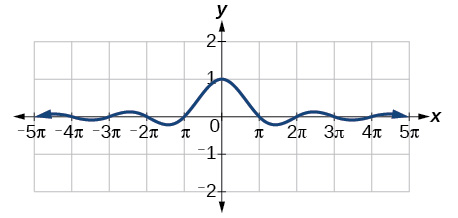
Graph on the window and explain what the graph shows.
Answer
The graph is symmetric with respect to the y-axis and there is no amplitude because the function’s bounds decrease as grows. There appears to be a horizontal asymptote at .
Try It #1 §6.2 source ↗
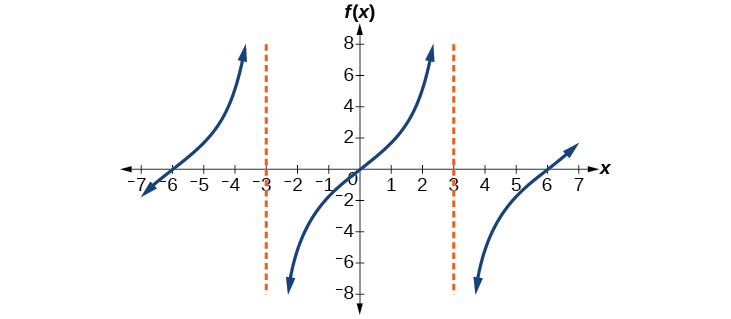
Answer
Try It #2 §6.2 source ↗
Answer
Try It #3 §6.2 source ↗
Find a formula for the function in Figure 5.
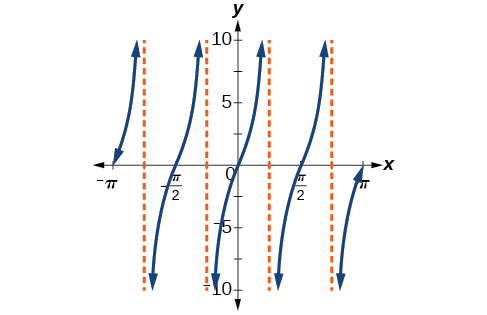 Figure 5
Answer
Try It #4 §6.2 source ↗
Answer
This is a vertical reflection of the preceding graph because is negative.
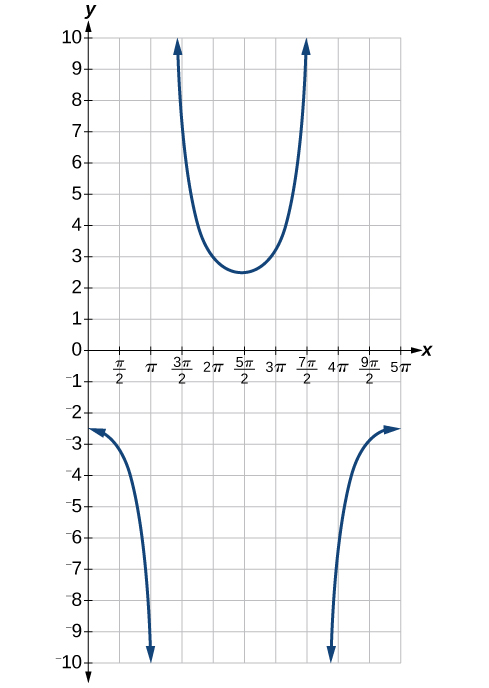
Try It #5 §6.2 source ↗
Answer
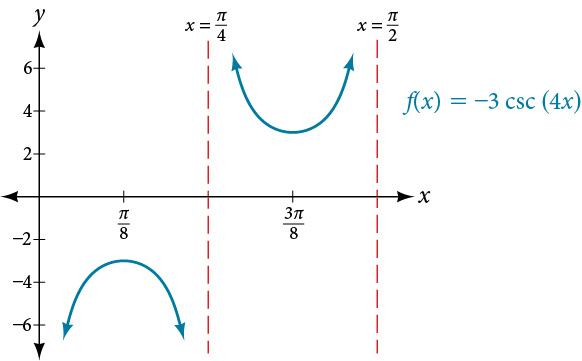
Try It #6 §6.2 source ↗
Answer
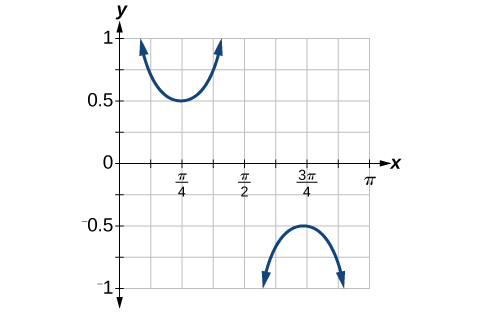
Try It #7 §6.2 source ↗
Given the graph of shown in Figure 12, sketch the graph of on the same axes.
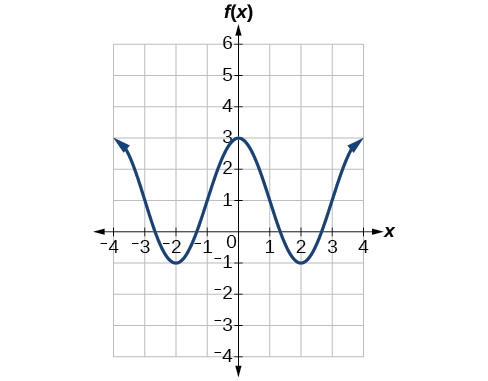 Figure 12
Answer
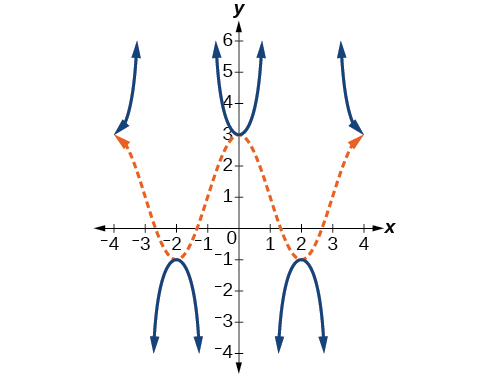
6.2-1 §6.2 source ↗
Answer
6.2-3 §6.2 source ↗
Answer
6.2-5 §6.2 source ↗
Answer
6.2-7 §6.2 source ↗
For the following exercises, match each trigonometric function with one of the following graphs.
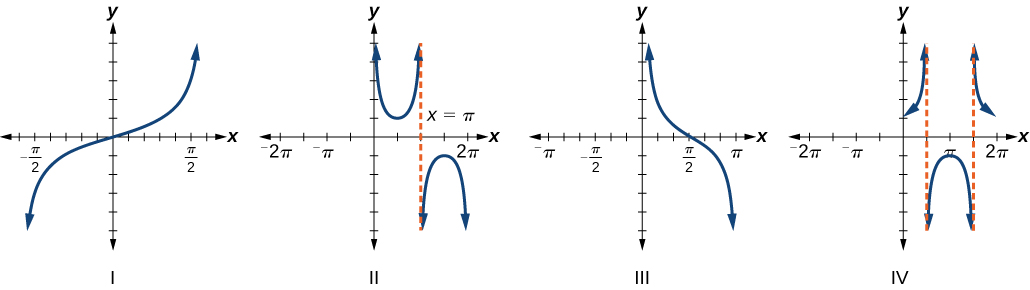 Figure 18
Answer
6.2-9 §6.2 source ↗
For the following exercises, match each trigonometric function with one of the following graphs.
Figure 18
Answer
6.2-11 §6.2 source ↗
For the following exercises, find the period and horizontal shift of each of the functions.
Answer
6.2-13 §6.2 source ↗
For the following exercises, evaluate the transformed functions.
If find
Answer
6.2-15 §6.2 source ↗
For the following exercises, evaluate the transformed functions.
If find
Answer
6.2-17 §6.2 source ↗
For the following exercises, rewrite each expression such that the argument is positive.
Answer
6.2-19 §6.2 source ↗
For the following exercises, sketch two periods of the graph for each of the following functions. Identify the stretching factor, period, and asymptotes.
Answer
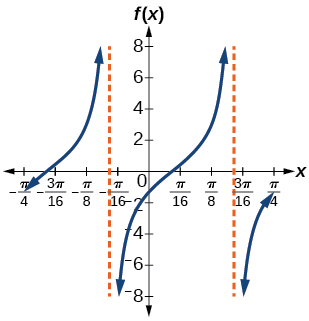
stretching factor: 2; period: asymptotes:
6.2-21 §6.2 source ↗
For the following exercises, sketch two periods of the graph for each of the following functions. Identify the stretching factor, period, and asymptotes.
Answer
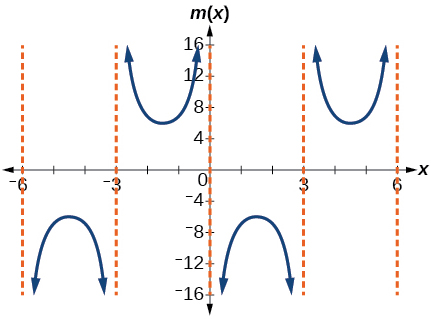
stretching factor: 6; period: 6; asymptotes:
6.2-23 §6.2 source ↗
For the following exercises, sketch two periods of the graph for each of the following functions. Identify the stretching factor, period, and asymptotes.
Answer
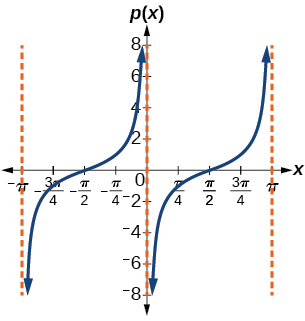
stretching factor: 1; period: asymptotes:
6.2-25 §6.2 source ↗
For the following exercises, sketch two periods of the graph for each of the following functions. Identify the stretching factor, period, and asymptotes.
Answer
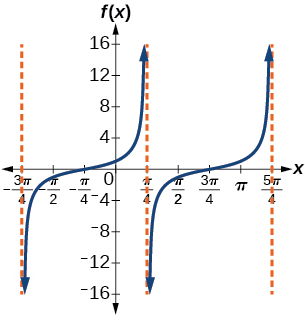
Stretching factor: 1; period: asymptotes:
6.2-27 §6.2 source ↗
For the following exercises, sketch two periods of the graph for each of the following functions. Identify the stretching factor, period, and asymptotes.
Answer
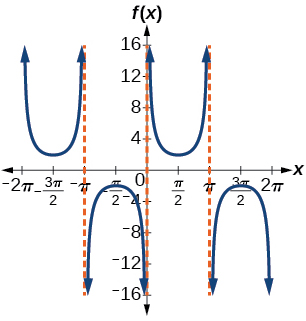
stretching factor: 2; period: asymptotes:
6.2-29 §6.2 source ↗
For the following exercises, sketch two periods of the graph for each of the following functions. Identify the stretching factor, period, and asymptotes.
Answer
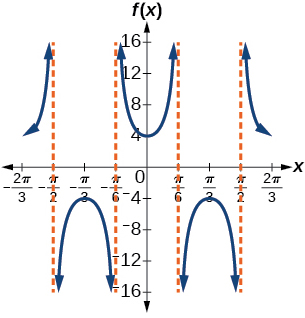
stretching factor: 4; period: asymptotes:
6.2-31 §6.2 source ↗
For the following exercises, sketch two periods of the graph for each of the following functions. Identify the stretching factor, period, and asymptotes.
Answer
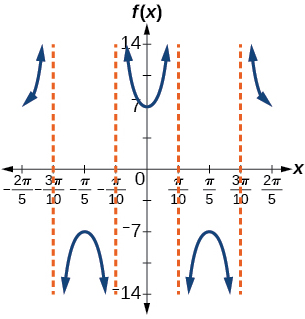
stretching factor: 7; period: asymptotes:
6.2-33 §6.2 source ↗
For the following exercises, sketch two periods of the graph for each of the following functions. Identify the stretching factor, period, and asymptotes.
Answer
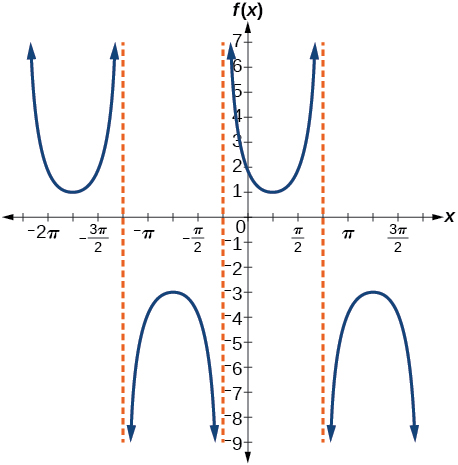
stretching factor: 2; period: asymptotes:
6.2-35 §6.2 source ↗
For the following exercises, sketch two periods of the graph for each of the following functions. Identify the stretching factor, period, and asymptotes.
Answer
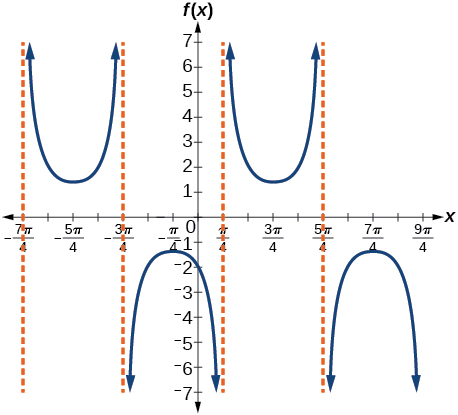
stretching factor: period: asymptotes:
6.2-37 §6.2 source ↗
For the following exercises, find and graph two periods of the periodic function with the given stretching factor, period, and phase shift.
A tangent curve, period of and phase shift
Answer
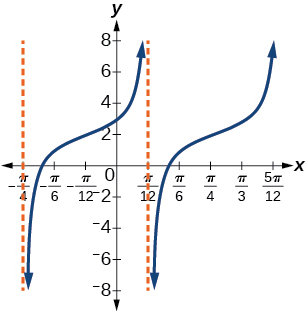
6.2-39 §6.2 source ↗
For the following exercises, find an equation for the graph of each function.
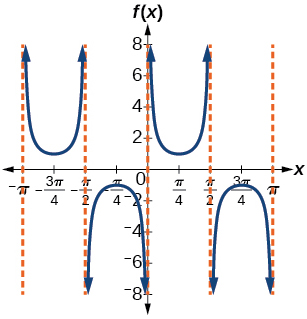
Answer
6.2-41 §6.2 source ↗
For the following exercises, find an equation for the graph of each function.
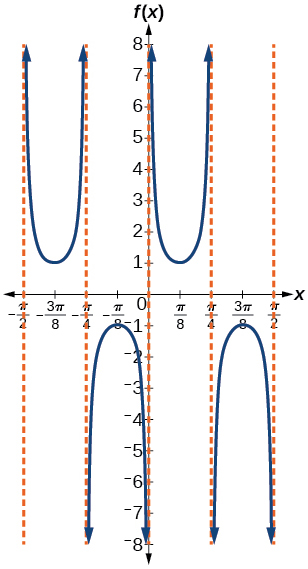
Answer
6.2-43 §6.2 source ↗
For the following exercises, find an equation for the graph of each function.
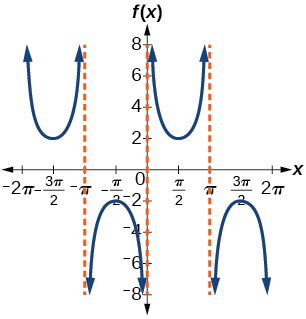
Answer
6.2-45 §6.2 source ↗
For the following exercises, find an equation for the graph of each function.
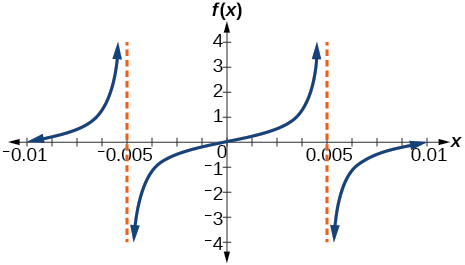
Answer
6.2-47 §6.2 source ↗
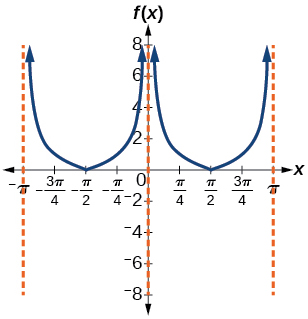
For the following exercises, use a graphing calculator to graph two periods of the given function. Note: most graphing calculators do not have a cosecant button; therefore, you will need to input as
Answer
6.2-49 §6.2 source ↗
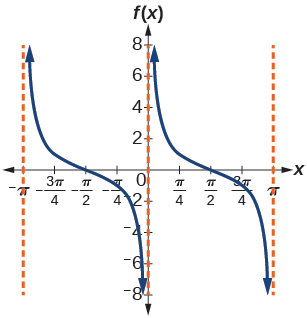
For the following exercises, use a graphing calculator to graph two periods of the given function. Note: most graphing calculators do not have a cosecant button; therefore, you will need to input as
Answer
6.2-51 §6.2 source ↗
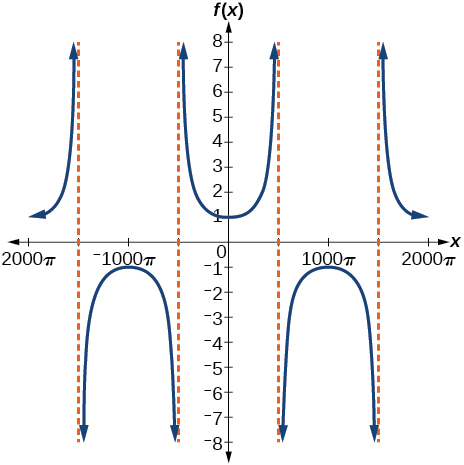
For the following exercises, use a graphing calculator to graph two periods of the given function. Note: most graphing calculators do not have a cosecant button; therefore, you will need to input as
Answer
6.2-53 §6.2 source ↗
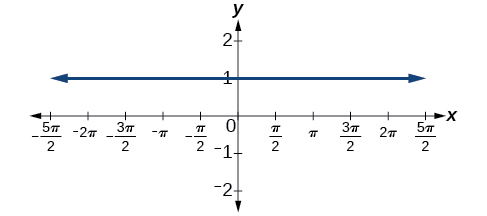
For the following exercises, use a graphing calculator to graph two periods of the given function. Note: most graphing calculators do not have a cosecant button; therefore, you will need to input as
Answer
6.2-55 §6.2 source ↗
For the following exercises, use a graphing calculator to graph two periods of the given function. Note: most graphing calculators do not have a cosecant button; therefore, you will need to input as
Standing on the shore of a lake, a fisherman sights a boat far in the distance to his left. Let measured in radians, be the angle formed by the line of sight to the ship and a line due north from his position. Assume due north is 0 and is measured negative to the left and positive to the right. (See Figure 19.) The boat travels from due west to due east and, ignoring the curvature of the Earth, the distance in kilometers, from the fisherman to the boat is given by the function
ⓐWhat is a reasonable domain for
ⓑGraph on this domain.
ⓒFind and discuss the meaning of any vertical asymptotes on the graph of
ⓓCalculate and interpret Round to the second decimal place.
ⓔCalculate and interpret Round to the second decimal place.
ⓕWhat is the minimum distance between the fisherman and the boat? When does this occur?
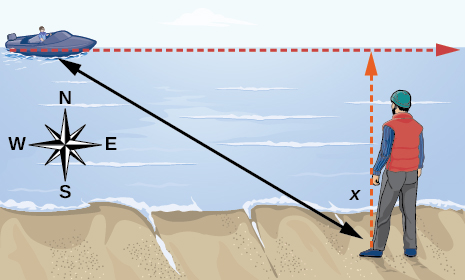
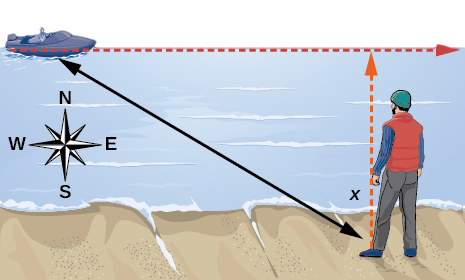 Figure 19
Answer
ⓐ
ⓑ 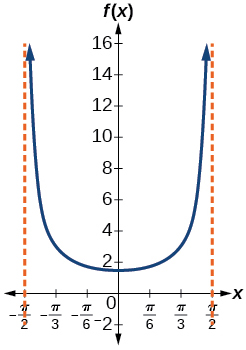
ⓒ and the distance grows without bound as approaches —i.e., at right angles to the line representing due north, the boat would be so far away, the fisherman could not see it;
ⓓ3; when the boat is 3 km away;
ⓔ 1.73; when the boat is about 1.73 km away;
ⓕ 1.5 km; when
6.2-57 §6.2 source ↗
For the following exercises, use a graphing calculator to graph two periods of the given function. Note: most graphing calculators do not have a cosecant button; therefore, you will need to input as
A video camera is focused on a rocket on a launching pad 2 miles from the camera. The angle of elevation from the ground to the rocket after seconds is
ⓐWrite a function expressing the altitude in miles, of the rocket above the ground after seconds. Ignore the curvature of the Earth.
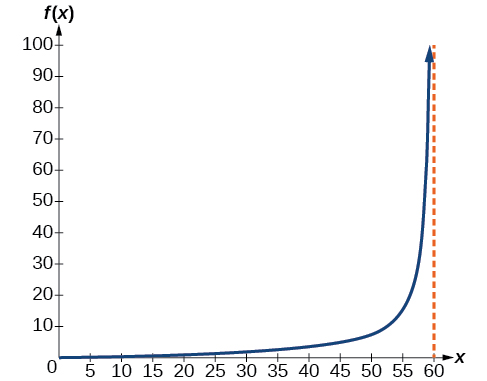
ⓑGraph on the interval
ⓒEvaluate and interpret the values and
ⓓWhat happens to the values of as approaches 60 seconds? Interpret the meaning of this in terms of the problem.
Answer
ⓐ
ⓑ 
ⓒ after 0 seconds, the rocket is 0 mi above the ground; after 30 seconds, the rockets is 2 mi high;
ⓓAs approaches 60 seconds, the values of grow increasingly large. The distance to the rocket is growing so large that the camera can no longer track it.
Try It #1 §6.3 source ↗
Answer
Try It #2 §6.3 source ↗
Evaluate each of the following.
ⓐ
ⓑ
ⓒ
ⓓ
Answer
ⓐ
ⓑ
ⓒ
ⓓ
Try It #3 §6.3 source ↗
Answer
Try It #4 §6.3 source ↗
Solve the triangle in Figure 9 for the angle
 Figure 9
Answer
Try It #5 §6.3 source ↗
Answer
Try It #6 §6.3 source ↗
Answer
Try It #7 §6.3 source ↗
Answer
Try It #8 §6.3 source ↗
Answer
Try It #9 §6.3 source ↗
Answer
6.3-1 §6.3 source ↗
Answer
6.3-3 §6.3 source ↗
Answer
6.3-5 §6.3 source ↗
Answer
6.3-7 §6.3 source ↗
Answer
6.3-9 §6.3 source ↗
For the following exercises, evaluate the expressions.
Answer
6.3-11 §6.3 source ↗
For the following exercises, evaluate the expressions.
Answer
6.3-13 §6.3 source ↗
For the following exercises, evaluate the expressions.
Answer
6.3-15 §6.3 source ↗
For the following exercises, evaluate the expressions.
Answer
6.3-17 §6.3 source ↗
For the following exercises, use a calculator to evaluate each expression. Express answers to the nearest hundredth.
Answer
6.3-19 §6.3 source ↗
For the following exercises, use a calculator to evaluate each expression. Express answers to the nearest hundredth.
Answer
6.3-21 §6.3 source ↗
For the following exercises, use a calculator to evaluate each expression. Express answers to the nearest hundredth.
Answer
6.3-23 §6.3 source ↗
For the following exercises, find the angle in the given right triangle. Round answers to the nearest hundredth.
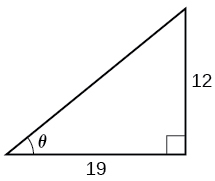
Answer
6.3-25 §6.3 source ↗
For the following exercises, find the exact value, if possible, without a calculator. If it is not possible, explain why.
Answer
6.3-27 §6.3 source ↗
For the following exercises, find the exact value, if possible, without a calculator. If it is not possible, explain why.
Answer
6.3-29 §6.3 source ↗
For the following exercises, find the exact value, if possible, without a calculator. If it is not possible, explain why.
Answer
6.3-31 §6.3 source ↗
For the following exercises, find the exact value, if possible, without a calculator. If it is not possible, explain why.
Answer
6.3-33 §6.3 source ↗
For the following exercises, find the exact value, if possible, without a calculator. If it is not possible, explain why.
Answer
6.3-35 §6.3 source ↗
For the following exercises, find the exact value, if possible, without a calculator. If it is not possible, explain why.
Answer
6.3-37 §6.3 source ↗
For the following exercises, find the exact value of the expression in terms of with the help of a reference triangle.
Answer
6.3-39 §6.3 source ↗
For the following exercises, find the exact value of the expression in terms of with the help of a reference triangle.
Answer
6.3-41 §6.3 source ↗
For the following exercises, find the exact value of the expression in terms of with the help of a reference triangle.
Answer
6.3-43 §6.3 source ↗
For the following exercises, find the function if
Answer
6.3-45 §6.3 source ↗
For the following exercises, find the function if
Answer
6.3-47 §6.3 source ↗
For the following exercises, find the function if
Answer
6.3-49 §6.3 source ↗
For the following exercises, find the function if
Graph and state the domain and range of the function.
Answer
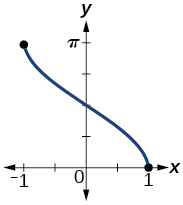
domain range
6.3-51 §6.3 source ↗
For the following exercises, find the function if
For what value of does Use a graphing calculator to approximate the answer.
Answer
6.3-53 §6.3 source ↗
For the following exercises, find the function if
Suppose a 13-foot ladder is leaning against a building, reaching to the bottom of a second-floor window 12 feet above the ground. What angle, in radians, does the ladder make with the building?
Answer
6.3-55 §6.3 source ↗
For the following exercises, find the function if
An isosceles triangle has two congruent sides of length 9 inches. The remaining side has a length of 8 inches. Find the angle that a side of 9 inches makes with the 8-inch side.
Answer
6.3-57 §6.3 source ↗
For the following exercises, find the function if
A truss (interior beam structure) for the roof of a house is constructed from two identical right triangles. Each has a base of 12 feet and height of 4 feet. Find the measure of the acute angle adjacent to the 4-foot side.
Answer
6.3-59 §6.3 source ↗
For the following exercises, find the function if
The line passes through the origin in the x,y-plane. What is the measure of the angle that the line makes with the negative x-axis?
Answer
6.3-61 §6.3 source ↗
For the following exercises, find the function if
A 20-foot ladder leans up against the side of a building so that the foot of the ladder is 10 feet from the base of the building. If specifications call for the ladder's angle of elevation to be between 35 and 45 degrees, does the placement of this ladder satisfy safety specifications?
Answer
6.R-1 §6.R source ↗
For the following exercises, graph the functions for two periods and determine the amplitude or stretching factor, period, midline equation, and asymptotes.
Answer
amplitude: 3; period: midline: no asymptotes
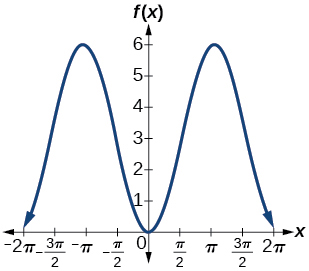
6.R-3 §6.R source ↗
For the following exercises, graph the functions for two periods and determine the amplitude or stretching factor, period, midline equation, and asymptotes.
Answer
amplitude: 3; period: midline: no asymptotes
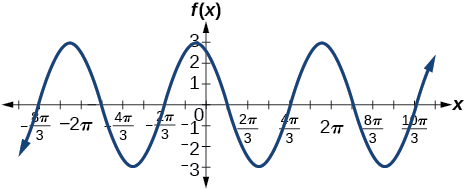
6.R-5 §6.R source ↗
For the following exercises, graph the functions for two periods and determine the amplitude or stretching factor, period, midline equation, and asymptotes.
Answer
amplitude: 3; period: midline: no asymptotes
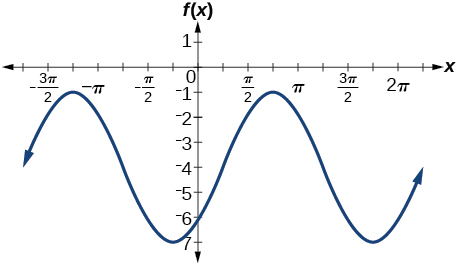
6.R-7 §6.R source ↗
For the following exercises, graph the functions for two periods and determine the amplitude or stretching factor, period, midline equation, and asymptotes.
Answer
amplitude: 6; period: midline: no asymptotes
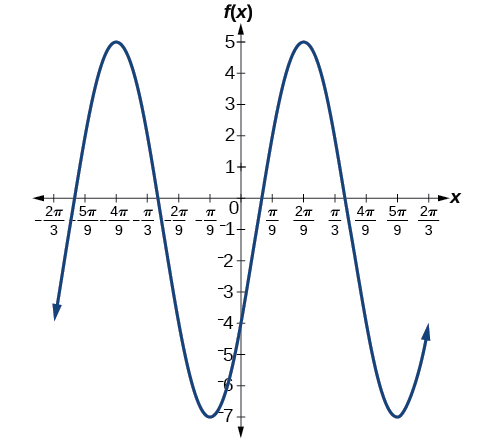
6.R-9 §6.R source ↗
For the following exercises, graph the functions for two periods and determine the amplitude or stretching factor, period, midline equation, and asymptotes.
Answer
stretching factor: none; period: midline: asymptotes: where is an integer
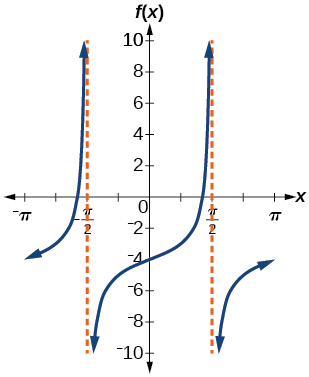
6.R-11 §6.R source ↗
For the following exercises, graph the functions for two periods and determine the amplitude or stretching factor, period, midline equation, and asymptotes.
Answer
stretching factor: 3; period: midline: asymptotes: where is an integer
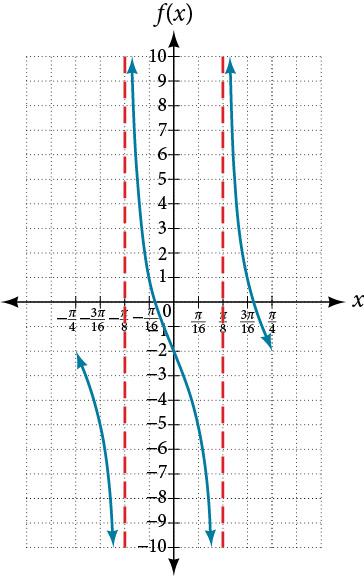
6.R-13 §6.R source ↗
For the following exercises, graph two full periods. Identify the period, the phase shift, the amplitude, and asymptotes.
Answer
amplitude: none; period: no phase shift; asymptotes: where is an odd integer
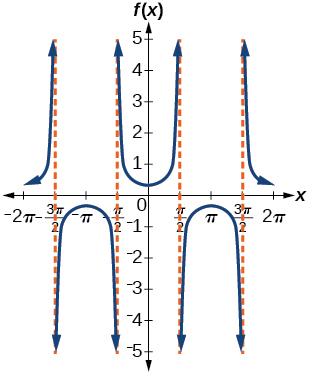
6.R-15 §6.R source ↗
For the following exercises, graph two full periods. Identify the period, the phase shift, the amplitude, and asymptotes.
Answer
amplitude: none; period: no phase shift; asymptotes: where is an integer
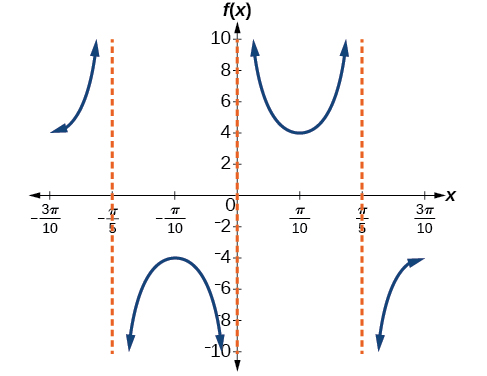
6.R-17 §6.R source ↗
For the following exercises, graph two full periods. Identify the period, the phase shift, the amplitude, and asymptotes.
Answer
amplitude: none; period: no phase shift; asymptotes: where is an integer
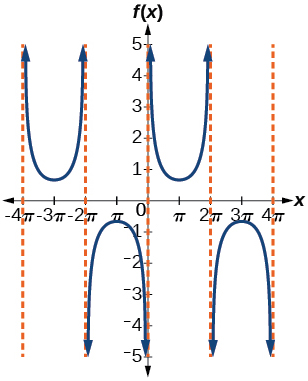
6.R-19 §6.R source ↗
For the following exercises, use this scenario: The population of a city has risen and fallen over a 20-year interval. Its population may be modeled by the following function: where the domain is the years since 1980 and the range is the population of the city.
What is the largest and smallest population the city may have?
Answer
6.R-21 §6.R source ↗
For the following exercises, use this scenario: The population of a city has risen and fallen over a 20-year interval. Its population may be modeled by the following function: where the domain is the years since 1980 and the range is the population of the city.
What are the amplitude, period, and phase shift for the function?
Answer
6.R-23 §6.R source ↗
For the following exercises, use this scenario: The population of a city has risen and fallen over a 20-year interval. Its population may be modeled by the following function: where the domain is the years since 1980 and the range is the population of the city.
What is the predicted population in 2007? 2010?
Answer
6.R-25 §6.R source ↗
For the following exercises, suppose a weight is attached to a spring and bobs up and down, exhibiting symmetry.
At time = 0, what is the displacement of the weight?
Answer
6.R-27 §6.R source ↗
For the following exercises, suppose a weight is attached to a spring and bobs up and down, exhibiting symmetry.
What is the time required for the weight to return to its initial height of 5 inches? In other words, what is the period for the displacement function?
Answer
6.R-29 §6.R source ↗
For the following exercises, find the exact value without the aid of a calculator.
Answer
6.R-31 §6.R source ↗
For the following exercises, find the exact value without the aid of a calculator.
Answer
6.R-33 §6.R source ↗
For the following exercises, find the exact value without the aid of a calculator.
Answer
6.R-35 §6.R source ↗
For the following exercises, find the exact value without the aid of a calculator.
Answer
6.R-37 §6.R source ↗
For the following exercises, find the exact value without the aid of a calculator.
Answer
6.R-39 §6.R source ↗
For the following exercises, find the exact value without the aid of a calculator.
Graph and on the interval and explain any observations.
Answer
The graphs are not symmetrical with respect to the line They are symmetrical with respect to the -axis.
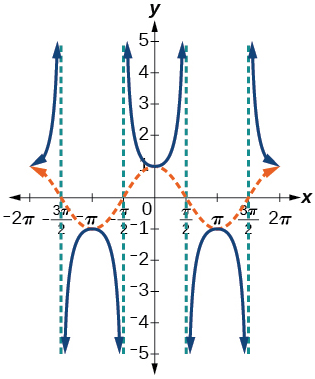
6.R-41 §6.R source ↗
For the following exercises, find the exact value without the aid of a calculator.
Graph the function on the interval and compare the graph to the graph of on the same interval. Describe any observations.
Answer
The graphs appear to be identical.
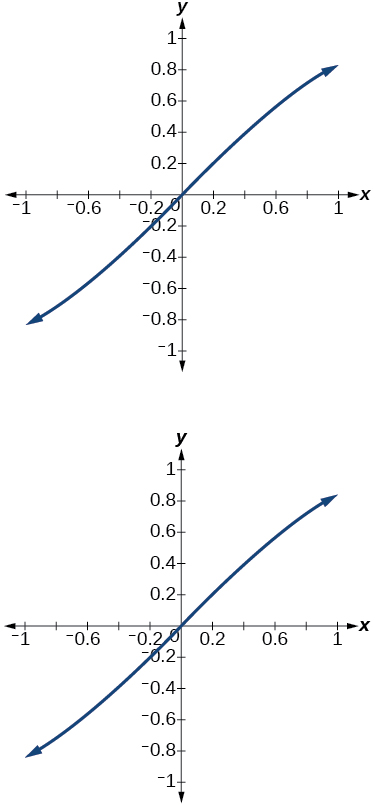
6.T-1 §6.T source ↗
For the following exercises, sketch the graph of each function for two full periods. Determine the amplitude, the period, and the equation for the midline.
Answer
amplitude: 0.5; period: midline
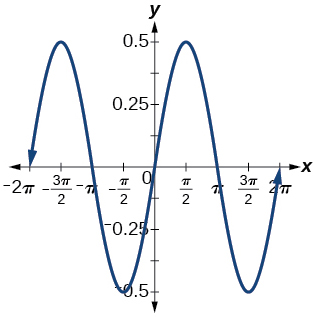
6.T-3 §6.T source ↗
For the following exercises, sketch the graph of each function for two full periods. Determine the amplitude, the period, and the equation for the midline.
Answer
amplitude: 5; period: midline:
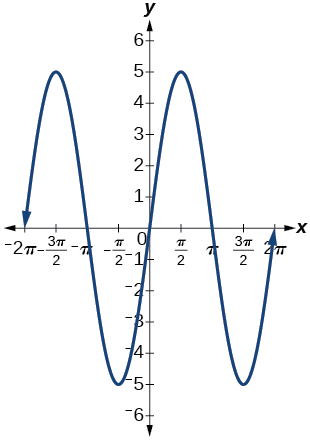
6.T-5 §6.T source ↗
For the following exercises, sketch the graph of each function for two full periods. Determine the amplitude, the period, and the equation for the midline.
Answer
amplitude: 1; period: midline:
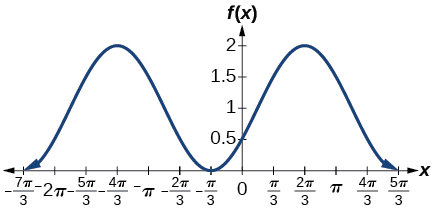
6.T-7 §6.T source ↗
For the following exercises, sketch the graph of each function for two full periods. Determine the amplitude, the period, and the equation for the midline.
Answer
amplitude: 3; period: midline:
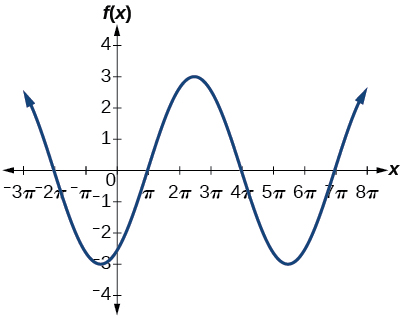
6.T-9 §6.T source ↗
For the following exercises, sketch the graph of each function for two full periods. Determine the amplitude, the period, and the equation for the midline.
Answer
amplitude: none; period: midline: asymptotes: where is an integer
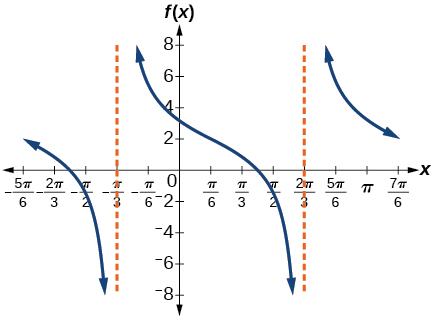
6.T-11 §6.T source ↗
For the following exercises, sketch the graph of each function for two full periods. Determine the amplitude, the period, and the equation for the midline.
Answer
amplitude: none; period: midline: asymptotes: where is an integer
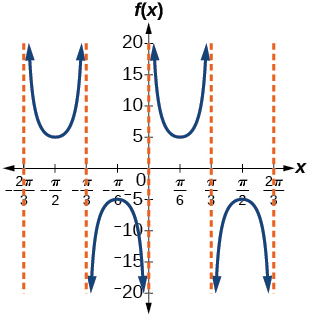
6.T-13 §6.T source ↗
For the following exercises, sketch the graph of each function for two full periods. Determine the amplitude, the period, and the equation for the midline.
Answer
amplitude: none; period: midline:
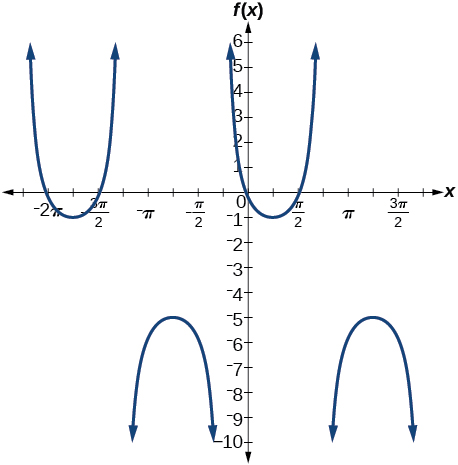
6.T-15 §6.T source ↗
For the following exercises, determine the amplitude, period, and midline of the graph, and then find a formula for the function.
Give in terms of a sine function.
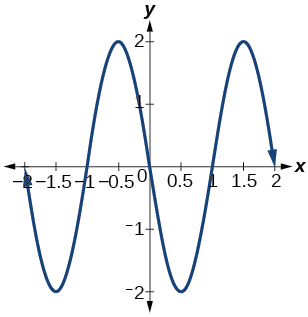
Answer
6.T-17 §6.T source ↗
For the following exercises, find the amplitude, period, phase shift, and midline.
Answer
6.T-19 §6.T source ↗
For the following exercises, find the amplitude, period, phase shift, and midline.
The outside temperature over the course of a day can be modeled as a sinusoidal function. Suppose you know the temperature is 68°F at midnight and the high and low temperatures during the day are 80°F and 56°F, respectively. Assuming is the number of hours since midnight, find a function for the temperature, in terms of
Answer
6.T-21 §6.T source ↗
For the following exercises, find the period and horizontal shift of each function.
Answer
6.T-23 §6.T source ↗
For the following exercises, find the period and horizontal shift of each function.
Write the equation for the graph in Figure 1 in terms of the secant function and give the period and phase shift.
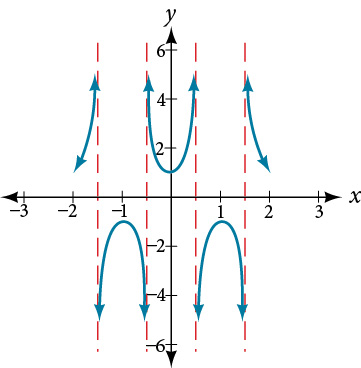 Figure 1
Answer
6.T-25 §6.T source ↗
For the following exercises, find the period and horizontal shift of each function.
If find
Answer
6.T-27 §6.T source ↗
For the following exercises, graph the functions on the specified window and answer the questions.
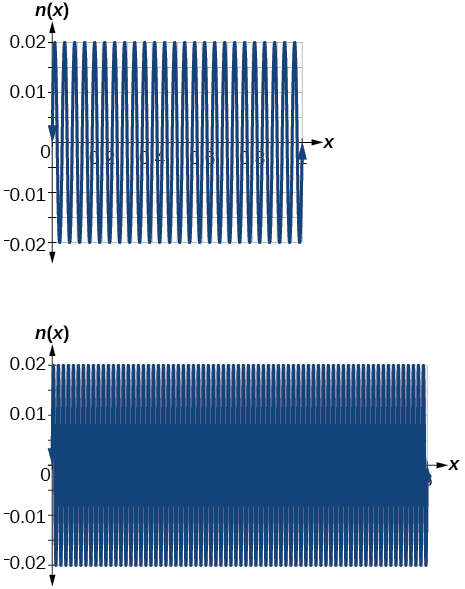
Graph on the following domains in and Suppose this function models sound waves. Why would these views look so different?
Answer
The views are different because the period of the wave is Over a bigger domain, there will be more cycles of the graph.
6.T-29 §6.T source ↗
For the following exercises, let
What is the largest possible value for
Answer
6.T-31 §6.T source ↗
For the following exercises, let
Where is the function increasing on the interval
Answer
6.T-33 §6.T source ↗
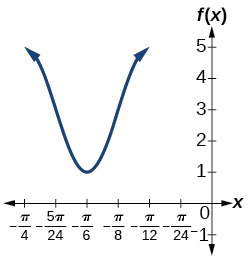
For the following exercises, find and graph one period of the periodic function with the given amplitude, period, and phase shift.
Cosine curve with amplitude 2, period and phase shift
Answer
6.T-35 §6.T source ↗
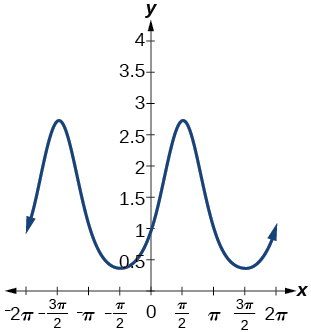
For the following exercises, graph the function. Describe the graph and, wherever applicable, any periodic behavior, amplitude, asymptotes, or undefined points.
Answer
This graph is periodic with a period of
6.T-37 §6.T source ↗
For the following exercises, find the exact value.
Answer
6.T-39 §6.T source ↗
For the following exercises, find the exact value.
Answer
6.T-41 §6.T source ↗
For the following exercises, find the exact value.
Answer
6.T-43 §6.T source ↗
For the following exercises, find the exact value.
Answer
6.T-45 §6.T source ↗
For the following exercises, suppose Evaluate the following expressions.
Answer
6.T-47 §6.T source ↗
For the following exercises, determine whether the equation is true or false.
Answer
6.T-49 §6.T source ↗
For the following exercises, determine whether the equation is true or false.
The grade of a road is 7%. This means that for every horizontal distance of 100 feet on the road, the vertical rise is 7 feet. Find the angle the road makes with the horizontal in radians.
Answer
Loading chapter 7…
Problems and answers are adapted from Precalculus 2e by Jay Abramson, OpenStax, and are used under the CC BY-NC-SA 4.0 licence. Access for free at https://openstax.org/books/precalculus-2e/pages/1-introduction-to-functions. Illustrations: Copyright Rice University, OpenStax, under CC BY-NC-SA 4.0 license. This adaptation is released under the same licence, is non-commercial, and is neither affiliated with nor endorsed by OpenStax or Rice University.