Every problem in the chapter beside the book’s answer, a chapter at a time as you scroll.
Chapter 5: Important Distributions and Densities
17 problems · 0 figuresExercise 5.2.1 §5.2 source ↗
Choose a number from the unit interval with uniform distribution. Find the cumulative distribution and density for the random variables
(a) .
(b) .
Answer
(a) on ; on .
(b) on ; on .
Exercise 5.2.2 §5.2 source ↗
Choose a number from the interval with uniform distribution. Find the cumulative distribution and density for the random variables
(a) .
(b) .
Answer
(a) , on .
(b) , on .
Exercise 5.2.5 §5.2 source ↗
Choose a number from the interval with uniform distribution. Find the cumulative distribution and density for the random variables
(a) .
(b) .
Answer
(a) , on .
(b) , on .
Exercise 5.2.7 §5.2 source ↗
Explain how you can generate a random variable whose cumulative distribution function is
Answer
Using Corollary 5.2, we see that the expression will simulate the given random variable.
Exercise 5.2.9 §5.2 source ↗
Let , be random numbers chosen independently from the interval with uniform distribution. Find the cumulative distribution and density of each of the variables
(a) .
(b) .
Answer
(a) (b) , , .
Exercise 5.2.13 §5.2 source ↗
Find the cumulative distribution function and the density function for each of the random variables , , and in Exercise 12.
A number is chosen at random in the interval . Find the probability that
(a) .
(b) .
(c) .
Answer
(a) , , on .
(b) , ,on .
(c) , , on .
Exercise 5.2.15 §5.2 source ↗
In Exercise 14 find the cumulative distribution and density for the random variable .
A point in the unit square has coordinates and chosen at random in the interval . Let be the distance from to the nearest edge of the square, and the distance to the nearest corner. What is the probability that
(a) ?
(b) ?
Answer
, on .
Exercise 5.2.17 §5.2 source ↗
Let be a random variable with cumulative distribution function
(a) What is the density function for ?
(b) What is the probability that ?
Answer
(a) (b) .
Exercise 5.2.19 §5.2 source ↗
Let be a random variable with density function , and let , , and , where . Find the density functions , , and . (See Exercise 18.)
Let be a random variable with cumulative distribution function , and let , , and , where and are any constants. Find the cumulative distribution functions , , and . Hint: The cases , , and require different arguments.
Answer
, if .
Exercise 5.2.21 §5.2 source ↗
Let be a random variable with cumulative distribution function strictly increasing on the range of . Let . Show that is uniformly distributed in the interval . (The formula then tells us how to construct from a uniform random variable .)
Answer
on .
Exercise 5.2.23 §5.2 source ↗
Let be a random variable with density function . The mean of is the value . Then gives an average value for (see Section 6.3). Find if is distributed uniformly, normally, or exponentially, as in Exercise 22.
Let be a random variable with cumulative distribution function . The median of is the value for which . Then with probability 1/2 and with probability 1/2. Find if is
(a) uniformly distributed over the interval .
(b) normally distributed with parameters and .
(c) exponentially distributed with parameter .
Answer
The mean of the uniform density is . The mean of the normal density is . The mean of the exponential density is .
Exercise 5.2.25 §5.2 source ↗
Let be a random variable normally distributed with parameters , . Estimate
(a) .
(b) .
(c) .
(d) .
Answer
(a) , (b) , (c) , (d) .
Exercise 5.2.27 §5.2 source ↗
A final examination at Podunk University is constructed so that the test scores are approximately normally distributed, with parameters and . The instructor assigns letter grades to the test scores as shown in Table 5.10 (this is the process of “grading on the curve").
| Test Score | Letter grade |
| A | |
| B | |
| C | |
| D | |
| F |
Grading on the curve.
What fraction of the class gets A, B, C, D, F?
| Test Score | Letter grade |
| A | |
| B | |
| C | |
| D | |
| F |
Grading on the curve.
Answer
A: , B: , C: , D: , F: .
Exercise 5.2.29 §5.2 source ↗
Suppose that the time (in hours) required to repair a car is an exponentially distributed random variable with parameter . What is the probability that the repair time exceeds 4 hours? If it exceeds 4 hours what is the probability that it exceeds 8 hours?
Answer
, .
Exercise 5.2.31 §5.2 source ↗
Let be a uniformly distributed random variable on . What is the probability that the equation has two distinct real roots and ?
Answer
.
Exercise 5.2.35 §5.2 source ↗
Consider the simple queueing process of Example 5.7. Suppose that you watch the size of the queue. If there are people in the queue the next time the queue size changes it will either decrease to or increase to . Use the result of Exercise 34 to show that the probability that the queue size decreases to is and the probability that it increases to is . When the queue size is 0 it can only increase to 1. Write a program to simulate the queue size. Use this simulation to help formulate a conjecture containing conditions on and that will ensure that the queue will have times when it is empty.
(Queues) Suppose that customers arrive at random times at a service station with one server, and suppose that each customer is served immediately if no one is ahead of him, but must wait his turn in line otherwise. How long should each customer expect to wait? (We define the waiting time of a customer to be the length of time between the time that he arrives and the time that he begins to be served.)
Let us assume that the interarrival times between successive customers are given by random variables , , …, that are mutually independent and identically distributed with an exponential cumulative distribution function given by Let us assume, too, that the service times for successive customers are given by random variables , , …, that again are mutually independent and identically distributed with another exponential cumulative distribution function given by
The parameters and represent, respectively, the reciprocals of the average time between arrivals of customers and the average service time of the customers. Thus, for example, the larger the value of , the smaller the average time between arrivals of customers. We can guess that the length of time a customer will spend in the queue depends on the relative sizes of the average interarrival time and the average service time.
It is easy to verify this conjecture by simulation. The program Queue simulates this queueing process. Let be the number of customers in the queue at time . Then we plot as a function of for different choices of the parameters and (see Figure 5.7).
Figure 5.7: Queue sizes.
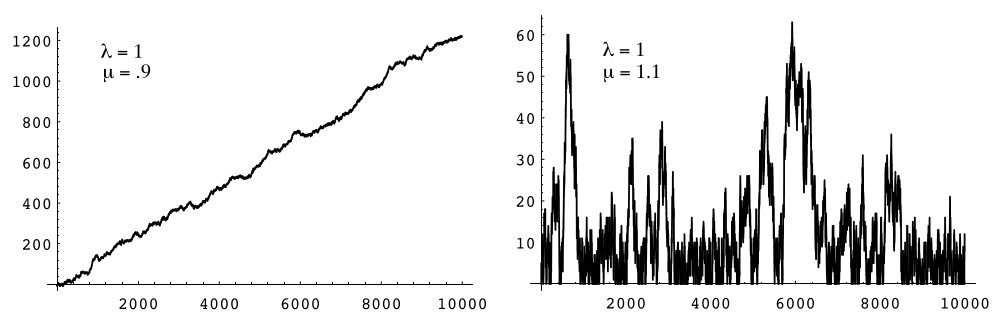
We note that when , then , so the average interarrival time is greater than the average service time, i.e., customers are served more quickly, on average, than new ones arrive. Thus, in this case, it is reasonable to expect that remains small. However, if then customers arrive more quickly than they are served, and, as expected, appears to grow without limit.
We can now ask: How long will a customer have to wait in the queue for service? To examine this question, we let be the length of time that the th customer has to remain in the system (waiting in line and being served). Then we can present these data in a bar graph, using the program Queue, to give some idea of how the are distributed (see Figure 5.8). (Here and .)
Figure 5.8: Waiting times.
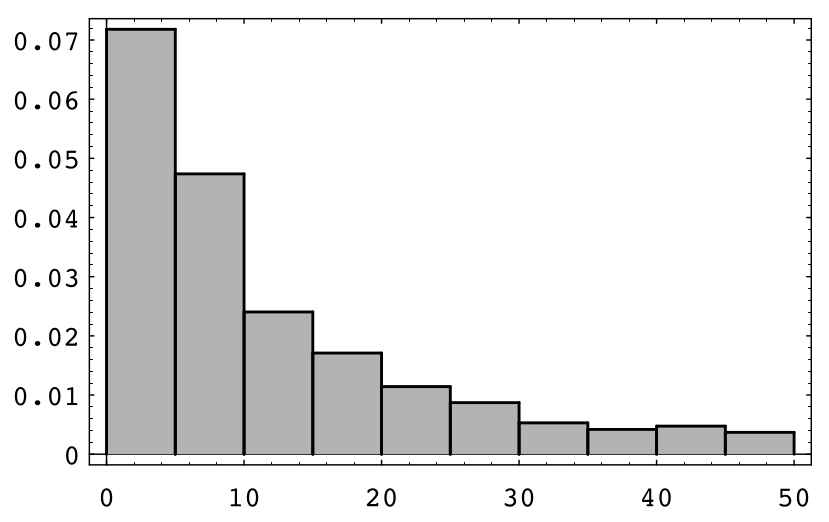
We see that these waiting times appear to be distributed exponentially. This is always the case when . The proof of this fact is too complicated to give here, but we can verify it by simulation for different choices of and , as above.
Figure 5.7: Queue sizes.
Figure 5.8: Waiting times.
Jones puts in two new lightbulbs: a 60 watt bulb and a 100 watt bulb. It is claimed that the lifetime of the 60 watt bulb has an exponential density with average lifetime 200 hours (). The 100 watt bulb also has an exponential density but with average lifetime of only 100 hours (). Jones wonders what is the probability that the 100 watt bulb will outlast the 60 watt bulb.
If and are two independent random variables with exponential densities and , respectively, then the probability that is less than is given by where is the cumulative distribution function for . Explain why this is the case. Use this to show that and to answer Jones’s question.
Answer
.
.
Exercise 5.2.37 §5.2 source ↗
Let be a random variable having a normal density and consider the random variable . Then has a log normal density. Find this density of .
Answer
, for .
Loading chapter 6…
Exercises and answers are adapted from Grinstead and Snell's Introduction to Probability by The CHANCE Project, which is free to read and download, and are used under the GNU FDL licence. They are taken from the GNU version’s LaTeX source (4 July 2006), with answers from the authors’ published answers to the odd-numbered exercises, and set for the web, so they may differ slightly from the printed page. This adaptation is released under the same licence and is neither affiliated with nor endorsed by Grinstead and Snell or American Mathematical Society. Copyright (C) 2006 Peter G. Doyle. This work is a version of Grinstead and Snell's ‘Introduction to Probability, 2nd edition’, published by the American Mathematical Society, Copyright (C) 2003 Charles M. Grinstead and J. Laurie Snell.