Every problem in the chapter beside the book’s answer, a chapter at a time as you scroll.
Chapter 6: Expected Value and Variance
26 problems · 0 figuresExercise 6.2.1 §6.2 source ↗
A number is chosen at random from the set . Let be the number chosen. Find the expected value, variance, and standard deviation of .
Answer
, , .
Exercise 6.2.3 §6.2 source ↗
You place a 1-dollar bet on the number 17 at Las Vegas, and your friend places a 1-dollar bet on black (see Exercises 1.1.6 and 1.1.7). Let be your winnings and be her winnings. Compare , , and , . What do these computations tell you about the nature of your winnings if you and your friend make a sequence of bets, with you betting each time on a number and your friend betting on a color?
In Las Vegas, a roulette wheel has 38 slots numbered 0, 00, 1, 2, …, 36. The 0 and 00 slots are green and half of the remaining 36 slots are red and half are black. A croupier spins the wheel and throws in an ivory ball. If you bet 1 dollar on red, you win 1 dollar if the ball stops in a red slot and otherwise you lose 1 dollar. Write a program to find the total winnings for a player who makes 1000 bets on red.
Another form of bet for roulette is to bet that a specific number (say 17) will turn up. If the ball stops on your number, you get your dollar back plus 35 dollars. If not, you lose your dollar. Write a program that will plot your winnings when you make 500 plays of roulette at Las Vegas, first when you bet each time on red (see Exercise 6), and then for a second visit to Las Vegas when you make 500 plays betting each time on the number 17. What differences do you see in the graphs of your winnings on these two occasions?
Answer
, , ,
Exercise 6.2.5 §6.2 source ↗
In a certain manufacturing process, the (Fahrenheit) temperature never varies by more than from . The temperature is, in fact, a random variable with distribution
(a) Find and .
(b) Define . Find and , and compare these answers with those in part (a).
(c) It is decided to report the temperature readings on a Celsius scale, that is, . What is the expected value and variance for the readings now?
Answer
(a) ,
(b) ,
(c) ,
Exercise 6.2.7 §6.2 source ↗
A coin is tossed three times. Let be the number of heads that turn up. Find and .
Answer
,
Exercise 6.2.9 §6.2 source ↗
A die is loaded so that the probability of a face coming up is proportional to the number on that face. The die is rolled with outcome . Find and .
Answer
,
Exercise 6.2.11 §6.2 source ↗
A number is chosen at random from the integers 1, 2, 3, …, . Let be the number chosen. Show that and . Hint: The following identity may be useful:
Answer
.
Exercise 6.2.13 §6.2 source ↗
Peter and Paul play Heads or Tails (see Example 1.4). Let be Peter’s winnings after matches. Show that and .
(Heads or Tails) For our next example, we consider a problem where the exact answer is difficult to obtain but for which simulation easily gives the qualitative results. Peter and Paul play a game called heads or tails. In this game, a fair coin is tossed a sequence of times—we choose 40. Each time a head comes up Peter wins 1 penny from Paul, and each time a tail comes up Peter loses 1 penny to Paul. For example, if the results of the 40 tosses are
THTHHHHTTHTHHTTHHTTTTHHHTHHTHHHTHHHTTTHH.
Peter’s winnings may be graphed as in Figure 1.1.
Figure 1.1: Peter’s winnings in 40 plays of heads or tails.
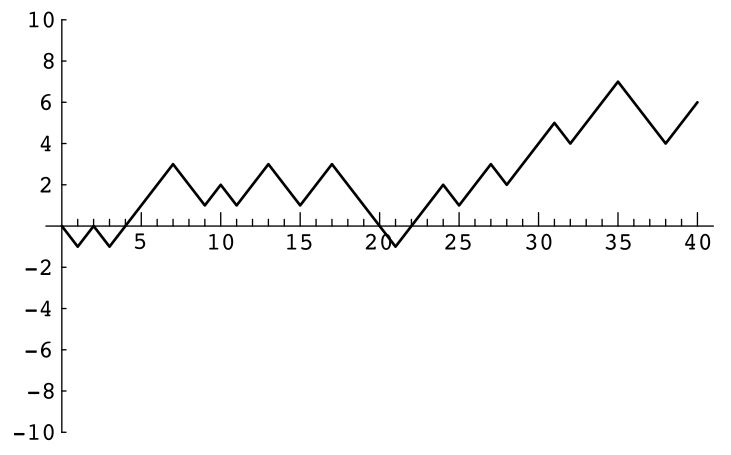
Peter has won 6 pennies in this particular game. It is natural to ask for the probability that he will win pennies; here could be any even number from to . It is reasonable to guess that the value of with the highest probability is , since this occurs when the number of heads equals the number of tails. Similarly, we would guess that the values of with the lowest probabilities are .
A second interesting question about this game is the following: How many times in the 40 tosses will Peter be in the lead? Looking at the graph of his winnings (Figure 1.1), we see that Peter is in the lead when his winnings are positive, but we have to make some convention when his winnings are 0 if we want all tosses to contribute to the number of times in the lead. We adopt the convention that, when Peter’s winnings are 0, he is in the lead if he was ahead at the previous toss and not if he was behind at the previous toss. With this convention, Peter is in the lead 34 times in our example. Again, our intuition might suggest that the most likely number of times to be in the lead is 1/2 of 40, or 20, and the least likely numbers are the extreme cases of 40 or 0.
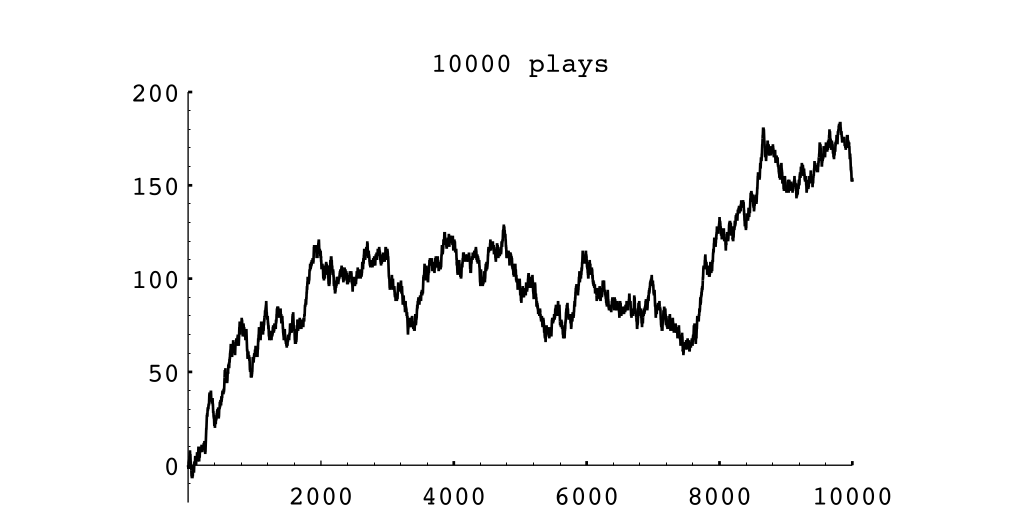
It is easy to settle this by simulating the game a large number of times and keeping track of the number of times that Peter’s final winnings are , and the number of times that Peter ends up being in the lead by . The proportions over all games then give estimates for the corresponding probabilities. The program HTSimulation carries out this simulation. Note that when there are an even number of tosses in the game, it is possible to be in the lead only an even number of times. We have simulated this game 10,000 times. The results are shown in Figures 1.2 and 1.3. These graphs, which we call spike graphs, were generated using the program Spikegraph. The vertical line, or spike, at position on the horizontal axis, has a height equal to the proportion of outcomes which equal . Our intuition about Peter’s final winnings was quite correct, but our intuition about the number of times Peter was in the lead was completely wrong. The simulation suggests that the least likely number of times in the lead is 20 and the most likely is 0 or 40. This is indeed correct, and the explanation for it is suggested by playing the game of heads or tails with a large number of tosses and looking at a graph of Peter’s winnings. In Figure 1.4 we show the results of a simulation of the game, for 1000 tosses and in Figure 1.5 for 10,000 tosses.
In the second example Peter was ahead most of the time. It is a remarkable fact, however, that, if play is continued long enough, Peter’s winnings will continue to come back to 0, but there will be very long times between the times that this happens. These and related results will be discussed in Chapter 12.
Figure 1.1: Peter’s winnings in 40 plays of heads or tails.
Figure 1.2: Distribution of winnings.
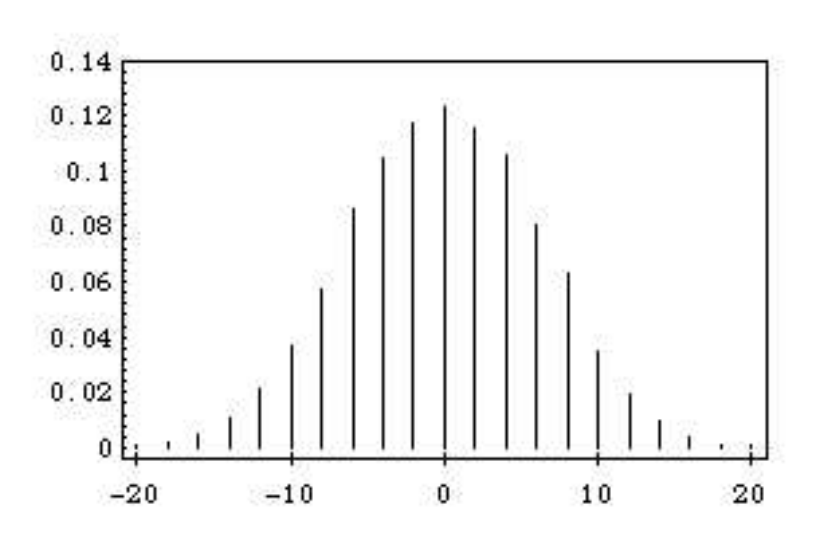
Figure 1.3: Distribution of number of times in the lead.
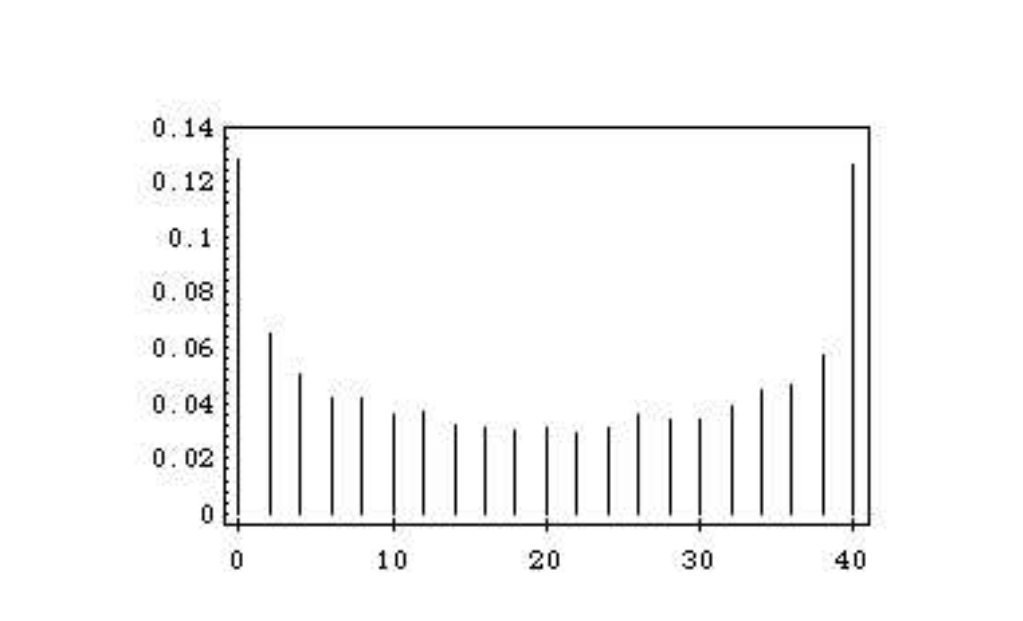
Figure 1.4: Peter’s winnings in 1000 plays of heads or tails.
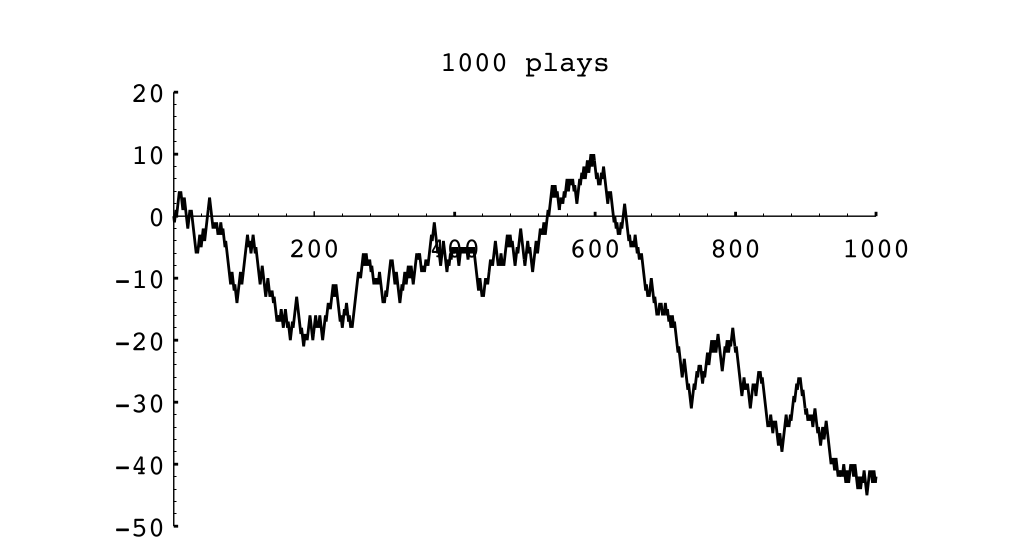
Figure 1.5: Peter’s winnings in 10,000 plays of heads or tails.
Answer
Let be identically distributed random variables such that Then , and . Thus . Therefore , and .
Exercise 6.2.15 §6.2 source ↗
Suppose that people have their hats returned at random. Let if the th person gets his or her own hat back and 0 otherwise. Let . Then is the total number of people who get their own hats back. Show that
(a) .
(b) for .
(c) (using (a) and (b)).
(d) .
Answer
(a) . Therefore, for .
(b) for
Therefore,
(c) (d)
Exercise 6.2.16 §6.2 source ↗
Let be the number of successes in independent trials. Use the program BinomialProbabilities (Section 3.2) to compute, for given , , and , the probability
(a) Let , and compute this probability for , 2, 3 and , 30, 50. Do the same for .
(b) Show that the standardized random variable has expected value 0 and variance 1. What do your results from (a) tell you about this standardized quantity ?
Answer
(a) For : For : (b) Use Exercise 12 and the fact that and . The two examples in (a) suggests that the probability that the outcome is within standard deviations is approximately the same for different values of . We shall see in Chapter 9 that the Central Limit Theorem explains why this is true.
Exercise 6.2.19 §6.2 source ↗
Let be a random variable taking on values , , …, with probabilities , , …, and with . Define the spread of as follows: This, like the standard deviation, is a way to quantify the amount that a random variable is spread out around its mean. Recall that the variance of a sum of mutually independent random variables is the sum of the individual variances. The square of the spread corresponds to the variance in a manner similar to the correspondence between the spread and the standard deviation. Show by an example that it is not necessarily true that the square of the spread of the sum of two independent random variables is the sum of the squares of the individual spreads.
Answer
Let , be independent random variables with Then Then Therefore and
Exercise 6.2.21 §6.2 source ↗
Let be a random variable with and . Show that the function defined by has its minimum value when .
Answer
Thus is a critical point. Since , we see that is the minimum point.
Exercise 6.2.23 §6.2 source ↗
If and are any two random variables, then the covariance of and is defined by Cov . Note that Cov. Show that, if and are independent, then Cov; and show, by an example, that we can have Cov and and not independent.
Answer
If and are independent, then Let have distribution Then let and . and have distributions Thus and , so . However, since , and are dependent.
Exercise 6.2.25 §6.2 source ↗
(Lamperti (Private communication.)) An urn contains exactly 5000 balls, of which an unknown number are white and the rest red, where is a random variable with a probability distribution on the integers 0, 1, 2, …, 5000.
(a) Suppose we know that . Show that this is enough to allow us to calculate the probability that a ball drawn at random from the urn will be white. What is this probability?
(b) We draw a ball from the urn, examine its color, replace it, and then draw another. Under what conditions, if any, are the results of the two drawings independent; that is, does
(c) Suppose the variance of is . What is the probability of drawing two white balls in part (b)?
Answer
(a) The expected value of is The probability that a white ball is drawn is Thus (b) To have we must have But this would mean that , or . Thus we will have independence only if takes on a specific value with probability 1.
(c) From (b) we see that Thus
Exercise 6.2.27 §6.2 source ↗
Referring to Exercise 6.1.30, find the variance for the number of boxes of Wheaties bought before getting half of the players’ pictures and the variance for the number of additional boxes needed to get the second half of the players’ pictures.
Assume that, every time you buy a box of Wheaties, you receive a picture of one of the players for the New York Yankees (see Exercise 3.2.34). Let be the number of additional boxes you have to buy, after you have obtained different pictures, in order to obtain the next new picture. Thus , is the number of boxes bought after this to obtain a picture different from the first pictured obtained, and so forth.
(a) Show that has a geometric distribution with .
(b) Simulate the experiment for a team with 26 players (25 would be more accurate but we want an even number). Carry out a number of simulations and estimate the expected time required to get the first 13 players and the expected time to get the second 13. How do these expectations compare?
(c) Show that, if there are players, the expected time to get the first half of the players is and the expected time to get the second half is
(d) In Example 6.11 we stated that Use this to estimate the expression in (c). Compare these estimates with the exact values and also with your estimates obtained by simulation for the case .
Assume that every time you buy a box of Wheaties, you receive one of the pictures of the players on the New York Yankees. Over a period of time, you buy boxes of Wheaties.
(a) Use Theorem 3.8 to show that the probability that you get all pictures is
Hint: Let be the event that you do not get the th player’s picture.
(b) Write a computer program to compute this probability. Use this program to find, for given , the smallest value of which will give probability of getting all pictures. Consider , 100, and 150 and show that is a good estimate for the number of boxes needed. (For a derivation of this estimate, see Feller. (W. Feller, Introduction to Probability Theory and its Applications, vol. I, 3rd ed. (New York: John Wiley & Sons, 1968), p. 106.))
Let be a probability distribution on a sample space , and let be a finite set of events. Then
That is, to find the probability that at least one of events occurs, first add the probability of each event, then subtract the probabilities of all possible two-way intersections, add the probability of all three-way intersections, and so forth. Proof. If the outcome occurs in at least one of the events , its probability is added exactly once by the left side of Equation 3.3. We must show that it is added exactly once by the right side of Equation 3.3. Assume that is in exactly of the sets. Then its probability is added times in the first term, subtracted times in the second, added times in the third term, and so forth. Thus, the total number of times that it is added is But Hence, If the outcome is not in any of the events , then it is not counted on either side of the equation.
We start keeping snowfall records this year and want to find the expected number of records that will occur in the next years. The first year is necessarily a record. The second year will be a record if the snowfall in the second year is greater than that in the first year. By symmetry, this probability is 1/2. More generally, let be 1 if the th year is a record and 0 otherwise. To find , we need only find the probability that the th year is a record. But the record snowfall for the first years is equally likely to fall in any one of these years, so . Therefore, if is the total number of records observed in the first years, This is the famous divergent harmonic series. It is easy to show that as . A more accurate approximation to is given by the expression where denotes Euler’s constant, and is approximately equal to .5772.
Therefore, in ten years the expected number of records is approximately ; the exact value is the sum of the first ten terms of the harmonic series which is 2.9290.
Answer
The number of boxes needed to get the j’th picture has a geometric distribution with Thus Therefore, for a team of 26 players the variance for the number of boxes needed to get the first half of the pictures would be and to get the second half would be Note that the variance for the second half is much larger than that for the first half.
Exercise 6.3.1 §6.3 source ↗
Let be a random variable with range and let be the density function of . Find and if, for ,
(a) .
(b) .
(c) .
(d) .
Answer
(a) ,
(b) ,
(c) ,
(d) ,
Exercise 6.3.3 §6.3 source ↗
The lifetime, measure in hours, of the ACME super light bulb is a random variable with density function , where . What is the expected lifetime of this light bulb? What is its variance?
Answer
,
Exercise 6.3.5 §6.3 source ↗
Let be a random variable with range and density function if and 0 otherwise.
(a) Show that (see Exercise 4).
(b) Show that .
(c) Show that .
(d) Find , , and if , , and sketch the graph of .
(e) Find , , and if , , and sketch the graph of .
Let be a random variable with range and density function if .
(a) Show that if , then .
(b) Show that if , then .
(c) Show that , and hence that .
(d) Show that .
Answer
(d) , ,
(e) , ,
Exercise 6.3.7 §6.3 source ↗
Let be a random variable with density function . Show, using elementary calculus, that the function takes its minimum value when , and in that case .
Answer
Thus Since , achieves its minimum when .
Exercise 6.3.9 §6.3 source ↗
Let , , and be independent random variables, each with mean and variance .
(a) Find the expected value and variance of .
(b) Find the expected value and variance of .
(c) Find the expected value of and .
Answer
(a) ,
(b) ,
(c) ,
Exercise 6.3.11 §6.3 source ↗
The Pilsdorff Beer Company runs a fleet of trucks along the 100 mile road from Hangtown to Dry Gulch. The trucks are old, and are apt to break down at any point along the road with equal probability. Where should the company locate a garage so as to minimize the expected distance from a typical breakdown to the garage? In other words, if is a random variable giving the location of the breakdown, measured, say, from Hangtown, and gives the location of the garage, what choice of minimizes ? Now suppose is not distributed uniformly over , but instead has density function . Then what choice of minimizes ?
Answer
In the case that is uniformly distributed on , one finds that which is minimized when .
When , one finds that which is minimized when .
Exercise 6.3.13 §6.3 source ↗
Let be a random variable that takes on nonnegative values and has distribution function . Show that Hint: Integrate by parts.
Illustrate this result by calculating by this method if has an exponential distribution for , and otherwise.
Answer
Integrating by parts, we have To justify this argment we have to show that approaches 0 as tends to infinity. To see this, we note that Letting tend to infinity, we have that Since both terms are non-negative, the only way this can happen is for the inequality to be an equality and the limit to be 0.
To illustrate this with the exponential density, we have
Exercise 6.3.15 §6.3 source ↗
Let be a random variable distributed uniformly over . Define a new random variable by (the greatest integer in ). Find the expected value of . Do the same for . Compute and . (Note that is the value of rounded off to the nearest smallest integer, while is the value of rounded off to the nearest integer. Which method of rounding off is better? Why?)
Answer
, , ,
is better, since it has the same expected value as and the variance is only slightly larger.
Exercise 6.3.17 §6.3 source ↗
Let and be random variables. The covariance is defined by (see Exercise 6.2.23)
(a) Show that .
(b) Using (a), show that , if and are independent. (Caution: the converse is not always true.)
(c) Show that .
If and are any two random variables, then the covariance of and is defined by Cov . Note that Cov. Show that, if and are independent, then Cov; and show, by an example, that we can have Cov and and not independent.
Answer
(a) (b) If and are independent, then , and so .
(c)
Exercise 6.3.19 §6.3 source ↗
Let and be independent random variables with uniform densities in . Let and . Find
(a) (see Exercise 18).
(b) .
(c) .
(d) .
Let and be random variables with positive variance. The correlation of and is defined as
(a) Using Exercise 17(c), show that
(b) Now show that
(c) Using (a) and (b), show that
Let and be random variables. The covariance is defined by (see Exercise 6.2.23)
(a) Show that .
(b) Using (a), show that , if and are independent. (Caution: the converse is not always true.)
(c) Show that .
If and are any two random variables, then the covariance of and is defined by Cov . Note that Cov. Show that, if and are independent, then Cov; and show, by an example, that we can have Cov and and not independent.
Answer
(a)
(b)
(c)
(d)
Exercise *6.3.21 §6.3 source ↗
When studying certain physiological data, such as heights of fathers and sons, it is often natural to assume that these data (e.g., the heights of the fathers and the heights of the sons) are described by random variables with normal densities. These random variables, however, are not independent but rather are correlated. For example, a two-dimensional standard normal density for correlated random variables has the form
(a) Show that and each have standard normal densities.
(b) Show that the correlation of and (see Exercise 18) is .
Let and be random variables with positive variance. The correlation of and is defined as
(a) Using Exercise 17(c), show that
(b) Now show that
(c) Using (a) and (b), show that
Let and be random variables. The covariance is defined by (see Exercise 6.2.23)
(a) Show that .
(b) Using (a), show that , if and are independent. (Caution: the converse is not always true.)
(c) Show that .
If and are any two random variables, then the covariance of and is defined by Cov . Note that Cov. Show that, if and are independent, then Cov; and show, by an example, that we can have Cov and and not independent.
For correlated random variables and it is natural to ask for the expected value for given . For example, Galton calculated the expected value of the height of a son given the height of the father. He used this to show that tall men can be expected to have sons who are less tall on the average. Similarly, students who do very well on one exam can be expected to do less well on the next exam, and so forth. This is called regression on the mean. To define this conditional expected value, we first define a conditional density of given by where is the joint density of and , and is the density for . Then the conditional expected value of given is For the normal density in Exercise 20, show that the conditional density of is normal with mean and variance . From this we see that if and are positively correlated , and if , then the expected value for given will be less than (i.e., we have regression on the mean).
Answer
We have which is a normal density with mean and variance . Thus,
Exercise 6.3.27 §6.3 source ↗
(from Hamming (ibid., pg. 205.)) A game is played as follows: A random number is chosen uniformly from . Then a sequence of random numbers is chosen independently and uniformly from . The game ends the first time that . You are then paid dollars. What is a fair entrance fee for this game?
Answer
Let represent the payment. Then Therefore, Thus, which diverges. Thus, you should be willing to pay any amount to play this game.
Loading chapter 7…
Exercises and answers are adapted from Grinstead and Snell's Introduction to Probability by The CHANCE Project, which is free to read and download, and are used under the GNU FDL licence. They are taken from the GNU version’s LaTeX source (4 July 2006), with answers from the authors’ published answers to the odd-numbered exercises, and set for the web, so they may differ slightly from the printed page. This adaptation is released under the same licence and is neither affiliated with nor endorsed by Grinstead and Snell or American Mathematical Society. Copyright (C) 2006 Peter G. Doyle. This work is a version of Grinstead and Snell's ‘Introduction to Probability, 2nd edition’, published by the American Mathematical Society, Copyright (C) 2003 Charles M. Grinstead and J. Laurie Snell.