Every problem in the chapter beside the book’s answer, a chapter at a time as you scroll.
Chapter 1: Integration
276 problems · 32 figuresCheckpoint 1.1 §1.1 source ↗
Answer
Checkpoint 1.2 §1.1 source ↗
Answer
Checkpoint 1.3 §1.1 source ↗
Answer
Checkpoint 1.4 §1.1 source ↗
Answer
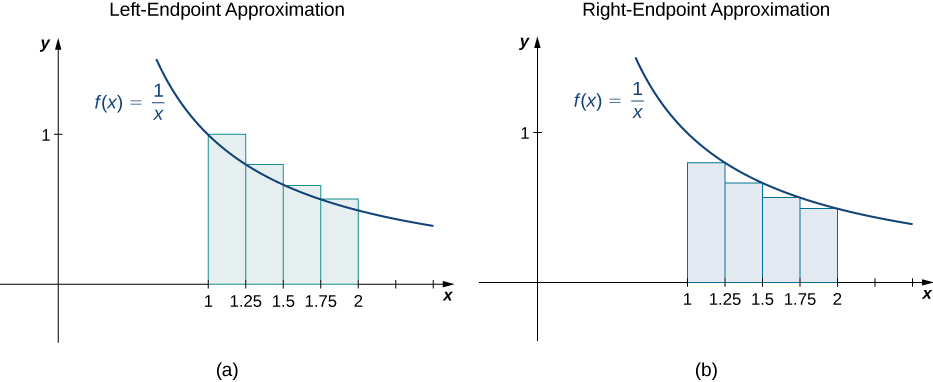
The left-endpoint approximation is 0.7595. The right-endpoint approximation is 0.6345.
Checkpoint 1.5 §1.1 source ↗
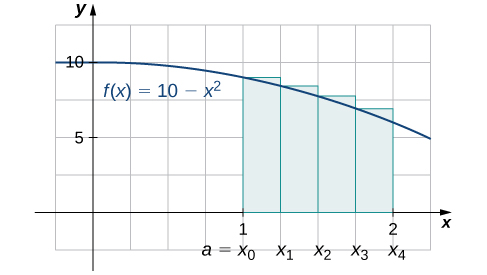
a. Find an upper sum for on let
b. Sketch the approximation.
Answer
a.
b.
Checkpoint 1.6 §1.1 source ↗
Answer
1-1 §1.1 source ↗
State whether the given sums are equal or unequal.
a. and
b. and
c. and
d. and
Answer
1-3 §1.1 source ↗
In the following exercises, use the rules for sums of powers of integers to compute the sums.
Answer
1-5 §1.1 source ↗
Suppose that and In the following exercises, compute the sums.
Answer
1-7 §1.1 source ↗
Suppose that and In the following exercises, compute the sums.
Answer
1-9 §1.1 source ↗
In the following exercises, use summation properties and formulas to rewrite and evaluate the sums.
Answer
1-11 §1.1 source ↗
In the following exercises, use summation properties and formulas to rewrite and evaluate the sums.
Answer
1-13 §1.1 source ↗
Let denote the left-endpoint sum using n subintervals and let denote the corresponding right-endpoint sum. In the following exercises, compute the indicated left and right sums for the given functions on the indicated interval.
R4 for on
Answer
1-15 §1.1 source ↗
Let denote the left-endpoint sum using n subintervals and let denote the corresponding right-endpoint sum. In the following exercises, compute the indicated left and right sums for the given functions on the indicated interval.
R6 for on
Answer
1-17 §1.1 source ↗
Let denote the left-endpoint sum using n subintervals and let denote the corresponding right-endpoint sum. In the following exercises, compute the indicated left and right sums for the given functions on the indicated interval.
L4 for on
Answer
1-19 §1.1 source ↗
Let denote the left-endpoint sum using n subintervals and let denote the corresponding right-endpoint sum. In the following exercises, compute the indicated left and right sums for the given functions on the indicated interval.
L8 for on
Answer
1-21 §1.1 source ↗
Let denote the left-endpoint sum using n subintervals and let denote the corresponding right-endpoint sum. In the following exercises, compute the indicated left and right sums for the given functions on the indicated interval.
Compute the left and right Riemann sums—L6 and R6, respectively—for on Compute their average value and compare it with the area under the graph of f.
Answer
1-23 §1.1 source ↗
Let denote the left-endpoint sum using n subintervals and let denote the corresponding right-endpoint sum. In the following exercises, compute the indicated left and right sums for the given functions on the indicated interval.
Compute the left and right Riemann sums—L6 and R6, respectively—for on and compare their values.
Answer
1-25 §1.1 source ↗
Express the following endpoint sums in sigma notation but do not evaluate them.
L10 for on
Answer
1-27 §1.1 source ↗
Express the following endpoint sums in sigma notation but do not evaluate them.
R100 for on
Answer
1-29 §1.1 source ↗
In the following exercises, graph the function then use a calculator or a computer program to evaluate the following left and right endpoint sums. If the two agree, say "neither."
[T] L100 and R100 for on the interval
Answer
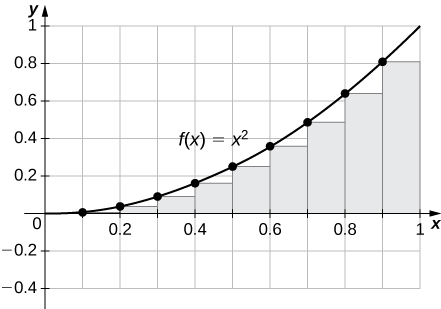
The plot shows that the left Riemann sum is an underestimate because the function is increasing. Similarly, the right Riemann sum is an overestimate. The area lies between the left and right Riemann sums. Ten rectangles are shown for visual clarity. This behavior persists for more rectangles.
1-31 §1.1 source ↗
In the following exercises, graph the function then use a calculator or a computer program to evaluate the following left and right endpoint sums. If the two agree, say "neither."
[T] L100 and R100 for on the interval
Answer
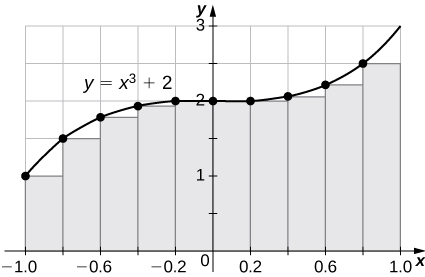
The left endpoint sum is an underestimate because the function is increasing. Similarly, a right endpoint approximation is an overestimate. The area lies between the left and right endpoint estimates.
1-33 §1.1 source ↗
In the following exercises, graph the function then use a calculator or a computer program to evaluate the following left and right endpoint sums. If the two agree, say "neither."
[T] L100 and R100 for on the interval
Answer
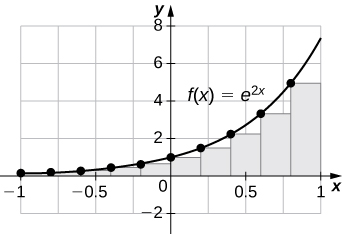
The plot shows that the left Riemann sum is an underestimate because the function is increasing. Ten rectangles are shown for visual clarity. This behavior persists for more rectangles.
1-35 §1.1 source ↗
In the following exercises, graph the function then use a calculator or a computer program to evaluate the following left and right endpoint sums. If the two agree, say "neither."
Let denote the total rainfall in Portland on the jth day of the year in 2009. Interpret
Answer
1-37 §1.1 source ↗
In the following exercises, graph the function then use a calculator or a computer program to evaluate the following left and right endpoint sums. If the two agree, say "neither."
To help get in shape, Joe gets a new pair of running shoes. If Joe runs 1 mi each day in week 1 and adds mi to his daily routine each week, what is the total mileage on Joe’s shoes after 25 weeks?
Answer
1-39 §1.1 source ↗
In the following exercises, graph the function then use a calculator or a computer program to evaluate the following left and right endpoint sums. If the two agree, say "neither."
The following table gives the approximate increase in sea level in inches over 20 years starting in the given year. Estimate the net change in mean sea level from 1870 to 2010.
| Starting Year | 20-Year Change |
|---|---|
| 1870 | 0.3 |
| 1890 | 1.5 |
| 1910 | 0.2 |
| 1930 | 2.8 |
| 1950 | 0.7 |
| 1970 | 1.1 |
| 1990 | 1.5 |
Answer
1-41 §1.1 source ↗
In the following exercises, graph the function then use a calculator or a computer program to evaluate the following left and right endpoint sums. If the two agree, say "neither."
The following table gives the percent growth of the U.S. population beginning in July of the year indicated. If the U.S. population was 281,421,906 in July 2000, estimate the U.S. population in July 2010.
(Hint: To obtain the population in July 2001, multiply the population in July 2000 by 1.0112 to get 284,573,831.)
| Year | % Change/Year |
|---|---|
| 2000 | 1.12 |
| 2001 | 0.99 |
| 2002 | 0.93 |
| 2003 | 0.86 |
| 2004 | 0.93 |
| 2005 | 0.93 |
| 2006 | 0.97 |
| 2007 | 0.96 |
| 2008 | 0.95 |
| 2009 | 0.88 |
Answer
1-43 §1.1 source ↗
In the following exercises, estimate the areas under the curves by computing the left Riemann sums, L8.
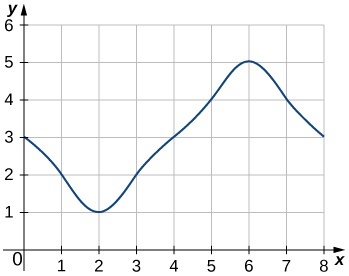
Answer
1-45 §1.1 source ↗
In the following exercises, estimate the areas under the curves by computing the left Riemann sums, L8.
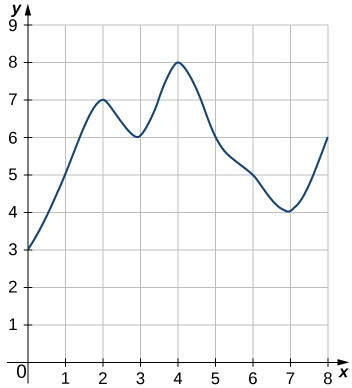
Answer
1-47 §1.1 source ↗
In the following exercises, estimate the areas under the curves by computing the left Riemann sums, L8.
[T] Use a computer algebra system to compute the Riemann sum, LN, for for on
Answer
1-49 §1.1 source ↗
In the following exercises, use a calculator or a computer program to evaluate the endpoint sums RN and LN for How do these estimates compare with the exact answers, which you can find via geometry?
[T] on the interval
Answer
1-51 §1.1 source ↗
In the following exercises, use a calculator or a computer program to evaluate the endpoint sums RN and LN for
[T] on the interval which has an exact area of
Answer
1-53 §1.1 source ↗
In the following exercises, use a calculator or a computer program to evaluate the endpoint sums RN and LN for
Explain why, if and f is increasing on that the left endpoint estimate is a lower bound for the area below the graph of f on
Answer
1-55 §1.1 source ↗
In the following exercises, use a calculator or a computer program to evaluate the endpoint sums RN and LN for
Show that, in general,
Answer
1-57 §1.1 source ↗
In the following exercises, use a calculator or a computer program to evaluate the endpoint sums RN and LN for
For each of the three graphs:
a. Obtain a lower bound for the area enclosed by the curve by adding the areas of the squares enclosed completely by the curve.
b. Obtain an upper bound for the area by adding to the areas of the squares enclosed partially by the curve.
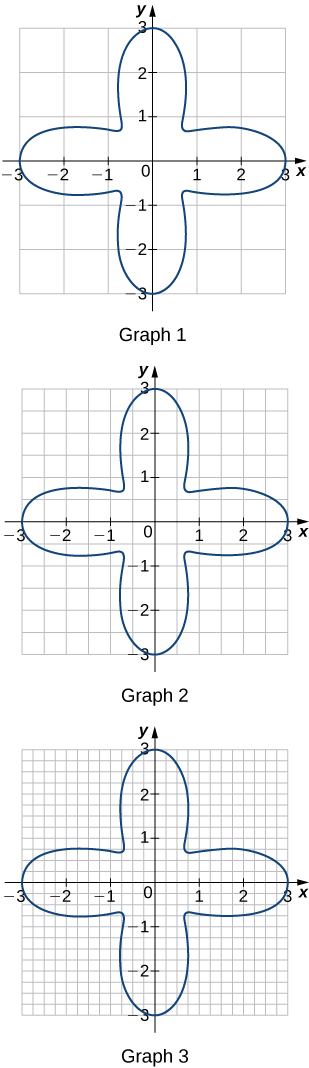
Answer
1-59 §1.1 source ↗
In the following exercises, use a calculator or a computer program to evaluate the endpoint sums RN and LN for
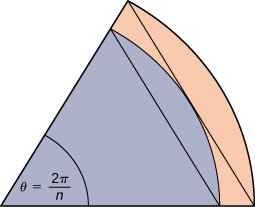
A unit circle is made up of n wedges equivalent to the inner wedge in the figure. The base of the inner triangle is 1 unit and its height is The base of the outer triangle is and the height is Use this information to argue that the area of a unit circle is equal to π.
Answer
Checkpoint 1.7 §1.2 source ↗
Answer
Checkpoint 1.8 §1.2 source ↗
Answer
Checkpoint 1.9 §1.2 source ↗
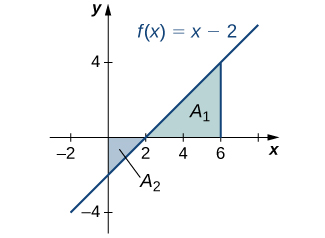
Find the net signed area of over the interval illustrated in the following image.
Answer
Checkpoint 1.10 §1.2 source ↗
Answer
Checkpoint 1.11 §1.2 source ↗
Answer
Checkpoint 1.12 §1.2 source ↗
Answer
Checkpoint 1.13 §1.2 source ↗
Answer
1-61 §1.2 source ↗
In the following exercises, express the limits as integrals.
over
Answer
1-63 §1.2 source ↗
In the following exercises, express the limits as integrals.
over
Answer
1-65 §1.2 source ↗
In the following exercises, given Ln or Rn as indicated, express their limits as as definite integrals, identifying the correct intervals.
Answer
1-67 §1.2 source ↗
In the following exercises, given Ln or Rn as indicated, express their limits as as definite integrals, identifying the correct intervals.
Answer
1-69 §1.2 source ↗
In the following exercises, given Ln or Rn as indicated, express their limits as as definite integrals, identifying the correct intervals.
Answer
1-71 §1.2 source ↗
In the following exercises, evaluate the integrals of the functions graphed using the formulas for areas of triangles and circles, and subtracting the areas below the x-axis.
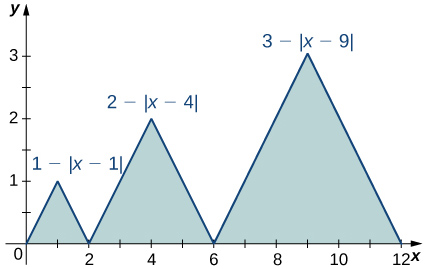
Answer
1-73 §1.2 source ↗
In the following exercises, evaluate the integrals of the functions graphed using the formulas for areas of triangles and circles, and subtracting the areas below the x-axis.
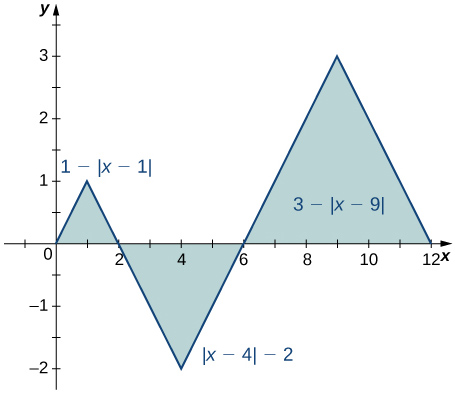
Answer
1-75 §1.2 source ↗
In the following exercises, evaluate the integrals of the functions graphed using the formulas for areas of triangles and circles, and subtracting the areas below the x-axis.
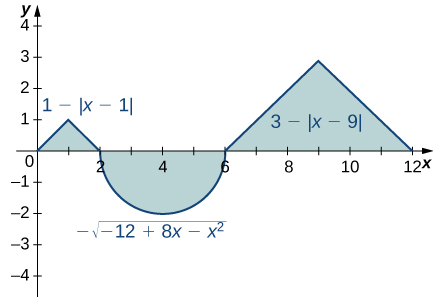
Answer
1-77 §1.2 source ↗
In the following exercises, evaluate the integral using area formulas.
Answer
1-79 §1.2 source ↗
In the following exercises, evaluate the integral using area formulas.
Answer
1-81 §1.2 source ↗
In the following exercises, evaluate the integral using area formulas.
Answer
1-83 §1.2 source ↗
In the following exercises, evaluate the integral using area formulas.
Answer
1-85 §1.2 source ↗
In the following exercises, use averages of values at the left (L) and right (R) endpoints to compute the integrals of the piecewise linear functions with graphs that pass through the given list of points over the indicated intervals.
over
Answer
1-87 §1.2 source ↗
In the following exercises, use averages of values at the left (L) and right (R) endpoints to compute the integrals of the piecewise linear functions with graphs that pass through the given list of points over the indicated intervals.
over
Answer
1-89 §1.2 source ↗
Suppose that and and and In the following exercises, compute the integrals.
Answer
1-91 §1.2 source ↗
Suppose that and and and In the following exercises, compute the integrals.
Answer
1-93 §1.2 source ↗
Suppose that and and and In the following exercises, compute the integrals.
Answer
1-95 §1.2 source ↗
In the following exercises, use the identity to compute the integrals.
Answer
1-97 §1.2 source ↗
In the following exercises, find the net signed area between and the x-axis.
(Hint: Look at the graph of f.)
Answer
1-99 §1.2 source ↗
In the following exercises, given that and compute the integrals.
Answer
1-101 §1.2 source ↗
In the following exercises, given that and compute the integrals.
Answer
1-103 §1.2 source ↗
In the following exercises, given that and compute the integrals.
Answer
1-105 §1.2 source ↗
In the following exercises, use the comparison theorem.
Show that
Answer
1-107 §1.2 source ↗
In the following exercises, use the comparison theorem.
Show that
Answer
1-109 §1.2 source ↗
In the following exercises, use the comparison theorem.
Show that
Answer
1-111 §1.2 source ↗
In the following exercises, find the average value fave of f between a and b, and find a point c, where
Answer
1-113 §1.2 source ↗
In the following exercises, find the average value fave of f between a and b, and find a point c, where
Answer
1-115 §1.2 source ↗
In the following exercises, find the average value fave of f between a and b, and find a point c, where
Answer
1-117 §1.2 source ↗
In the following exercises, approximate the average value using Riemann sums L100 and R100. How does your answer compare with the exact given answer?
[T] over the interval the exact solution is
Answer
1-119 §1.2 source ↗
In the following exercises, approximate the average value using Riemann sums L100 and R100. How does your answer compare with the exact given answer?
[T] over the interval the exact solution is
Answer
1-121 §1.2 source ↗
In the following exercises, compute the average value using the left Riemann sums LN for How does the accuracy compare with the given exact value?
[T] over the interval the exact solution is
Answer
1-123 §1.2 source ↗
In the following exercises, compute the average value using the left Riemann sums LN for How does the accuracy compare with the given exact value?
[T] over the interval the exact solution is
Answer
1-125 §1.2 source ↗
In the following exercises, compute the average value using the left Riemann sums LN for How does the accuracy compare with the given exact value?
Suppose that and Show that
Answer
1-127 §1.2 source ↗
In the following exercises, compute the average value using the left Riemann sums LN for How does the accuracy compare with the given exact value?
Show that the average value of over is equal to Without further calculation, determine whether the average value of over is also equal to
Answer
1-129 §1.2 source ↗
In the following exercises, compute the average value using the left Riemann sums LN for How does the accuracy compare with the given exact value?
Suppose that parabola opens downward and has a vertex of For which interval is as large as possible?
Answer
1-131 §1.2 source ↗
In the following exercises, compute the average value using the left Riemann sums LN for How does the accuracy compare with the given exact value?
Suppose f and g are continuous functions such that for every subinterval of Explain why for all values of x.
Answer
1-133 §1.2 source ↗
In the following exercises, compute the average value using the left Riemann sums LN for How does the accuracy compare with the given exact value?
Suppose that can be partitioned. taking such that the average value of f over each subinterval is equal to 1 for each Explain why the average value of f over is also equal to 1.
Answer
1-135 §1.2 source ↗
In the following exercises, compute the average value using the left Riemann sums LN for How does the accuracy compare with the given exact value?
Suppose that for each i such that one has Show that
Answer
1-137 §1.2 source ↗
In the following exercises, compute the average value using the left Riemann sums LN for How does the accuracy compare with the given exact value?
[T] Compute the left and right Riemann sums, L10 and R10, and their average for over Given that to how many decimal places is accurate?
Answer
1-139 §1.2 source ↗
In the following exercises, compute the average value using the left Riemann sums LN for How does the accuracy compare with the given exact value?
Estimate using the left and right endpoint sums, each with a single rectangle. How does the average of these left and right endpoint sums compare with the actual value
Answer
1-141 §1.2 source ↗
In the following exercises, compute the average value using the left Riemann sums LN for How does the accuracy compare with the given exact value?
From the graph of shown:
a. Explain why
b. Explain why, in general, for any value of a.
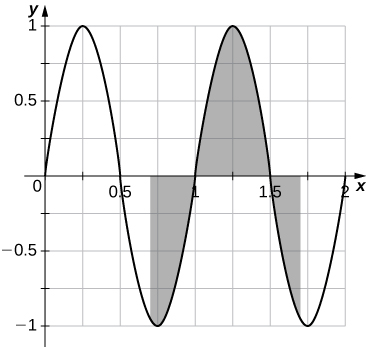
Answer
1-143 §1.2 source ↗
In the following exercises, compute the average value using the left Riemann sums LN for How does the accuracy compare with the given exact value?
If f is 1-periodic and is it necessarily true that for all A?
Answer
Checkpoint 1.14 §1.3 source ↗
Answer
Checkpoint 1.15 §1.3 source ↗
Answer
Checkpoint 1.16 §1.3 source ↗
Answer
Checkpoint 1.17 §1.3 source ↗
Answer
Checkpoint 1.18 §1.3 source ↗
Answer
Checkpoint 1.19 §1.3 source ↗
Answer
Checkpoint 1.20 §1.3 source ↗
Answer
1-145 §1.3 source ↗
Answer
1-147 §1.3 source ↗
Answer
1-149 §1.3 source ↗
In the following exercises, use the Fundamental Theorem of Calculus, Part 1, to find each derivative.
Answer
1-151 §1.3 source ↗
In the following exercises, use the Fundamental Theorem of Calculus, Part 1, to find each derivative.
Answer
1-153 §1.3 source ↗
In the following exercises, use the Fundamental Theorem of Calculus, Part 1, to find each derivative.
Answer
1-155 §1.3 source ↗
In the following exercises, use the Fundamental Theorem of Calculus, Part 1, to find each derivative.
Answer
1-157 §1.3 source ↗
In the following exercises, use the Fundamental Theorem of Calculus, Part 1, to find each derivative.
Answer
1-159 §1.3 source ↗
In the following exercises, use the Fundamental Theorem of Calculus, Part 1, to find each derivative.
Answer
1-161 §1.3 source ↗
In the following exercises, use the Fundamental Theorem of Calculus, Part 1, to find each derivative.
The graph of where f is a piecewise constant function, is shown here.
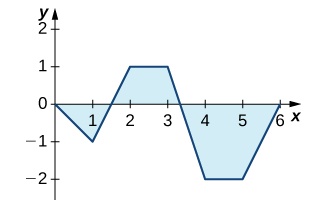
a. Over which intervals is f positive? Over which intervals is it negative? Over which intervals, if any, is it equal to zero?
b. What are the maximum and minimum values of f?
c. What is the average value of f?
Answer
1-163 §1.3 source ↗
In the following exercises, use the Fundamental Theorem of Calculus, Part 1, to find each derivative.
The graph of where ℓ is a piecewise linear function, is shown here.
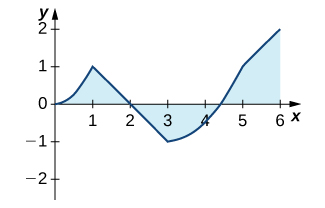
a. Over which intervals is ℓ positive? Over which intervals is it negative? Over which, if any, is it zero?
b. Over which intervals is ℓ increasing? Over which is it decreasing? Over which intervals, if any, is it constant?
c. What is the average value of ℓ?
Answer
1-165 §1.3 source ↗
In the following exercises, use a calculator to estimate the area under the curve by computing T10, the average of the left- and right-endpoint Riemann sums using rectangles. Then, using the Fundamental Theorem of Calculus, Part 2, determine the exact area.
[T] over
Answer
1-167 §1.3 source ↗
In the following exercises, use a calculator to estimate the area under the curve by computing T10, the average of the left- and right-endpoint Riemann sums using rectangles. Then, using the Fundamental Theorem of Calculus, Part 2, determine the exact area.
[T] over
Answer
1-169 §1.3 source ↗
In the following exercises, use a calculator to estimate the area under the curve by computing T10, the average of the left- and right-endpoint Riemann sums using rectangles. Then, using the Fundamental Theorem of Calculus, Part 2, determine the exact area.
[T] over
Answer
1-171 §1.3 source ↗
In the following exercises, evaluate each definite integral using the Fundamental Theorem of Calculus, Part 2.
Answer
1-173 §1.3 source ↗
In the following exercises, evaluate each definite integral using the Fundamental Theorem of Calculus, Part 2.
Answer
1-175 §1.3 source ↗
In the following exercises, evaluate each definite integral using the Fundamental Theorem of Calculus, Part 2.
Answer
1-177 §1.3 source ↗
In the following exercises, evaluate each definite integral using the Fundamental Theorem of Calculus, Part 2.
Answer
1-179 §1.3 source ↗
In the following exercises, evaluate each definite integral using the Fundamental Theorem of Calculus, Part 2.
Answer
1-181 §1.3 source ↗
In the following exercises, evaluate each definite integral using the Fundamental Theorem of Calculus, Part 2.
Answer
1-183 §1.3 source ↗
In the following exercises, evaluate each definite integral using the Fundamental Theorem of Calculus, Part 2.
Answer
1-185 §1.3 source ↗
In the following exercises, evaluate each definite integral using the Fundamental Theorem of Calculus, Part 2.
Answer
1-187 §1.3 source ↗
In the following exercises, evaluate each definite integral using the Fundamental Theorem of Calculus, Part 2.
Answer
1-189 §1.3 source ↗
In the following exercises, evaluate each definite integral using the Fundamental Theorem of Calculus, Part 2.
Answer
1-191 §1.3 source ↗
In the following exercises, use the evaluation theorem to express the integral as a function
Answer
1-193 §1.3 source ↗
In the following exercises, use the evaluation theorem to express the integral as a function
Answer
1-195 §1.3 source ↗
In the following exercises, identify the roots of the integrand to remove absolute values, then evaluate using the Fundamental Theorem of Calculus, Part 2.
Answer
1-197 §1.3 source ↗
In the following exercises, identify the roots of the integrand to remove absolute values, then evaluate using the Fundamental Theorem of Calculus, Part 2.
Answer
1-199 §1.3 source ↗
In the following exercises, identify the roots of the integrand to remove absolute values, then evaluate using the Fundamental Theorem of Calculus, Part 2.
Suppose the rate of gasoline consumption over the course of a year in the United States can be modeled by a sinusoidal function of the form gal/mo.
a. What is the average monthly consumption, and for which values of t is the rate at time t equal to the average rate?
b. What is the number of gallons of gasoline consumed in the United States in a year?
c. Write an integral that expresses the average monthly U.S. gas consumption during the part of the year between the beginning of April and the end of September
Answer
1-201 §1.3 source ↗
In the following exercises, identify the roots of the integrand to remove absolute values, then evaluate using the Fundamental Theorem of Calculus, Part 2.
Explain why, if f is continuous over and is not equal to a constant, there is at least one point such that and at least one point such that
Answer
1-203 §1.3 source ↗
In the following exercises, identify the roots of the integrand to remove absolute values, then evaluate using the Fundamental Theorem of Calculus, Part 2.
A point on an ellipse with major axis length 2a and minor axis length 2b has the coordinates
a. Show that the distance from this point to the focus at is where
b. Use these coordinates to show that the average distance from a point on the ellipse to the focus at with respect to angle θ, is a.
Answer
1-205 §1.3 source ↗
In the following exercises, identify the roots of the integrand to remove absolute values, then evaluate using the Fundamental Theorem of Calculus, Part 2.
The force of gravitational attraction between the Sun and a planet is where m is the mass of the planet, M is the mass of the Sun, G is a universal constant, and is the distance between the Sun and the planet when the planet is at an angle θ with the major axis of its orbit. Assuming that M, m, and the ellipse parameters a and b (half-lengths of the major and minor axes) are given, set up—but do not evaluate—an integral that expresses in terms of the average gravitational force between the Sun and the planet.
Answer
Checkpoint 1.21 §1.4 source ↗
Answer
Checkpoint 1.22 §1.4 source ↗
Answer
Checkpoint 1.23 §1.4 source ↗
Suppose that, instead of remaining steady during the second half hour of Andrew’s outing, the wind starts to die down according to the function In other words, the wind speed is given by
Under these conditions, how far from his starting point is Andrew after 1 hour?
Answer
Checkpoint 1.24 §1.4 source ↗
Answer
1-207 §1.4 source ↗
Use basic integration formulas to compute the following antiderivatives or definite integrals.
Answer
1-209 §1.4 source ↗
Use basic integration formulas to compute the following antiderivatives or definite integrals.
Answer
1-211 §1.4 source ↗
Use basic integration formulas to compute the following antiderivatives or definite integrals.
Answer
1-213 §1.4 source ↗
Use basic integration formulas to compute the following antiderivatives or definite integrals.
Write an integral that expresses the increase in the perimeter of a square when its side length s increases from 2 units to 4 units and evaluate the integral.
Answer
1-215 §1.4 source ↗
Use basic integration formulas to compute the following antiderivatives or definite integrals.
A regular N-gon (an N-sided polygon with sides that have equal length s, such as a pentagon or hexagon) has perimeter Ns. Write an integral that expresses the increase in perimeter of a regular N-gon when the length of each side increases from 1 unit to 2 units and evaluate the integral.
Answer
1-217 §1.4 source ↗
Use basic integration formulas to compute the following antiderivatives or definite integrals.
A dodecahedron is a Platonic solid with a surface that consists of 12 pentagons, each of equal area. By how much does the surface area of a dodecahedron increase as the side length of each pentagon doubles from 1 unit to 2 units?
Answer
1-219 §1.4 source ↗
Use basic integration formulas to compute the following antiderivatives or definite integrals.
Write an integral that quantifies the change in the area of the surface of a cube when its side length doubles from s unit to 2s units and evaluate the integral.
Answer
1-221 §1.4 source ↗
Use basic integration formulas to compute the following antiderivatives or definite integrals.
Write an integral that quantifies the increase in the surface area of a sphere as its radius doubles from R unit to 2R units and evaluate the integral.
Answer
1-223 §1.4 source ↗
Use basic integration formulas to compute the following antiderivatives or definite integrals.
Suppose that a particle moves along a straight line with velocity where (in meters per second). Find the displacement at time t and the total distance traveled up to
Answer
1-225 §1.4 source ↗
Use basic integration formulas to compute the following antiderivatives or definite integrals.
Suppose that a particle moves along a straight line with velocity defined by where (in meters per second). Find the displacement at time t and the total distance traveled up to
Answer
1-227 §1.4 source ↗
Use basic integration formulas to compute the following antiderivatives or definite integrals.
A ball is thrown upward from a height of 1.5 m at an initial speed of 40 m/sec. Acceleration resulting from gravity is −9.8 m/sec2. Neglecting air resistance, solve for the velocity and the height of the ball t seconds after it is thrown and before it returns to the ground.
Answer
1-229 §1.4 source ↗
Use basic integration formulas to compute the following antiderivatives or definite integrals.
The area of a circular shape is growing at a constant rate. If the area increases from 4π units to 9π units between times and find the net change in the radius during that time.
Answer
1-231 §1.4 source ↗
Use basic integration formulas to compute the following antiderivatives or definite integrals.
Water flows into a conical tank with cross-sectional area πx2 at height x and volume up to height x. If water flows into the tank at a rate of 1 m3/min, find the height of water in the tank after 5 min. Find the change in height between 5 min and 10 min.
Answer
1-233 §1.4 source ↗
Use basic integration formulas to compute the following antiderivatives or definite integrals.
The following table lists the electrical power in gigawatts—the rate at which energy is consumed—used in a certain city for different hours of the day, in a typical 24-hour period, with hour 1 corresponding to midnight to 1 a.m.
| Hour | Power | Hour | Power |
|---|---|---|---|
| 1 | 28 | 13 | 48 |
| 2 | 25 | 14 | 49 |
| 3 | 24 | 15 | 49 |
| 4 | 23 | 16 | 50 |
| 5 | 24 | 17 | 50 |
| 6 | 27 | 18 | 50 |
| 7 | 29 | 19 | 46 |
| 8 | 32 | 20 | 43 |
| 9 | 34 | 21 | 42 |
| 10 | 39 | 22 | 40 |
| 11 | 42 | 23 | 37 |
| 12 | 46 | 24 | 34 |
Find the total amount of energy in gigawatt-hours (gW-h) consumed by the city in a typical 24-hour period.
Answer
1-235 §1.4 source ↗
Use basic integration formulas to compute the following antiderivatives or definite integrals.
The data in the following table are used to estimate the average power output produced by Peter Sagan for each of the last 18 sec of Stage 1 of the 2012 Tour de France.
Estimate the net energy used in kilojoules (kJ), noting that 1W = 1 J/s, and the average power output by Sagan during this time interval.
| Second | Watts | Second | Watts |
|---|---|---|---|
| 1 | 600 | 10 | 1200 |
| 2 | 500 | 11 | 1170 |
| 3 | 575 | 12 | 1125 |
| 4 | 1050 | 13 | 1100 |
| 5 | 925 | 14 | 1075 |
| 6 | 950 | 15 | 1000 |
| 7 | 1050 | 16 | 950 |
| 8 | 950 | 17 | 900 |
| 9 | 1100 | 18 | 780 |
Answer
1-237 §1.4 source ↗
Use basic integration formulas to compute the following antiderivatives or definite integrals.
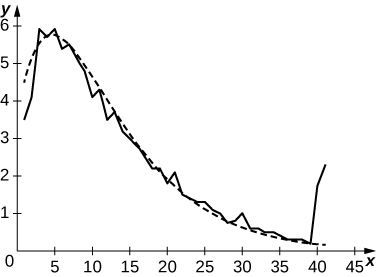
The distribution of incomes as of 2012 in the United States in $5000 increments is given in the following table. The kth row denotes the percentage of households with incomes between and The row contains all households with income between $200,000 and $250,000.
a. Estimate the percentage of U.S. households in 2012 with incomes less than $55,000.
b. What percentage of households had incomes exceeding $85,000?
c. Plot the data and try to fit its shape to that of a graph of the form for suitable
| 0 | 3.5 | 11 | 3.5 | 21 | 1.5 | 31 | 0.6 |
| 1 | 4.1 | 12 | 3.7 | 22 | 1.4 | 32 | 0.5 |
| 2 | 5.9 | 13 | 3.2 | 23 | 1.3 | 33 | 0.5 |
| 3 | 5.7 | 14 | 3.0 | 24 | 1.3 | 34 | 0.4 |
| 4 | 5.9 | 15 | 2.8 | 25 | 1.1 | 35 | 0.3 |
| 5 | 5.4 | 16 | 2.5 | 26 | 1.0 | 36 | 0.3 |
| 6 | 5.5 | 17 | 2.2 | 27 | 0.75 | 37 | 0.3 |
| 7 | 5.1 | 18 | 2.2 | 28 | 0.8 | 38 | 0.2 |
| 8 | 4.8 | 19 | 1.8 | 29 | 1.0 | 39 | 1.8 |
| 9 | 4.1 | 20 | 2.1 | 30 | 0.6 | 40 | 2.3 |
| 10 | 4.3 |
Answer
a. 54.3%; b. 27.00%; c. The curve in the following plot is
1-239 §1.4 source ↗
Use basic integration formulas to compute the following antiderivatives or definite integrals.
For a given motor vehicle, the maximum achievable deceleration from braking is approximately 7 m/sec2 on dry concrete. On wet asphalt, it is approximately 2.5 m/sec2. Given that 1 mph corresponds to 0.447 m/sec, find the total distance that a car travels in meters on dry concrete after the brakes are applied until it comes to a complete stop if the initial velocity is 67 mph (30 m/sec) or if the initial braking velocity is 56 mph (25 m/sec). Find the corresponding distances if the surface is slippery wet asphalt.
Answer
1-241 §1.4 source ↗
Use basic integration formulas to compute the following antiderivatives or definite integrals.
Sandra is a 25-year old woman who weighs 120 lb. She burns cal/hr while walking on her treadmill. Her caloric intake from drinking Gatorade is 100t calories/hour during the tth hour. What is her net decrease in calories after walking for 3 hours?
Answer
1-243 §1.4 source ↗
Use basic integration formulas to compute the following antiderivatives or definite integrals.
Although some engines are more efficient at given a horsepower than others, on average, fuel efficiency decreases with horsepower at a rate of mpg/horsepower. If a typical 50-horsepower engine has an average fuel efficiency of 32 mpg, what is the average fuel efficiency of an engine with the following horsepower: 150, 300, 450?
Answer
1-245 §1.4 source ↗
Use basic integration formulas to compute the following antiderivatives or definite integrals.
[T] The following table provides hypothetical data regarding the level of service for a certain highway.
a. Plot vehicles per hour per lane on the x-axis and highway speed on the y-axis.
b. Compute the average decrease in speed (in miles per hour) per unit increase in congestion (vehicles per hour per lane) as the latter increases from 600 to 1000, from 1000 to 1500, and from 1500 to 2100. Does the decrease in miles per hour depend linearly on the increase in vehicles per hour per lane?
c. Plot minutes per mile (60 times the reciprocal of miles per hour) as a function of vehicles per hour per lane. Is this function linear?
| Highway Speed Range (mph) | Vehicles per Hour per Lane | Density Range (vehicles/mi) |
|---|---|---|
| > 60 | < 600 | < 10 |
| 60–57 | 600–1000 | 10–20 |
| 57–54 | 1000–1500 | 20–30 |
| 54–46 | 1500–1900 | 30–45 |
| 46–30 | 1900–2100 | 45–70 |
| <30 | Unstable | 70–200 |
Answer
a.
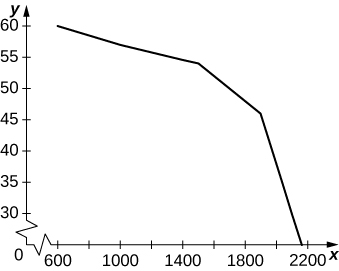
b. Between 600 and 1000 the average decrease in vehicles per hour per lane is −0.0075. Between 1000 and 1500 it is −0.006 per vehicles per hour per lane, and between 1500 and 2100 it is −0.04 vehicles per hour per lane. c.
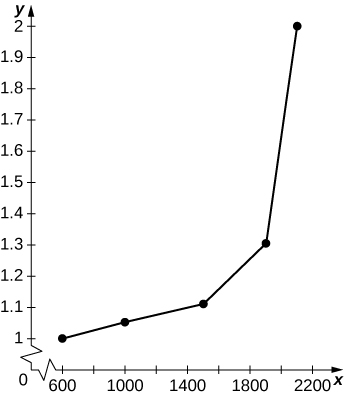
The graph is nonlinear, with minutes per mile increasing dramatically as vehicles per hour per lane reach 2000.
1-247 §1.4 source ↗
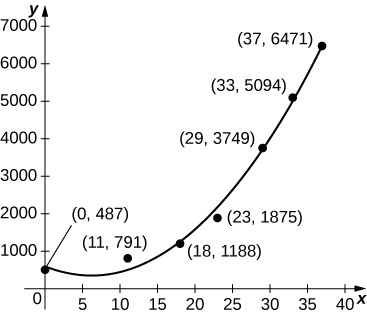
For the next two exercises use the data in the following table, which displays bald eagle populations from 1963 to 2000 in the continental United States.
[T] The graph below plots the cubic against the data in the preceding table, normalized so that corresponds to 1963. Estimate the average number of bald eagles per year present for the 37 years by computing the average value of p over
| Year | Population of Breeding Pairs of Bald Eagles |
|---|---|
| 1963 | 487 |
| 1974 | 791 |
| 1981 | 1188 |
| 1986 | 1875 |
| 1992 | 3749 |
| 1996 | 5094 |
| 2000 | 6471 |
Answer
1-249 §1.4 source ↗
As a car accelerates, it does not accelerate at a constant rate; rather, the acceleration is variable. For the following exercises, use the following table, which contains the acceleration measured at every second as a driver merges onto a freeway.
| Time (sec) | Acceleration (mph/sec) |
|---|---|
| 1 | 11.2 |
| 2 | 10.6 |
| 3 | 8.1 |
| 4 | 5.4 |
| 5 | 0 |
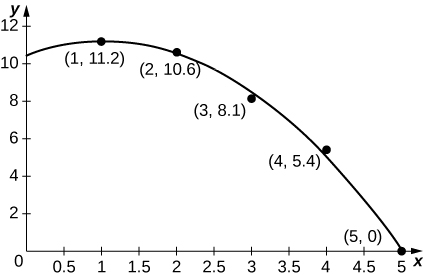
As a car accelerates, it does not accelerate at a constant rate; rather, the acceleration is variable. For the next three exercises use the following table, which contains the acceleration measured at every second as a driver merges onto a freeway.
[T] The accompanying graph plots the best quadratic fit, to the data from the preceding table. Compute the average value of to estimate the average acceleration between and
| Time (sec) | Acceleration (mph/sec) |
|---|---|
| 1 | 11.2 |
| 2 | 10.6 |
| 3 | 8.1 |
| 4 | 5.4 |
| 5 | 0 |
Answer
1-251 §1.4 source ↗
As a car accelerates, it does not accelerate at a constant rate; rather, the acceleration is variable. For the following exercises, use the following table, which contains the acceleration measured at every second as a driver merges onto a freeway.
| Time (sec) | Acceleration (mph/sec) |
|---|---|
| 1 | 11.2 |
| 2 | 10.6 |
| 3 | 8.1 |
| 4 | 5.4 |
| 5 | 0 |
As a car accelerates, it does not accelerate at a constant rate; rather, the acceleration is variable. For the next three exercises use the following table, which contains the acceleration measured at every second as a driver merges onto a freeway.
[T] Using your velocity equation from the previous exercise, find the corresponding distance equation, assuming your initial distance is 0 mi. How far did you travel while you accelerated your car? (Hint: You will need to convert time units.)
| Time (sec) | Acceleration (mph/sec) |
|---|---|
| 1 | 11.2 |
| 2 | 10.6 |
| 3 | 8.1 |
| 4 | 5.4 |
| 5 | 0 |
Answer
1-253 §1.4 source ↗
| Time (sec) | Acceleration (mph/sec) |
|---|---|
| 1 | 11.2 |
| 2 | 10.6 |
| 3 | 8.1 |
| 4 | 5.4 |
| 5 | 0 |
As a car accelerates, it does not accelerate at a constant rate; rather, the acceleration is variable. For the following exercises, use the following table, which contains the acceleration measured at every second as a driver merges onto a freeway.
| Time (sec) | Acceleration (mph/sec) |
|---|---|
| 1 | 11.2 |
| 2 | 10.6 |
| 3 | 8.1 |
| 4 | 5.4 |
| 5 | 0 |
As a car accelerates, it does not accelerate at a constant rate; rather, the acceleration is variable. For the next three exercises use the following table, which contains the acceleration measured at every second as a driver merges onto a freeway.
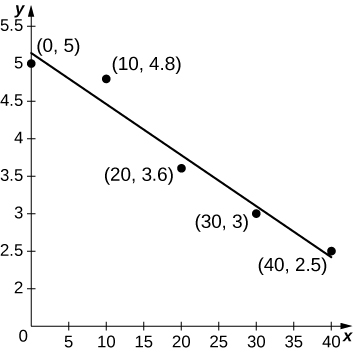
[T] An athlete runs by a motion detector, which records her speed, as displayed in the following table. The best linear fit to this data, is shown in the accompanying graph. Use the average value of between and to estimate the runner’s average speed.
| Minutes | Speed (m/sec) |
|---|---|
| 0 | 5 |
| 10 | 4.8 |
| 20 | 3.6 |
| 30 | 3.0 |
| 40 | 2.5 |
Answer
Checkpoint 1.25 §1.5 source ↗
Answer
Checkpoint 1.26 §1.5 source ↗
Answer
Checkpoint 1.27 §1.5 source ↗
Answer
Checkpoint 1.28 §1.5 source ↗
Answer
Checkpoint 1.29 §1.5 source ↗
Answer
Checkpoint 1.30 §1.5 source ↗
Answer
1-255 §1.5 source ↗
Answer
1-257 §1.5 source ↗
In the following exercises, verify each identity using differentiation. Then, using the indicated u-substitution, identify f such that the integral takes the form
For
Answer
1-259 §1.5 source ↗
In the following exercises, verify each identity using differentiation. Then, using the indicated u-substitution, identify f such that the integral takes the form
Answer
1-261 §1.5 source ↗
In the following exercises, find the antiderivative using the indicated substitution.
Answer
1-263 §1.5 source ↗
In the following exercises, find the antiderivative using the indicated substitution.
Answer
1-265 §1.5 source ↗
In the following exercises, find the antiderivative using the indicated substitution.
Answer
1-267 §1.5 source ↗
In the following exercises, find the antiderivative using the indicated substitution.
Answer
1-269 §1.5 source ↗
In the following exercises, find the antiderivative using the indicated substitution.
Answer
1-271 §1.5 source ↗
In the following exercises, use a suitable change of variables to determine the indefinite integral.
Answer
1-273 §1.5 source ↗
In the following exercises, use a suitable change of variables to determine the indefinite integral.
Answer
1-275 §1.5 source ↗
In the following exercises, use a suitable change of variables to determine the indefinite integral.
Answer
1-277 §1.5 source ↗
In the following exercises, use a suitable change of variables to determine the indefinite integral.
Answer
1-279 §1.5 source ↗
In the following exercises, use a suitable change of variables to determine the indefinite integral.
Answer
1-281 §1.5 source ↗
In the following exercises, use a suitable change of variables to determine the indefinite integral.
Answer
1-283 §1.5 source ↗
In the following exercises, use a suitable change of variables to determine the indefinite integral.
Answer
1-285 §1.5 source ↗
In the following exercises, use a suitable change of variables to determine the indefinite integral.
Answer
1-287 §1.5 source ↗
In the following exercises, use a suitable change of variables to determine the indefinite integral.
Answer
1-289 §1.5 source ↗
In the following exercises, use a calculator to estimate the area under the curve using left Riemann sums with 50 terms, then use substitution to solve for the exact answer.
[T] over
Answer
1-291 §1.5 source ↗
In the following exercises, use a calculator to estimate the area under the curve using left Riemann sums with 50 terms, then use substitution to solve for the exact answer.
[T] over
Answer
1-293 §1.5 source ↗
In the following exercises, use a change of variables to evaluate the definite integral.
Answer
1-295 §1.5 source ↗
In the following exercises, use a change of variables to evaluate the definite integral.
Answer
1-297 §1.5 source ↗
In the following exercises, use a change of variables to evaluate the definite integral.
Answer
1-299 §1.5 source ↗
In the following exercises, evaluate the indefinite integral with constant using u-substitution. Then, graph the function and the antiderivative over the indicated interval. If possible, estimate a value of C that would need to be added to the antiderivative to make it equal to the definite integral with a the left endpoint of the given interval.
[T] on
Answer
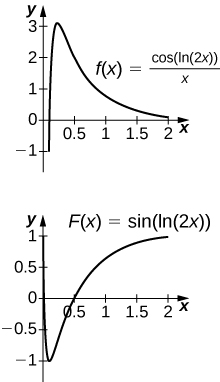
The antiderivative is Since the antiderivative is not continuous at one cannot find a value of C that would make work as a definite integral.
1-301 §1.5 source ↗
In the following exercises, evaluate the indefinite integral with constant using u-substitution. Then, graph the function and the antiderivative over the indicated interval. If possible, estimate a value of C that would need to be added to the antiderivative to make it equal to the definite integral with a the left endpoint of the given interval.
[T] over
Answer
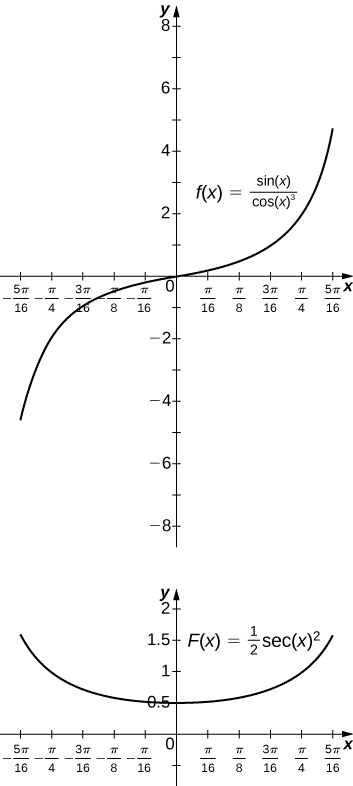
The antiderivative is You should take so that
1-303 §1.5 source ↗
In the following exercises, evaluate the indefinite integral with constant using u-substitution. Then, graph the function and the antiderivative over the indicated interval. If possible, estimate a value of C that would need to be added to the antiderivative to make it equal to the definite integral with a the left endpoint of the given interval.
[T] over
Answer
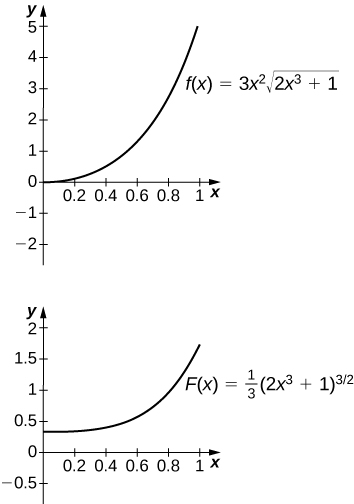
The antiderivative is One should take
1-305 §1.5 source ↗
In the following exercises, evaluate the indefinite integral with constant using u-substitution. Then, graph the function and the antiderivative over the indicated interval. If possible, estimate a value of C that would need to be added to the antiderivative to make it equal to the definite integral with a the left endpoint of the given interval.
Is the substitution in the definite integral okay? If not, why not?
Answer
1-307 §1.5 source ↗
In the following exercises, use a change of variables to show that each definite integral is equal to zero.
Answer
1-309 §1.5 source ↗
In the following exercises, use a change of variables to show that each definite integral is equal to zero.
Answer
1-311 §1.5 source ↗
In the following exercises, use a change of variables to show that each definite integral is equal to zero.
Answer
since the integrand is odd.
1-313 §1.5 source ↗
In the following exercises, use a change of variables to show that each definite integral is equal to zero.
Show that the average value of over an interval is the same as the average value of over the interval for
Answer
1-315 §1.5 source ↗
In the following exercises, use a change of variables to show that each definite integral is equal to zero.
Find the area under the graph of between and where and is fixed. Evaluate the limit as
Answer
1-317 §1.5 source ↗
In the following exercises, use a change of variables to show that each definite integral is equal to zero.
The area of the top half of an ellipse with a major axis that is the x-axis from to and with a minor axis that is the y-axis from to can be written as Use the substitution to express this area in terms of an integral of a trigonometric function. You do not need to compute the integral.
Answer
1-319 §1.5 source ↗
In the following exercises, use a change of variables to show that each definite integral is equal to zero.
[T] The following graph is of a function of the form Estimate the coefficients a and b and the frequency parameters n and m. Use these estimates to approximate
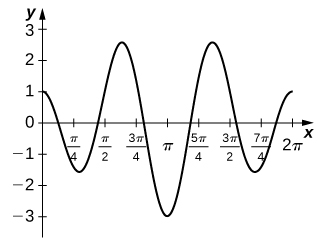
Answer
Checkpoint 1.31 §1.6 source ↗
Answer
Checkpoint 1.32 §1.6 source ↗
Answer
Checkpoint 1.33 §1.6 source ↗
Answer
Checkpoint 1.34 §1.6 source ↗
Answer
Checkpoint 1.35 §1.6 source ↗
Answer
Checkpoint 1.36 §1.6 source ↗
Answer
Checkpoint 1.37 §1.6 source ↗
Answer
Checkpoint 1.38 §1.6 source ↗
Answer
Checkpoint 1.39 §1.6 source ↗
Answer
1-321 §1.6 source ↗
In the following exercises, compute each indefinite integral.
Answer
1-323 §1.6 source ↗
In the following exercises, compute each indefinite integral.
Answer
1-325 §1.6 source ↗
In the following exercises, compute each indefinite integral.
Answer
1-327 §1.6 source ↗
In the following exercises, compute each indefinite integral.
Answer
1-329 §1.6 source ↗
In the following exercises, find each indefinite integral by using appropriate substitutions.
Answer
1-331 §1.6 source ↗
In the following exercises, find each indefinite integral by using appropriate substitutions.
Answer
1-333 §1.6 source ↗
In the following exercises, find each indefinite integral by using appropriate substitutions.
Answer
1-335 §1.6 source ↗
In the following exercises, find each indefinite integral by using appropriate substitutions.
Answer
1-337 §1.6 source ↗
In the following exercises, find each indefinite integral by using appropriate substitutions.
Answer
1-339 §1.6 source ↗
In the following exercises, find each indefinite integral by using appropriate substitutions.
Answer
1-341 §1.6 source ↗
In the following exercises, find each indefinite integral by using appropriate substitutions.
Answer
1-343 §1.6 source ↗
In the following exercises, verify by differentiation that then use appropriate changes of variables to compute the integral.
Answer
1-345 §1.6 source ↗
In the following exercises, verify by differentiation that then use appropriate changes of variables to compute the integral.
Answer
1-347 §1.6 source ↗
In the following exercises, verify by differentiation that then use appropriate changes of variables to compute the integral.
Write an integral to express the area under the graph of between and and evaluate the integral.
Answer
1-349 §1.6 source ↗
In the following exercises, use appropriate substitutions to express the trigonometric integrals in terms of compositions with logarithms.
Answer
1-351 §1.6 source ↗
In the following exercises, use appropriate substitutions to express the trigonometric integrals in terms of compositions with logarithms.
Answer
1-353 §1.6 source ↗
In the following exercises, use appropriate substitutions to express the trigonometric integrals in terms of compositions with logarithms.
Answer
1-355 §1.6 source ↗
In the following exercises, evaluate the definite integral.
Answer
1-357 §1.6 source ↗
In the following exercises, evaluate the definite integral.
Answer
1-359 §1.6 source ↗
In the following exercises, evaluate the definite integral.
Answer
1-361 §1.6 source ↗
In the following exercises, integrate using the indicated substitution.
Answer
1-363 §1.6 source ↗
In the following exercises, integrate using the indicated substitution.
Answer
1-365 §1.6 source ↗
In the following exercises, integrate using the indicated substitution.
Answer
1-367 §1.6 source ↗
In the following exercises, does the right-endpoint approximation overestimate or underestimate the exact area? Calculate the right endpoint estimate R50 and solve for the exact area.
[T] over
Answer
1-369 §1.6 source ↗
In the following exercises, does the right-endpoint approximation overestimate or underestimate the exact area? Calculate the right endpoint estimate R50 and solve for the exact area.
[T] over
Answer
1-371 §1.6 source ↗
In the following exercises, does the right-endpoint approximation overestimate or underestimate the exact area? Calculate the right endpoint estimate R50 and solve for the exact area.
[T] over
Answer
1-373 §1.6 source ↗
In the following exercises, for Find the area under the graph of between the given values a and b by integrating.
Answer
1-375 §1.6 source ↗
In the following exercises, for Find the area under the graph of between the given values a and b by integrating.
Answer
1-377 §1.6 source ↗
In the following exercises, for Find the area under the graph of between the given values a and b by integrating.
Compute the integral of and find the smallest value of N such that the area under the graph between and is, at most, 0.01.
Answer
1-379 §1.6 source ↗
In the following exercises, for Find the area under the graph of between the given values a and b by integrating.
Show that when
Answer
1-381 §1.6 source ↗
In the following exercises, for Find the area under the graph of between the given values a and b by integrating.
Use the previous exercise to find the antiderivative of and evaluate
Answer
1-383 §1.6 source ↗
The following exercises are intended to derive the fundamental properties of the natural log starting from the definition using properties of the definite integral and making no further assumptions.
Use the identity to derive the identity
Answer
1-385 §1.6 source ↗
The following exercises are intended to derive the fundamental properties of the natural log starting from the definition using properties of the definite integral and making no further assumptions.
Use the identity to show that is an increasing function of x on and use the previous exercises to show that the range of is Without any further assumptions, conclude that has an inverse function defined on
Answer
1-387 §1.6 source ↗
The following exercises are intended to derive the fundamental properties of the natural log starting from the definition using properties of the definite integral and making no further assumptions.
Pretend, for the moment, that we do not know that is the inverse function of but keep in mind that has an inverse function defined on Call it E. Show that
Answer
1-389 §1.6 source ↗
The following exercises are intended to derive the fundamental properties of the natural log starting from the definition using properties of the definite integral and making no further assumptions.
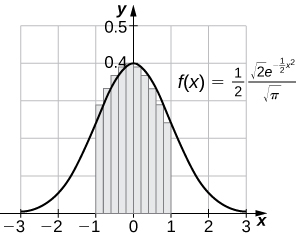
[T] The normal distribution in probability is given by where σ is the standard deviation and μ is the average. The standard normal distribution in probability, corresponds to Compute the right endpoint estimates of
Answer
Checkpoint 1.40 §1.7 source ↗
Answer
Checkpoint 1.41 §1.7 source ↗
Answer
Checkpoint 1.42 §1.7 source ↗
Answer
Checkpoint 1.43 §1.7 source ↗
Answer
Checkpoint 1.44 §1.7 source ↗
Answer
1-391 §1.7 source ↗
In the following exercises, evaluate each integral in terms of an inverse trigonometric function.
Answer
1-393 §1.7 source ↗
In the following exercises, evaluate each integral in terms of an inverse trigonometric function.
Answer
1-395 §1.7 source ↗
In the following exercises, evaluate each integral in terms of an inverse trigonometric function.
Answer
1-397 §1.7 source ↗
In the following exercises, find each indefinite integral, using appropriate substitutions.
Answer
1-399 §1.7 source ↗
In the following exercises, find each indefinite integral, using appropriate substitutions.
Answer
1-401 §1.7 source ↗
In the following exercises, find each indefinite integral, using appropriate substitutions.
Answer
1-403 §1.7 source ↗
In the following exercises, find each indefinite integral, using appropriate substitutions.
Explain the relationship Is it true, in general, that
Answer
1-405 §1.7 source ↗
In the following exercises, find each indefinite integral, using appropriate substitutions.
Explain what is wrong with the following integral:
Answer
1-407 §1.7 source ↗
In the following exercises, solve for the antiderivative of f with then use a calculator to graph f and the antiderivative over the given interval Identify a value of C such that adding C to the antiderivative recovers the definite integral
[T] over
Answer
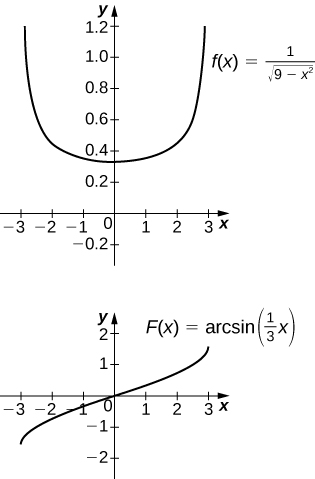
The antiderivative is Taking recovers the definite integral.
1-409 §1.7 source ↗
In the following exercises, solve for the antiderivative of f with then use a calculator to graph f and the antiderivative over the given interval Identify a value of C such that adding C to the antiderivative recovers the definite integral
[T] over
Answer
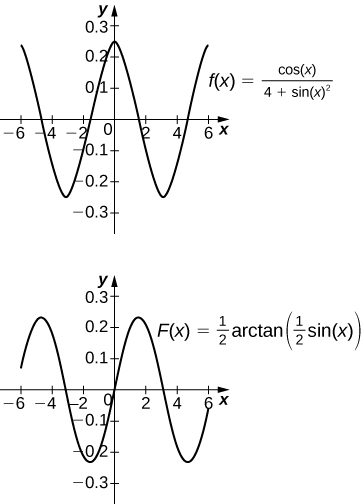
The antiderivative is Taking recovers the definite integral.
1-411 §1.7 source ↗
In the following exercises, compute the antiderivative using appropriate substitutions.
Answer
1-413 §1.7 source ↗
In the following exercises, compute the antiderivative using appropriate substitutions.
Answer
1-415 §1.7 source ↗
In the following exercises, compute the antiderivative using appropriate substitutions.
Answer
1-417 §1.7 source ↗
In the following exercises, use a calculator to graph the antiderivative with over the given interval Approximate a value of C, if possible, such that adding C to the antiderivative gives the same value as the definite integral
[T] over
Answer
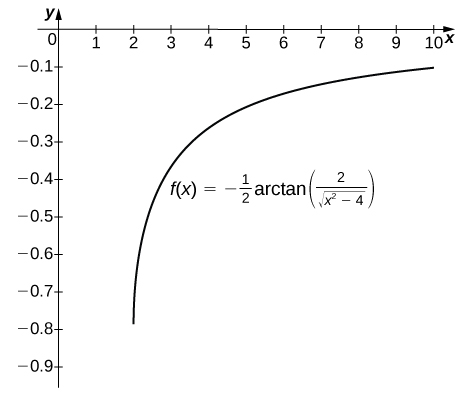
The antiderivative is Taking recovers the definite integral over
1-419 §1.7 source ↗
In the following exercises, use a calculator to graph the antiderivative with over the given interval Approximate a value of C, if possible, such that adding C to the antiderivative gives the same value as the definite integral
[T] over
Answer
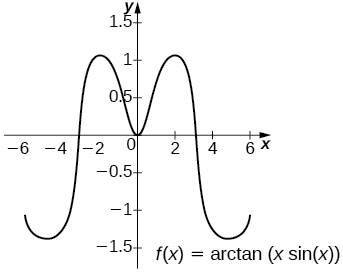
The general antiderivative is Taking recovers the definite integral.
1-421 §1.7 source ↗
In the following exercises, use a calculator to graph the antiderivative with over the given interval Approximate a value of C, if possible, such that adding C to the antiderivative gives the same value as the definite integral
[T] over
Answer
![A graph of the function f(x) = arctan(ln(x)) over (0, 2]. It is an increasing curve with x-intercept at (1,0).](/media/a035763068bba54a7d4d087236437818f423d5214d840b8ffa43f53789ff0c88)
The general antiderivative is Taking recovers the definite integral.
1-423 §1.7 source ↗
In the following exercises, compute each integral using appropriate substitutions.
Answer
1-425 §1.7 source ↗
In the following exercises, compute each integral using appropriate substitutions.
Answer
1-427 §1.7 source ↗
In the following exercises, compute each integral using appropriate substitutions.
Answer
1-429 §1.7 source ↗
In the following exercises, compute each definite integral.
Answer
1-431 §1.7 source ↗
In the following exercises, compute each definite integral.
Answer
1-433 §1.7 source ↗
In the following exercises, compute each definite integral.
For compute and evaluate the area under the graph of on
Answer
1-435 §1.7 source ↗
In the following exercises, compute each definite integral.
Use the substitution and the identity to evaluate (Hint: Multiply the top and bottom of the integrand by
Answer
1-437 §1.7 source ↗
In the following exercises, compute each definite integral.
[T] Approximate the points at which the graphs of and intersect to four decimal places, and approximate the area between their graphs to three decimal places.
Answer
1-439 §1.R source ↗
True or False. Justify your answer with a proof or a counterexample. Assume all functions and are continuous over their domains.
If for all then the right-hand rule underestimates the integral Use a graph to justify your answer.
Answer
1-441 §1.R source ↗
True or False. Justify your answer with a proof or a counterexample. Assume all functions and are continuous over their domains.
If for all then
Answer
1-443 §1.R source ↗
Evaluate the Riemann sums for the following functions over the specified interval. Compare your answer with the exact answer, when possible, or use a calculator to determine the answer.
over
Answer
1-445 §1.R source ↗
Evaluate the Riemann sums for the following functions over the specified interval. Compare your answer with the exact answer, when possible, or use a calculator to determine the answer.
over
Answer
1-447 §1.R source ↗
Evaluate the following integrals.
Answer
1-449 §1.R source ↗
Evaluate the following integrals.
Answer
1-451 §1.R source ↗
Find the antiderivative.
Answer
1-453 §1.R source ↗
Find the antiderivative.
Answer
1-455 §1.R source ↗
Find the derivative.
Answer
1-457 §1.R source ↗
Find the derivative.
Answer
1-459 §1.R source ↗
The following problems consider the historic average cost per gigabyte of RAM on a computer.
| Year | 5-Year Change ($) |
|---|---|
| 1980 | 0 |
| 1985 | −5,468,750 |
| 1990 | −755,495 |
| 1995 | −73,005 |
| 2000 | −29,768 |
| 2005 | −918 |
| 2010 | −177 |
If the average cost per gigabyte of RAM in 2010 is $12, find the average cost per gigabyte of RAM in 1980.
Answer
1-461 §1.R source ↗
The following problems consider the historic average cost per gigabyte of RAM on a computer.
| Year | 5-Year Change ($) |
|---|---|
| 1980 | 0 |
| 1985 | −5,468,750 |
| 1990 | −755,495 |
| 1995 | −73,005 |
| 2000 | −29,768 |
| 2005 | −918 |
| 2010 | −177 |
Find the average cost of 1GB RAM for 2005 to 2010.
Answer
1-463 §1.R source ↗
The following problems consider the historic average cost per gigabyte of RAM on a computer.
| Year | 5-Year Change ($) |
|---|---|
| 1980 | 0 |
| 1985 | −5,468,750 |
| 1990 | −755,495 |
| 1995 | −73,005 |
| 2000 | −29,768 |
| 2005 | −918 |
| 2010 | −177 |
What is the average velocity of the bullet for the first half-second?
Answer
Loading chapter 2…
Problems and answers are adapted from Calculus Volume 2 by Gilbert Strang and Edwin “Jed” Herman, OpenStax, and are used under the CC BY-NC-SA 4.0 licence. Access for free at https://openstax.org/books/calculus-volume-2/pages/1-introduction. Illustrations: Copyright Rice University, OpenStax, under CC BY-NC-SA 4.0 license. This adaptation is released under the same licence, is non-commercial, and is neither affiliated with nor endorsed by OpenStax or Rice University.