Every problem in the chapter beside the book’s answer, a chapter at a time as you scroll.
Chapter 2: Applications of Integration
272 problems · 70 figuresCheckpoint 2.1 §2.1 source ↗
Answer
Checkpoint 2.2 §2.1 source ↗
Answer
Checkpoint 2.3 §2.1 source ↗
Answer
Checkpoint 2.4 §2.1 source ↗
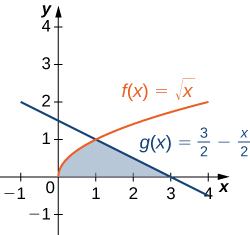
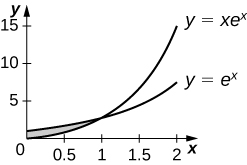
Consider the region depicted in the following figure. Find the area of
Answer
Checkpoint 2.5 §2.1 source ↗
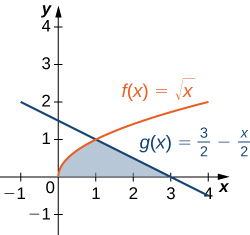
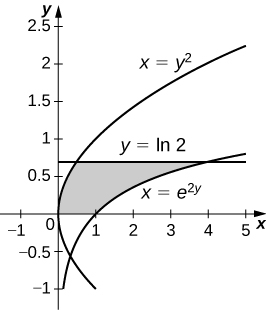
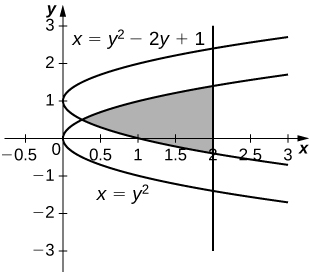
Let’s revisit the checkpoint associated with Example 2.4, only this time, let’s integrate with respect to Let be the region depicted in the following figure. Find the area of by integrating with respect to
Answer
2-1 §2.1 source ↗
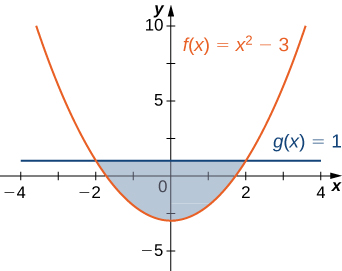
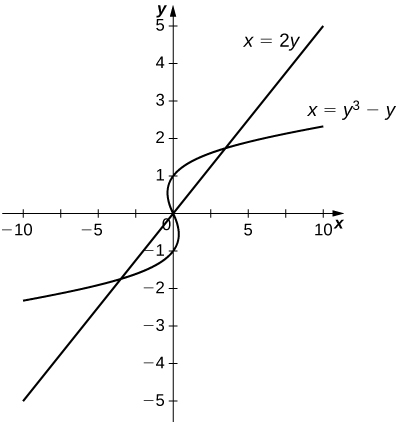
For the following exercises, determine the area of the region between the two curves in the given figure by integrating over the
Answer
2-3 §2.1 source ↗
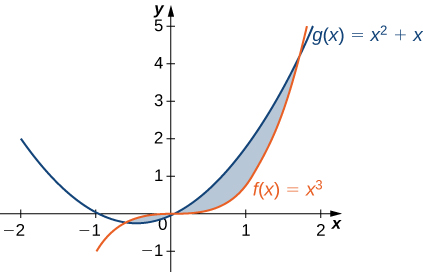
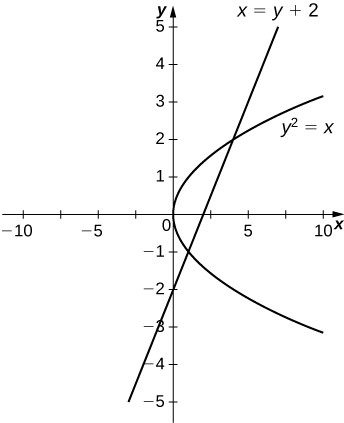
For the following exercises, split the region between the two curves into two smaller regions, then determine the area by integrating over the Note that you will have two integrals to solve.
and
Answer
2-5 §2.1 source ↗
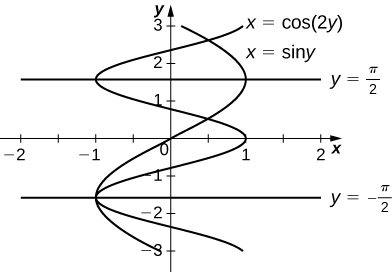
For the following exercises, determine the area of the region between the two curves by integrating over the
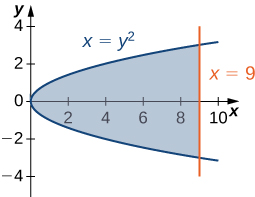
Answer
2-7 §2.1 source ↗
For the following exercises, graph the equations and shade the area of the region between the curves. Determine its area by integrating over the
Answer
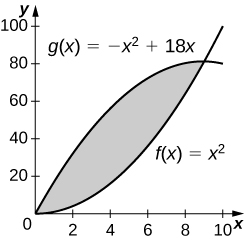
243 square units
2-9 §2.1 source ↗
For the following exercises, graph the equations and shade the area of the region between the curves. Determine its area by integrating over the
and on
Answer
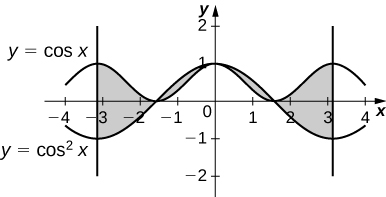
4
2-11 §2.1 source ↗
For the following exercises, graph the equations and shade the area of the region between the curves. Determine its area by integrating over the
Answer
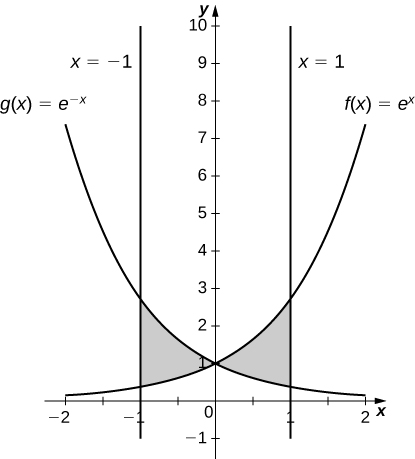
2-13 §2.1 source ↗
For the following exercises, graph the equations and shade the area of the region between the curves. Determine its area by integrating over the
Answer
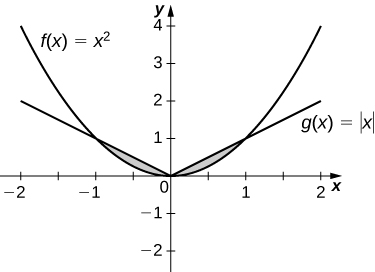
2-15 §2.1 source ↗
For the following exercises, graph the equations and shade the area of the region between the curves. If necessary, break the region into sub-regions to determine its entire area.
Answer
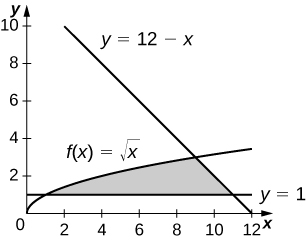
2-17 §2.1 source ↗
For the following exercises, graph the equations and shade the area of the region between the curves. If necessary, break the region into sub-regions to determine its entire area.
over
Answer
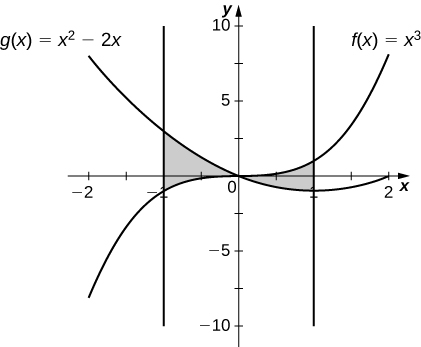
2-19 §2.1 source ↗
For the following exercises, graph the equations and shade the area of the region between the curves. If necessary, break the region into sub-regions to determine its entire area.
and
Answer
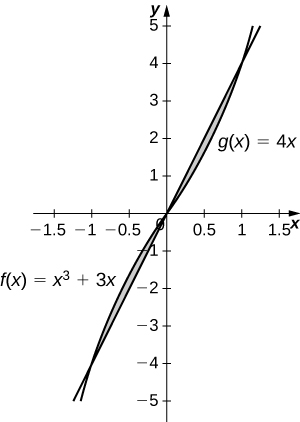
2-21 §2.1 source ↗
For the following exercises, graph the equations and shade the area of the region between the curves. Determine its area by integrating over the
Answer
2-23 §2.1 source ↗
For the following exercises, graph the equations and shade the area of the region between the curves. Determine its area by integrating over the
Answer
2-25 §2.1 source ↗
For the following exercises, graph the equations and shade the area of the region between the curves. Determine its area by integrating over the
Answer
2-27 §2.1 source ↗
For the following exercises, graph the equations and shade the area of the region between the curves. Determine its area by integrating over the x-axis or y-axis, whichever seems more convenient.
Answer
2-29 §2.1 source ↗
For the following exercises, graph the equations and shade the area of the region between the curves. Determine its area by integrating over the x-axis or y-axis, whichever seems more convenient.
Answer
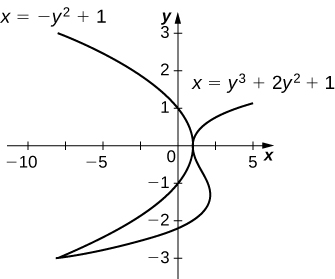
2-31 §2.1 source ↗
For the following exercises, graph the equations and shade the area of the region between the curves. Determine its area by integrating over the x-axis or y-axis, whichever seems more convenient.
Answer
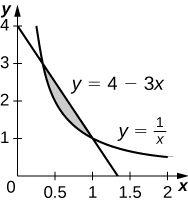
2-33 §2.1 source ↗
For the following exercises, graph the equations and shade the area of the region between the curves. Determine its area by integrating over the x-axis or y-axis, whichever seems more convenient.
Answer
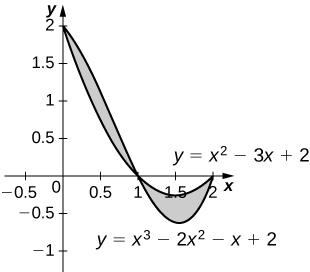
2-35 §2.1 source ↗
For the following exercises, graph the equations and shade the area of the region between the curves. Determine its area by integrating over the x-axis or y-axis, whichever seems more convenient.
Answer
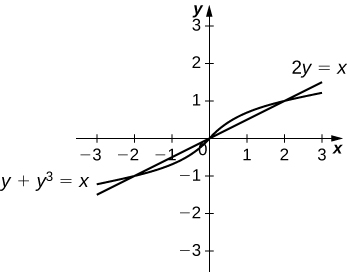
2-37 §2.1 source ↗
For the following exercises, graph the equations and shade the area of the region between the curves. Determine its area by integrating over the x-axis or y-axis, whichever seems more convenient.
Answer
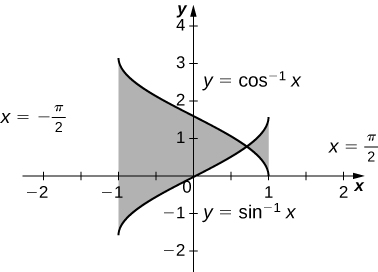
2-39 §2.1 source ↗
For the following exercises, find the exact area of the region bounded by the given equations if possible. If you are unable to determine the intersection points analytically, use a calculator to approximate the intersection points with three decimal places and determine the approximate area of the region.
[T]
Answer
2-41 §2.1 source ↗
For the following exercises, find the exact area of the region bounded by the given equations if possible. If you are unable to determine the intersection points analytically, use a calculator to approximate the intersection points with three decimal places and determine the approximate area of the region.
[T]
Answer
2-43 §2.1 source ↗
For the following exercises, find the exact area of the region bounded by the given equations if possible. If you are unable to determine the intersection points analytically, use a calculator to approximate the intersection points with three decimal places and determine the approximate area of the region.
[T]
Answer
2-45 §2.1 source ↗
For the following exercises, find the exact area of the region bounded by the given equations if possible. If you are unable to determine the intersection points analytically, use a calculator to approximate the intersection points with three decimal places and determine the approximate area of the region.
[T]
Answer
2-47 §2.1 source ↗
For the following exercises, find the exact area of the region bounded by the given equations if possible. If you are unable to determine the intersection points analytically, use a calculator to approximate the intersection points with three decimal places and determine the approximate area of the region.
[T]
Answer
2-49 §2.1 source ↗
For the following exercises, find the exact area of the region bounded by the given equations if possible. If you are unable to determine the intersection points analytically, use a calculator to approximate the intersection points with three decimal places and determine the approximate area of the region.
A factory selling cell phones has a marginal cost function where represents the number of cell phones, is the marginal cost, in dollars, of selling phones, and a marginal revenue function given by , where is the revenue, in dollars, earned by selling cell phonesFind the area between the graphs of these curves and What does this area represent?
Answer
2-51 §2.1 source ↗
For the following exercises, find the exact area of the region bounded by the given equations if possible. If you are unable to determine the intersection points analytically, use a calculator to approximate the intersection points with three decimal places and determine the approximate area of the region.
The tortoise versus the hare: The speed of the hare is given by the sinusoidal function whereas the speed of the tortoise is where is time measured in hours and the speed is measured in miles per hour. Find the area between the curves from time to the first time after one hour when the tortoise and hare are traveling at the same speed. What does it represent? Use a calculator to determine the intersection points, if necessary, accurate to three decimal places.
Answer
2-53 §2.1 source ↗
For the following exercises, find the area between the curves by integrating with respect to and then with respect to Is one method easier than the other? Do you obtain the same answer?
Answer
2-55 §2.1 source ↗
For the following exercises, find the area between the curves by integrating with respect to and then with respect to Is one method easier than the other? Do you obtain the same answer?
Answer
2-57 §2.1 source ↗
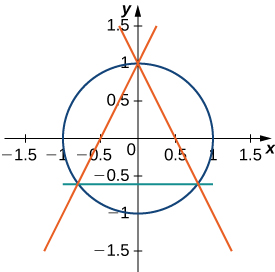
For the following exercises, solve using calculus, then check your answer with geometry.
Find the area between the perimeter of the unit circle and the triangle created from and as seen in the following figure. Is there a way to solve this without using calculus?
Answer
Checkpoint 2.7 §2.2 source ↗
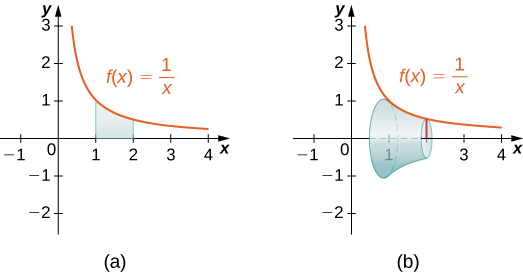
Use the method of slicing to find the volume of the solid of revolution formed by revolving the region between the graph of the function and the over the interval around the See the following figure.
Answer
Checkpoint 2.8 §2.2 source ↗
Answer
Checkpoint 2.9 §2.2 source ↗
Answer
Checkpoint 2.10 §2.2 source ↗
Answer
Checkpoint 2.11 §2.2 source ↗
Answer
2-63 §2.2 source ↗
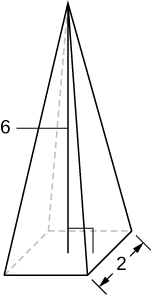
For the following exercises, draw a typical slice and find the volume using the slicing method for the given volume.
A pyramid with height 6 units and square base of side 2 units, as pictured here.
Answer
2-65 §2.2 source ↗
For the following exercises, draw a typical slice and find the volume using the slicing method for the given volume.
A tetrahedron with a base side of 4 units, as seen here.
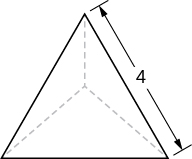
Answer
2-67 §2.2 source ↗
For the following exercises, draw a typical slice and find the volume using the slicing method for the given volume.
A cone of radius and height has a smaller cone of radius and height removed from the top, as seen here. The resulting solid is called a frustum.
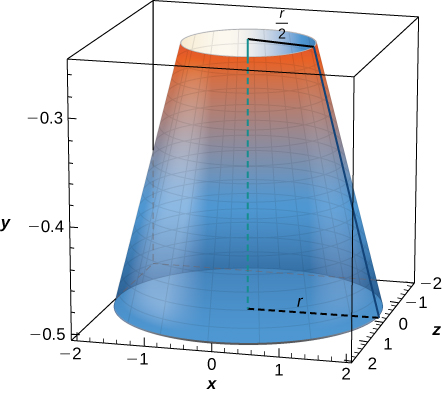
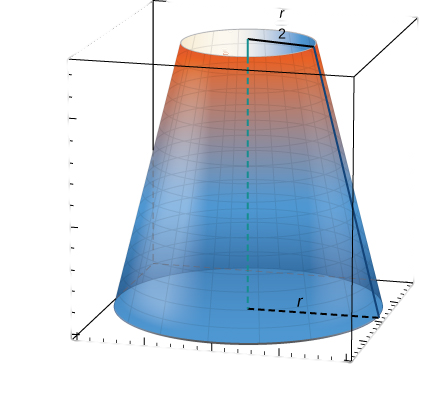
Answer
2-69 §2.2 source ↗
For the following exercises, draw an outline of the solid and find the volume using the slicing method.
The base is a triangle with vertices and Slices perpendicular to the x-axis are semicircles.
Answer
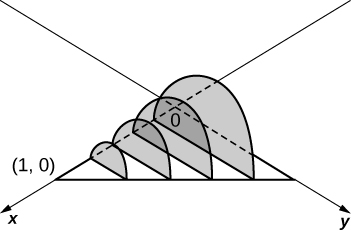
units3
2-71 §2.2 source ↗
For the following exercises, draw an outline of the solid and find the volume using the slicing method.
The base is the region under the parabola and above the Slices perpendicular to the are squares.
Answer
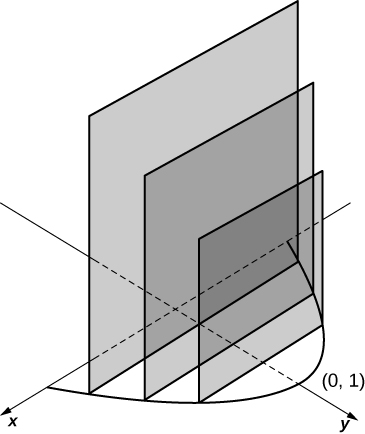
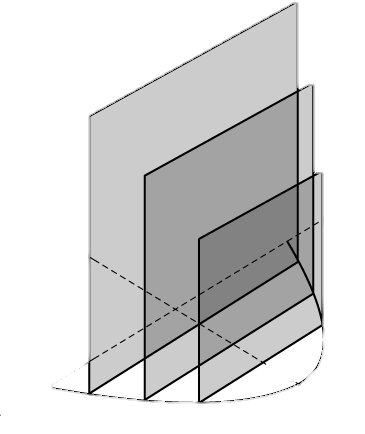
units3
2-73 §2.2 source ↗
For the following exercises, draw an outline of the solid and find the volume using the slicing method.
The base is the area between and Slices perpendicular to the x-axis are semicircles.
Answer
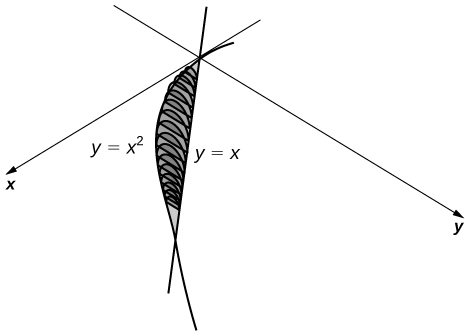
units3
2-75 §2.2 source ↗
For the following exercises, draw the region bounded by the curves. Then, use the disk method to find the volume when the region is rotated around the x-axis.
Answer
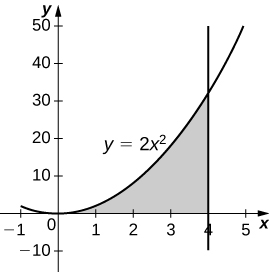
units3
2-77 §2.2 source ↗
For the following exercises, draw the region bounded by the curves. Then, use the disk method to find the volume when the region is rotated around the x-axis.
Answer
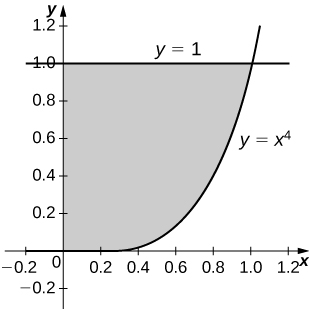
units3
2-79 §2.2 source ↗
For the following exercises, draw the region bounded by the curves. Then, use the disk method to find the volume when the region is rotated around the x-axis.
Answer
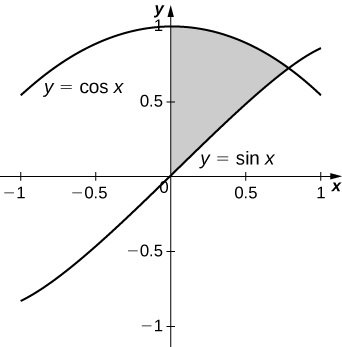
units3
2-81 §2.2 source ↗
For the following exercises, draw the region bounded by the curves. Then, use the disk method to find the volume when the region is rotated around the x-axis.
Answer
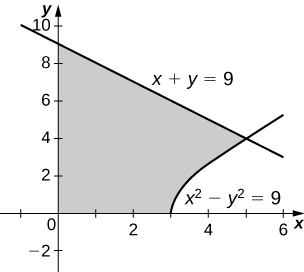
units3
2-83 §2.2 source ↗
For the following exercises, draw the region bounded by the curves. Then, find the volume when the region is rotated around the y-axis.
Answer
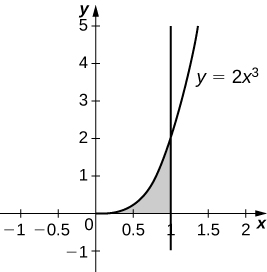
units3
2-85 §2.2 source ↗
For the following exercises, draw the region bounded by the curves. Then, find the volume when the region is rotated around the y-axis.
Answer
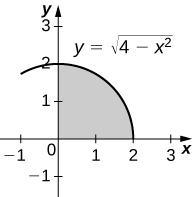
units3
2-87 §2.2 source ↗
For the following exercises, draw the region bounded by the curves. Then, find the volume when the region is rotated around the y-axis.
Answer
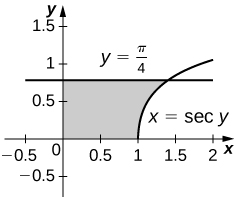
units3
2-89 §2.2 source ↗
For the following exercises, draw the region bounded by the curves. Then, find the volume when the region is rotated around the y-axis.
Answer
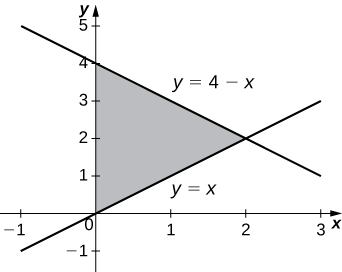
units3
2-91 §2.2 source ↗
For the following exercises, draw the region bounded by the curves. Then, find the volume when the region is rotated around the x-axis.
Answer
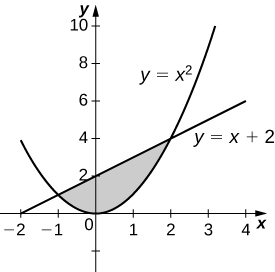
units3
2-93 §2.2 source ↗
For the following exercises, draw the region bounded by the curves. Then, find the volume when the region is rotated around the x-axis.
Answer
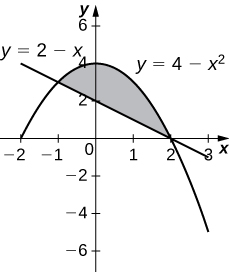
units3
2-95 §2.2 source ↗
For the following exercises, draw the region bounded by the curves. Then, find the volume when the region is rotated around the x-axis.
Answer
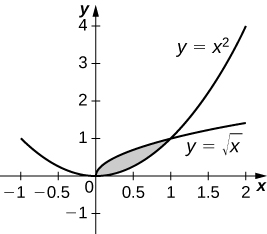
units3
2-97 §2.2 source ↗
For the following exercises, draw the region bounded by the curves. Then, find the volume when the region is rotated around the x-axis.
Answer
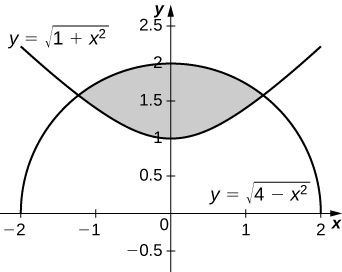
units3
2-99 §2.2 source ↗
For the following exercises, draw the region bounded by the curves. Then, use the washer method to find the volume when the region is revolved around the y-axis.
Answer
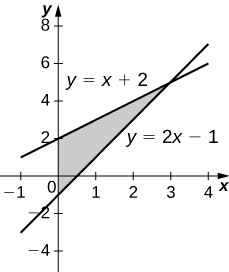
units3
2-101 §2.2 source ↗
For the following exercises, draw the region bounded by the curves. Then, use the washer method to find the volume when the region is revolved around the y-axis.
Answer
units3
2-103 §2.2 source ↗
For the following exercises, draw the region bounded by the curves. Then, use the washer method to find the volume when the region is revolved around the y-axis.
Yogurt containers can be shaped like frustums. Rotate the line around the y-axis to find the volume between
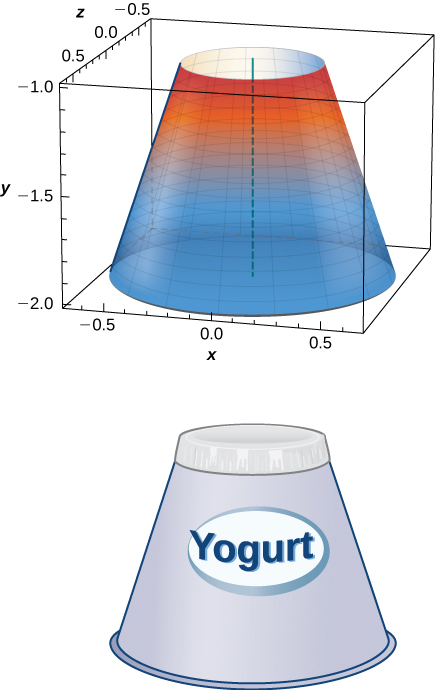
Answer
2-105 §2.2 source ↗
For the following exercises, draw the region bounded by the curves. Then, use the washer method to find the volume when the region is revolved around the y-axis.
Rotate the ellipse around the y-axis to approximate the volume of a football.
Answer
2-107 §2.2 source ↗
For the following exercises, draw the region bounded by the curves. Then, use the washer method to find the volume when the region is revolved around the y-axis.
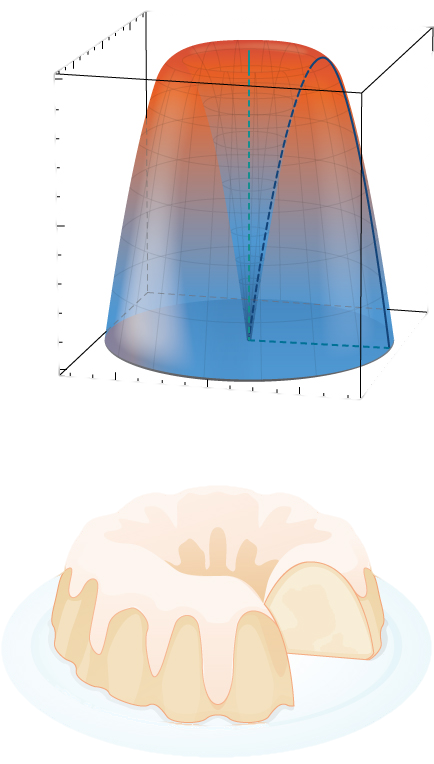
What is the volume of the Bundt cake that comes from rotating around the y-axis from to
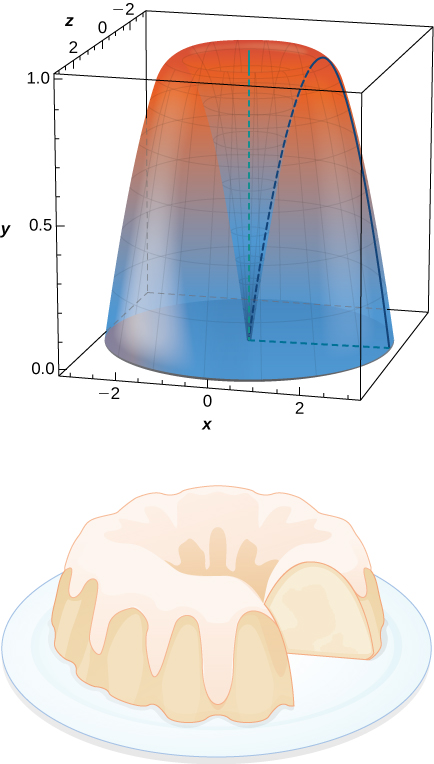
Answer
2-109 §2.2 source ↗
For the following exercises, find the volume of the solid described.
The base is the region enclosed by the generic ellipse Slices perpendicular to the x-axis are semicircles.
Answer
2-111 §2.2 source ↗
For the following exercises, find the volume of the solid described.
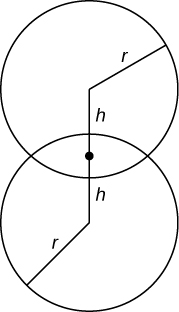
Find the volume common to two spheres of radius with centers that are apart, as shown here.
Answer
2-113 §2.2 source ↗
For the following exercises, find the volume of the solid described.
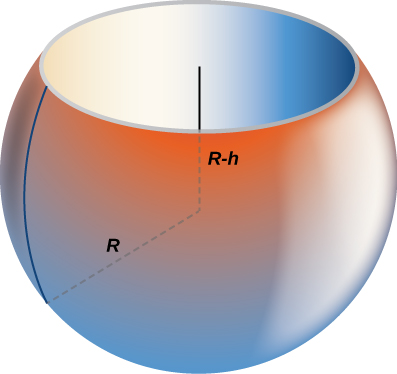
Find the volume of a sphere of radius with a cap of height removed from the top, as seen here.
Answer
Checkpoint 2.12 §2.3 source ↗
Answer
Checkpoint 2.13 §2.3 source ↗
Answer
Checkpoint 2.14 §2.3 source ↗
Answer
Checkpoint 2.15 §2.3 source ↗
Answer
Checkpoint 2.16 §2.3 source ↗
Answer
Checkpoint 2.17 §2.3 source ↗
Answer
2-115 §2.3 source ↗
For the following exercises, find the volume generated when the region between the two curves is rotated around the given axis. Use both the shell method and the washer method. Use technology to graph the functions and draw a typical slice by hand.
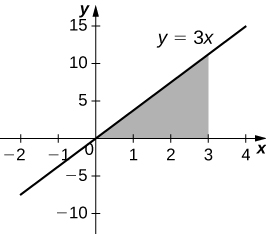
[T] Bounded by the curves rotated around the
Answer
units3
2-117 §2.3 source ↗
For the following exercises, find the volume generated when the region between the two curves is rotated around the given axis. Use both the shell method and the washer method. Use technology to graph the functions and draw a typical slice by hand.
[T] Bounded by the curves rotated around the
Answer
units3
2-119 §2.3 source ↗
For the following exercises, find the volume generated when the region between the two curves is rotated around the given axis. Use both the shell method and the washer method. Use technology to graph the functions and draw a typical slice by hand.
[T] Bounded by the curves rotated around the
Answer
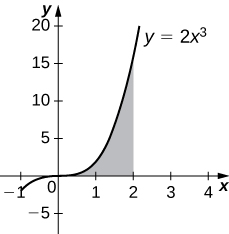
units3
2-121 §2.3 source ↗
For the following exercises, use shells to find the volumes of the given solids. Note that the rotated regions lie between the curve and the and are rotated around the
Answer
2-123 §2.3 source ↗
For the following exercises, use shells to find the volumes of the given solids. Note that the rotated regions lie between the curve and the and are rotated around the
Answer
2-125 §2.3 source ↗
For the following exercises, use shells to find the volumes of the given solids. Note that the rotated regions lie between the curve and the and are rotated around the
Answer
2-127 §2.3 source ↗
For the following exercises, use shells to find the volumes of the given solids. Note that the rotated regions lie between the curve and the and are rotated around the
Answer
2-129 §2.3 source ↗
For the following exercises, use shells to find the volumes of the given solids. Note that the rotated regions lie between the curve and the and are rotated around the
Answer
2-131 §2.3 source ↗
For the following exercises, use shells to find the volume generated by rotating the regions between the given curve and around the
and the x-axis
Answer
2-133 §2.3 source ↗
For the following exercises, use shells to find the volume generated by rotating the regions between the given curve and around the
and the x-axis
Answer
2-135 §2.3 source ↗
For the following exercises, use shells to find the volume generated by rotating the regions between the given curve and around the
and the y-axis
Answer
2-137 §2.3 source ↗
For the following exercises, use shells to find the volume generated by rotating the regions between the given curve and around the
Answer
2-139 §2.3 source ↗
For the following exercises, use shells to find the volume generated by rotating the regions between the given curve and around the
Answer
2-141 §2.3 source ↗
For the following exercises, find the volume generated when the region between the curves is rotated around the given axis.
rotated around the
Answer
2-143 §2.3 source ↗
For the following exercises, find the volume generated when the region between the curves is rotated around the given axis.
rotated around the line
Answer
2-145 §2.3 source ↗
For the following exercises, find the volume generated when the region between the curves is rotated around the given axis.
rotated around the
Answer
2-147 §2.3 source ↗
For the following exercises, find the volume generated when the region between the curves is rotated around the given axis.
rotated around the
Answer
2-149 §2.3 source ↗
For the following exercises, find the volume generated when the region between the curves is rotated around the given axis.
[T] Left of right of around the
Answer
2-151 §2.3 source ↗
For the following exercises, use technology to graph the region. Determine which method you think would be easiest to use to calculate the volume generated when the function is rotated around the specified axis. Then, use your chosen method to find the volume.
[T] rotated around the This exercise requires advanced technique. You may use technology to perform the integration.
Answer
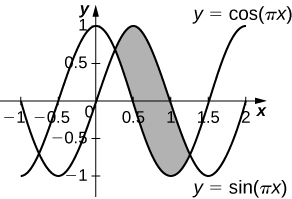
units3
2-153 §2.3 source ↗
For the following exercises, use technology to graph the region. Determine which method you think would be easiest to use to calculate the volume generated when the function is rotated around the specified axis. Then, use your chosen method to find the volume.
[T] rotated around the
Answer
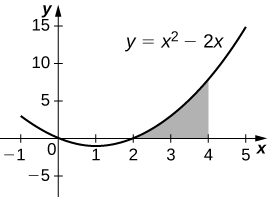
units3
2-155 §2.3 source ↗
For the following exercises, use technology to graph the region. Determine which method you think would be easiest to use to calculate the volume generated when the function is rotated around the specified axis. Then, use your chosen method to find the volume.
[T] rotated around the
Answer
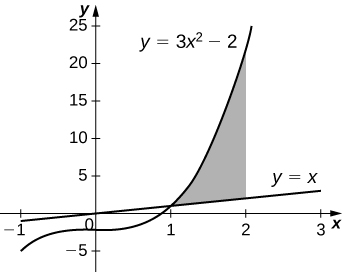
units3
2-157 §2.3 source ↗
For the following exercises, use technology to graph the region. Determine which method you think would be easiest to use to calculate the volume generated when the function is rotated around the specified axis. Then, use your chosen method to find the volume.
[T] rotated around the
Answer
units3
2-159 §2.3 source ↗
For the following exercises, use the method of shells to approximate the volumes of some common objects, which are pictured in accompanying figures.
Use the method of shells to find the volume of a cone with radius and height
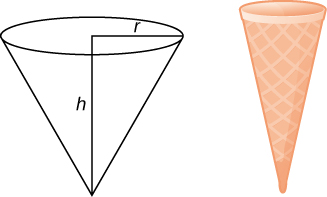
Answer
2-161 §2.3 source ↗
For the following exercises, use the method of shells to approximate the volumes of some common objects, which are pictured in accompanying figures.
Use the method of shells to find the volume of a cylinder with radius and height
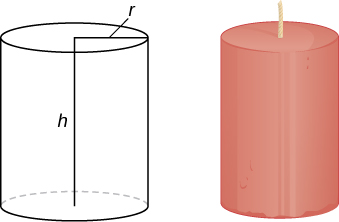
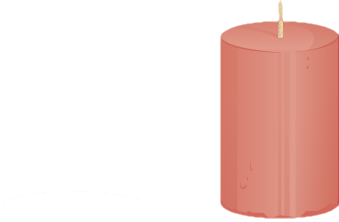
Answer
2-163 §2.3 source ↗
For the following exercises, use the method of shells to approximate the volumes of some common objects, which are pictured in accompanying figures.
Consider the region enclosed by the graphs of and What is the volume of the solid generated when this region is rotated around the Assume that the function is defined over the interval
Answer
Checkpoint 2.18 §2.4 source ↗
Answer
Checkpoint 2.19 §2.4 source ↗
Answer
Checkpoint 2.20 §2.4 source ↗
Answer
Checkpoint 2.21 §2.4 source ↗
Answer
Checkpoint 2.22 §2.4 source ↗
Answer
2-165 §2.4 source ↗
For the following exercises, find the length of the functions over the given interval.
Answer
2-167 §2.4 source ↗
For the following exercises, find the length of the functions over the given interval.
Answer
2-169 §2.4 source ↗
For the following exercises, find the length of the functions over the given interval.
Find the surface area of the volume generated when the curve revolves around the from to as seen here.
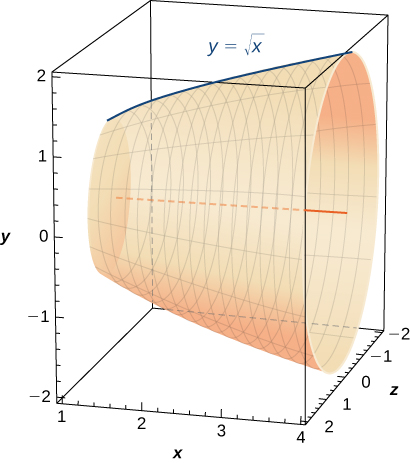
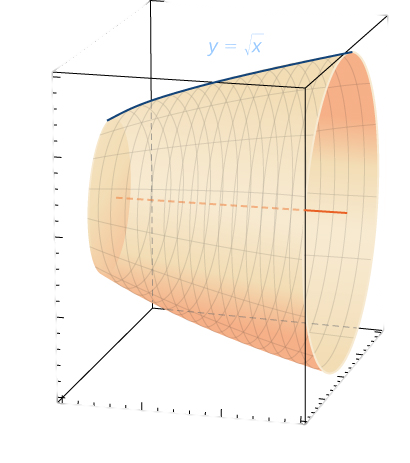
Answer
2-171 §2.4 source ↗
For the following exercises, find the lengths of the functions of over the given interval. If you cannot evaluate the integral exactly, use technology to approximate it.
from
Answer
2-173 §2.4 source ↗
For the following exercises, find the lengths of the functions of over the given interval. If you cannot evaluate the integral exactly, use technology to approximate it.
from
Answer
2-175 §2.4 source ↗
For the following exercises, find the lengths of the functions of over the given interval. If you cannot evaluate the integral exactly, use technology to approximate it.
[T] on to
Answer
2-177 §2.4 source ↗
For the following exercises, find the lengths of the functions of over the given interval. If you cannot evaluate the integral exactly, use technology to approximate it.
from
Answer
2-179 §2.4 source ↗
For the following exercises, find the lengths of the functions of over the given interval. If you cannot evaluate the integral exactly, use technology to approximate it.
from
Answer
2-181 §2.4 source ↗
For the following exercises, find the lengths of the functions of over the given interval. If you cannot evaluate the integral exactly, use technology to approximate it.
from to
Answer
2-183 §2.4 source ↗
For the following exercises, find the lengths of the functions of over the given interval. If you cannot evaluate the integral exactly, use technology to approximate it.
from to
Answer
2-185 §2.4 source ↗
For the following exercises, find the lengths of the functions of over the given interval. If you cannot evaluate the integral exactly, use technology to approximate it.
from
Answer
2-187 §2.4 source ↗
For the following exercises, find the lengths of the functions of over the given interval. If you cannot evaluate the integral exactly, use technology to approximate it.
[T] from to
Answer
2-189 §2.4 source ↗
For the following exercises, find the lengths of the functions of over the given interval. If you cannot evaluate the integral exactly, use technology to approximate it.
[T] from
Answer
2-191 §2.4 source ↗
For the following exercises, find the surface area of the volume generated when the following curves revolve around the If you cannot evaluate the integral exactly, use your calculator to approximate it.
from to
Answer
2-193 §2.4 source ↗
For the following exercises, find the surface area of the volume generated when the following curves revolve around the If you cannot evaluate the integral exactly, use your calculator to approximate it.
from
Answer
2-195 §2.4 source ↗
For the following exercises, find the surface area of the volume generated when the following curves revolve around the If you cannot evaluate the integral exactly, use your calculator to approximate it.
from
Answer
2-197 §2.4 source ↗
For the following exercises, find the surface area of the volume generated when the following curves revolve around the If you cannot evaluate the integral exactly, use your calculator to approximate it.
from
Answer
2-199 §2.4 source ↗
For the following exercises, find the surface area of the volume generated when the following curves revolve around the If you cannot evaluate the integral exactly, use your calculator to approximate it.
from
Answer
2-201 §2.4 source ↗
For the following exercises, find the surface area of the volume generated when the following curves revolve around the If you cannot evaluate the integral exactly, use your calculator to approximate it.
from
Answer
2-203 §2.4 source ↗
For the following exercises, find the surface area of the volume generated when the following curves revolve around the If you cannot evaluate the integral exactly, use your calculator to approximate it.
from
Answer
2-205 §2.4 source ↗
For the following exercises, find the surface area of the volume generated when the following curves revolve around the If you cannot evaluate the integral exactly, use your calculator to approximate it.
[T] from to
Answer
2-207 §2.4 source ↗
For the following exercises, find the surface area of the volume generated when the following curves revolve around the If you cannot evaluate the integral exactly, use your calculator to approximate it.
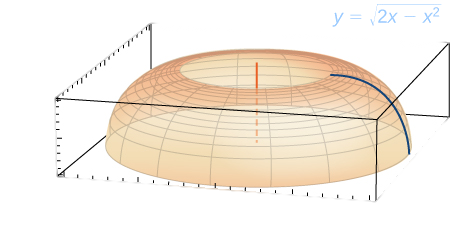
The base of a lamp is constructed by revolving a quarter circle around the from to as seen here. Create an integral for the surface area of this curve and compute it.
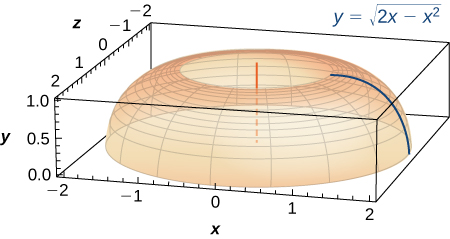
Answer
2-209 §2.4 source ↗
For the following exercises, find the surface area of the volume generated when the following curves revolve around the If you cannot evaluate the integral exactly, use your calculator to approximate it.
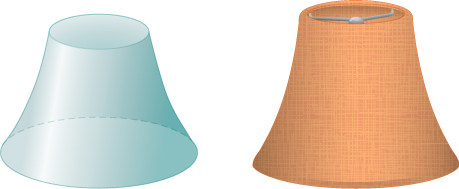
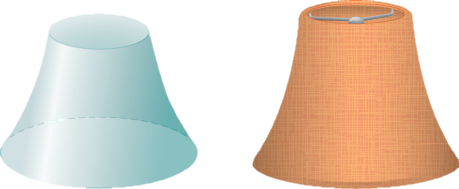
[T] A lampshade is constructed by rotating around the from to as seen here. Determine how much material you would need to construct this lampshade—that is, the surface area—accurate to four decimal places.
Answer
2-211 §2.4 source ↗
For the following exercises, find the surface area of the volume generated when the following curves revolve around the If you cannot evaluate the integral exactly, use your calculator to approximate it.
[T] You are building a bridge that will span ft. You intend to add decorative rope in the shape of where is the distance in feet from one end of the bridge. Find out how much rope you need to buy, measured in a whole number of feet.
Answer
2-213 §2.4 source ↗
For the following exercises, find the exact arc length for the following problems over the given interval.
[T] Draw graphs of and For as increases, formulate a prediction on the arc length from to Now, compute the lengths of these three functions and determine whether your prediction is correct.
Answer
2-215 §2.4 source ↗
For the following exercises, find the exact arc length for the following problems over the given interval.
Solve for the length of from Show that from to is twice as long. Graph both functions and explain why this is so.
Answer
2-217 §2.4 source ↗
For the following exercises, find the exact arc length for the following problems over the given interval.
Explain why the surface area is infinite when is rotated around the for but the volume is finite.
Answer
Checkpoint 2.23 §2.5 source ↗
Answer
Checkpoint 2.24 §2.5 source ↗
Answer
Checkpoint 2.25 §2.5 source ↗
Answer
Checkpoint 2.26 §2.5 source ↗
Answer
Checkpoint 2.27 §2.5 source ↗
Answer
Checkpoint 2.28 §2.5 source ↗
Answer
2-219 §2.5 source ↗
For the following exercises, find the work done.
How much work is done when a person lifts a lb box of comics onto a truck that is ft off the ground?
Answer
2-221 §2.5 source ↗
For the following exercises, find the work done.
Find the work done when you push a box along the floor m, when you apply a constant force of
Answer
2-223 §2.5 source ↗
For the following exercises, find the work done.
What is the work done moving a particle from to m if the force acting on it is N?
Answer
2-225 §2.5 source ↗
For the following exercises, find the mass of the one-dimensional object.
A car antenna that is ft long (starting at and has a density function of lb/ft
Answer
2-227 §2.5 source ↗
For the following exercises, find the mass of the one-dimensional object.
A pencil that is in. long (starting at and has a density function of oz/in.
Answer
2-229 §2.5 source ↗
For the following exercises, find the mass of the two-dimensional object that is centered at the origin.
An oversized hockey puck of radius in. with density function
Answer
2-231 §2.5 source ↗
For the following exercises, find the mass of the two-dimensional object that is centered at the origin.
A plate of radius in. with density function
Answer
2-233 §2.5 source ↗
For the following exercises, find the mass of the two-dimensional object that is centered at the origin.
A disk of radius cm with density function
Answer
2-235 §2.5 source ↗
For the following exercises, find the mass of the two-dimensional object that is centered at the origin.
A spring has a natural length of cm. It takes J to stretch the spring to cm. How much work would it take to stretch the spring from cm to cm?
Answer
2-237 §2.5 source ↗
For the following exercises, find the mass of the two-dimensional object that is centered at the origin.
A spring requires J to stretch the spring from cm to cm, and an additional J to stretch the spring from cm to cm. What is the natural length of the spring?
Answer
2-239 §2.5 source ↗
For the following exercises, find the mass of the two-dimensional object that is centered at the origin.
A force of N stretches a nonlinear spring by meters. What work is required to stretch the spring from to m?
Answer
2-241 §2.5 source ↗
For the following exercises, find the mass of the two-dimensional object that is centered at the origin.
For the cable in the preceding exercise, how much work is done to lift the cable ft?
Answer
2-243 §2.5 source ↗
For the following exercises, find the mass of the two-dimensional object that is centered at the origin.
[T] A pyramid of height ft has a square base ft by ft. Find the area at height If the rock used to build the pyramid weighs approximately how much work did it take to lift all the rock?
Answer
Weight
Work
2-245 §2.5 source ↗
For the following exercises, find the mass of the two-dimensional object that is centered at the origin.
[T] The force of gravity on a mass is newtons. For a rocket of mass compute the work to lift the rocket from to km. State your answers with three significant figures. (Note: and
Answer
2-247 §2.5 source ↗
For the following exercises, find the mass of the two-dimensional object that is centered at the origin.
[T] A rectangular dam is ft high and ft wide. Assume the weight density of water is 62.5 lbs/ft3. Compute the total force on the dam when
a. the surface of the water is at the top of the dam and
b. the surface of the water is halfway down the dam.
Answer
2-249 §2.5 source ↗
For the following exercises, find the mass of the two-dimensional object that is centered at the origin.
[T] Find the work required to pump all the water out of the cylinder in the preceding exercise if the cylinder is only half full.
Answer
2-251 §2.5 source ↗
For the following exercises, find the mass of the two-dimensional object that is centered at the origin.
A cylinder of depth and cross-sectional area stands full of water at density Compute the work to pump all the water to the top.
Answer
2-253 §2.5 source ↗
For the following exercises, find the mass of the two-dimensional object that is centered at the origin.
A cone-shaped tank has a cross-sectional area that increases with its depth: Show that the work to empty it is half the work for a cylinder with the same height and base.
Answer
Checkpoint 2.29 §2.6 source ↗
Suppose four point masses are placed on a number line as follows:
Find the moment of the system with respect to the origin and find the center of mass of the system.
Answer
Checkpoint 2.30 §2.6 source ↗
Suppose three point masses are placed on a number line as follows (assume coordinates are given in meters):
Find the center of mass of the system.
Answer
Checkpoint 2.31 §2.6 source ↗
Answer
Checkpoint 2.32 §2.6 source ↗
Answer
Checkpoint 2.33 §2.6 source ↗
Answer
Checkpoint 2.34 §2.6 source ↗
Answer
2-255 §2.6 source ↗
For the following exercises, calculate the center of mass for the collection of masses given.
at and at
Answer
2-257 §2.6 source ↗
For the following exercises, calculate the center of mass for the collection of masses given.
Unit masses at
Answer
2-259 §2.6 source ↗
For the following exercises, calculate the center of mass for the collection of masses given.
at and at
Answer
2-261 §2.6 source ↗
For the following exercises, compute the center of mass
for
Answer
2-263 §2.6 source ↗
For the following exercises, compute the center of mass
for
Answer
2-265 §2.6 source ↗
For the following exercises, compute the center of mass
for
Answer
2-267 §2.6 source ↗
For the following exercises, compute the center of mass
for
Answer
2-269 §2.6 source ↗
For the following exercises, compute the center of mass
for
Answer
2-271 §2.6 source ↗
For the following exercises, compute the center of mass Use symmetry to help locate the center of mass whenever possible.
in the triangle with vertices and
Answer
2-273 §2.6 source ↗
For the following exercises, use a calculator to draw the region, then compute the center of mass Use symmetry to help locate the center of mass whenever possible.
[T] The region bounded by and
Answer
2-275 §2.6 source ↗
For the following exercises, use a calculator to draw the region, then compute the center of mass Use symmetry to help locate the center of mass whenever possible.
[T] The region between and
Answer
2-277 §2.6 source ↗
For the following exercises, use a calculator to draw the region, then compute the center of mass Use symmetry to help locate the center of mass whenever possible.
[T] The region bounded by
Answer
2-279 §2.6 source ↗
For the following exercises, use a calculator to draw the region, then compute the center of mass Use symmetry to help locate the center of mass whenever possible.
[T] The region bounded by and in the first quadrant
Answer
2-281 §2.6 source ↗
For the following exercises, use the theorem of Pappus to determine the volume of the shape.
Rotating around the -axis between and
Answer
2-283 §2.6 source ↗
For the following exercises, use the theorem of Pappus to determine the volume of the shape.
A general cylinder created by rotating a rectangle with vertices and around the -axis. Does your answer agree with the volume of a cylinder?
Answer
2-285 §2.6 source ↗
For the following exercises, use a calculator to draw the region enclosed by the curve. Find the area and the centroid for the given shapes. Use symmetry to help locate the center of mass whenever possible.
[T] Quarter-circle: and
Answer
2-287 §2.6 source ↗
For the following exercises, use a calculator to draw the region enclosed by the curve. Find the area and the centroid for the given shapes. Use symmetry to help locate the center of mass whenever possible.
[T] Lens: and
Answer
2-289 §2.6 source ↗
For the following exercises, use a calculator to draw the region enclosed by the curve. Find the area and the centroid for the given shapes. Use symmetry to help locate the center of mass whenever possible.
[T] Half-ring: and
Answer
2-291 §2.6 source ↗
For the following exercises, use a calculator to draw the region enclosed by the curve. Find the area and the centroid for the given shapes. Use symmetry to help locate the center of mass whenever possible.
Find the generalized center of mass between and Then, use the Pappus theorem to find the volume of the solid generated when revolving around the y-axis.
Answer
2-293 §2.6 source ↗
For the following exercises, use a calculator to draw the region enclosed by the curve. Find the area and the centroid for the given shapes. Use symmetry to help locate the center of mass whenever possible.
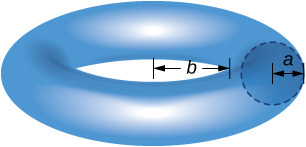
Use the theorem of Pappus to find the volume of a torus (pictured here). Assume that a disk of radius is positioned with the left end of the circle at and is rotated around the y-axis.
Answer
Checkpoint 2.35 §2.7 source ↗
Calculate the following derivatives:
a.
b.
Answer
a.
b.
Checkpoint 2.36 §2.7 source ↗
Answer
Checkpoint 2.37 §2.7 source ↗
Use properties of logarithms to simplify the following expression into a single logarithm:
Answer
Checkpoint 2.38 §2.7 source ↗
Evaluate the following derivatives:
a.
b.
Answer
a.
b.
Checkpoint 2.39 §2.7 source ↗
Answer
Checkpoint 2.40 §2.7 source ↗
Evaluate the following derivatives:
a.
b.
Answer
a.
b.
Checkpoint 2.41 §2.7 source ↗
Answer
2-295 §2.7 source ↗
For the following exercises, find the derivative
Answer
2-297 §2.7 source ↗
For the following exercises, find the derivative
Answer
2-299 §2.7 source ↗
For the following exercises, find the indefinite integral.
Answer
2-301 §2.7 source ↗
For the following exercises, find the derivative (You can use a calculator to plot the function and the derivative to confirm that it is correct.)
[T]
Answer
2-303 §2.7 source ↗
For the following exercises, find the derivative (You can use a calculator to plot the function and the derivative to confirm that it is correct.)
[T]
Answer
2-305 §2.7 source ↗
For the following exercises, find the derivative (You can use a calculator to plot the function and the derivative to confirm that it is correct.)
[T]
Answer
2-307 §2.7 source ↗
For the following exercises, find the derivative (You can use a calculator to plot the function and the derivative to confirm that it is correct.)
[T]
Answer
2-309 §2.7 source ↗
For the following exercises, find the derivative (You can use a calculator to plot the function and the derivative to confirm that it is correct.)
[T]
Answer
2-311 §2.7 source ↗
For the following exercises, find the definite or indefinite integral.
Answer
2-313 §2.7 source ↗
For the following exercises, find the definite or indefinite integral.
Answer
2-315 §2.7 source ↗
For the following exercises, find the definite or indefinite integral.
Answer
2-317 §2.7 source ↗
For the following exercises, find the definite or indefinite integral.
Answer
2-319 §2.7 source ↗
For the following exercises, find the definite or indefinite integral.
Answer
2-321 §2.7 source ↗
For the following exercises, compute by differentiating
Answer
2-323 §2.7 source ↗
For the following exercises, compute by differentiating
Answer
2-325 §2.7 source ↗
For the following exercises, compute by differentiating
Answer
2-327 §2.7 source ↗
For the following exercises, compute by differentiating
Answer
2-329 §2.7 source ↗
For the following exercises, compute by differentiating
Answer
2-331 §2.7 source ↗
For the following exercises, evaluate by any method.
Answer
2-333 §2.7 source ↗
For the following exercises, evaluate by any method.
Answer
2-335 §2.7 source ↗
For the following exercises, use the function If you are unable to find intersection points analytically, use a calculator.
Find the area of the region enclosed by and above
Answer
2-337 §2.7 source ↗
For the following exercises, use the function If you are unable to find intersection points analytically, use a calculator.
Find the area between and the x-axis from
Answer
2-339 §2.7 source ↗
For the following exercises, use the function If you are unable to find intersection points analytically, use a calculator.
[T] Find the surface area of the shape created when rotating the curve in the previous exercise from to around the x-axis.
Answer
2-341 §2.7 source ↗
If you are unable to find intersection points analytically in the following exercises, use a calculator.
[T] Find the arc length of from
Answer
Checkpoint 2.42 §2.8 source ↗
Answer
Checkpoint 2.43 §2.8 source ↗
Answer
Checkpoint 2.44 §2.8 source ↗
Answer
Checkpoint 2.45 §2.8 source ↗
Answer
Checkpoint 2.46 §2.8 source ↗
Answer
2-349 §2.8 source ↗
True or False? If true, prove it. If false, find the true answer.
If you invest an annual rate of interest of yields more money in the first year than a continuous rate of interest.
Answer
2-351 §2.8 source ↗
True or False? If true, prove it. If false, find the true answer.
If given a half-life of t years, the constant for is calculated by
Answer
2-353 §2.8 source ↗
For the following exercises, use
If bacteria increase by a factor of in hours, how many hours does it take to increase by
Answer
2-355 §2.8 source ↗
For the following exercises, use
If a relic contains as much radiocarbon as new material, can it have come from the time of Christ (approximately years ago)? Note that the half-life of radiocarbon is years.
Answer
2-357 §2.8 source ↗
For the following exercises, use
The populations of New York and Los Angeles are growing at and a year, respectively. Starting from million (New York) and million (Los Angeles), when are the populations equal? Round your answer to a whole number of years.
Answer
2-359 §2.8 source ↗
For the following exercises, use
The effect of advertising decays exponentially. If of the population remembers a new product after days, how long will remember it?
Answer
2-361 §2.8 source ↗
For the following exercises, use
If at and at when does
Answer
2-363 §2.8 source ↗
For the following exercises, use
What continuous interest rate has the same yield as an annual rate of
Answer
2-365 §2.8 source ↗
For the following exercises, use
You are trying to save in years for college tuition for your child. If interest is a continuous how much do you need to invest initially?
Answer
2-367 §2.8 source ↗
For the following exercises, use
You are trying to thaw some vegetables that are at a temperature of To thaw vegetables safely, you must put them in the refrigerator, which has an ambient temperature of You check on your vegetables hours after putting them in the refrigerator to find that they are now Plot the resulting temperature curve and use it to determine when the vegetables reach
Answer
2-369 §2.8 source ↗
For the following exercises, use
The spent fuel of a nuclear reactor contains plutonium-239, which has a half-life of years. If barrel containing of plutonium-239 is sealed, how many years must pass until only of plutonium-239 is left?
Answer
2-371 §2.8 source ↗
For the next set of exercises, use the following table, which features the world population by decade.
| Years since 1950 | Population (millions) |
|---|---|
[T] Find and graph the derivative of your equation. Where is it increasing and what is the meaning of this increase?
Answer
2-373 §2.8 source ↗
For the next set of exercises, use the following table, which features the world population by decade.
| Years since 1950 | Population (millions) |
|---|---|
[T] Find the predicted date when the population reaches billion. Using your previous answers about the first and second derivatives, explain why exponential growth is unsuccessful in predicting the future.
Answer
2-375 §2.8 source ↗
For the next set of exercises, use the following table, which shows the population of San Francisco during the 19th century.
| Years since 1850 | Population (thousands) |
|---|---|
[T] Find and graph the derivative of your equation. Where is it increasing? What is the meaning of this increase? Is there a value where the increase is maximal?
Answer
Checkpoint 2.47 §2.9 source ↗
Evaluate the following derivatives:
a.
b.
Answer
a.
b.
Checkpoint 2.48 §2.9 source ↗
Evaluate the following integrals:
a.
b.
Answer
a.
b.
Checkpoint 2.49 §2.9 source ↗
Evaluate the following derivatives:
a.
b.
Answer
a.
b.
Checkpoint 2.50 §2.9 source ↗
Evaluate the following integrals:
a.
b.
Answer
a.
b.
Checkpoint 2.51 §2.9 source ↗
Answer
2-377 §2.9 source ↗
Answer
2-379 §2.9 source ↗
Answer
2-381 §2.9 source ↗
Answer
2-383 §2.9 source ↗
Answer
2-385 §2.9 source ↗
For the following exercises, find the derivatives of the given functions and graph along with the function to ensure your answer is correct.
[T]
Answer
2-387 §2.9 source ↗
For the following exercises, find the derivatives of the given functions and graph along with the function to ensure your answer is correct.
[T]
Answer
2-389 §2.9 source ↗
For the following exercises, find the derivatives of the given functions and graph along with the function to ensure your answer is correct.
[T]
Answer
2-391 §2.9 source ↗
For the following exercises, find the derivatives of the given functions and graph along with the function to ensure your answer is correct.
[T]
Answer
2-393 §2.9 source ↗
For the following exercises, find the derivatives of the given functions and graph along with the function to ensure your answer is correct.
[T]
Answer
2-395 §2.9 source ↗
For the following exercises, find the antiderivatives for the given functions.
Answer
2-397 §2.9 source ↗
For the following exercises, find the antiderivatives for the given functions.
Answer
2-399 §2.9 source ↗
For the following exercises, find the antiderivatives for the given functions.
Answer
2-401 §2.9 source ↗
For the following exercises, find the antiderivatives for the given functions.
Answer
2-403 §2.9 source ↗
For the following exercises, find the antiderivatives for the given functions.
Answer
2-405 §2.9 source ↗
For the following exercises, find the derivatives for the functions.
Answer
2-407 §2.9 source ↗
For the following exercises, find the derivatives for the functions.
Answer
2-409 §2.9 source ↗
For the following exercises, find the derivatives for the functions.
Answer
2-411 §2.9 source ↗
For the following exercises, find the derivatives for the functions.
Answer
2-413 §2.9 source ↗
For the following exercises, find the antiderivatives for the functions.
Answer
2-415 §2.9 source ↗
For the following exercises, find the antiderivatives for the functions.
Answer
2-417 §2.9 source ↗
For the following exercises, find the antiderivatives for the functions.
Answer
2-419 §2.9 source ↗
For the following exercises, use the fact that a falling body with friction equal to velocity squared obeys the equation
Show that satisfies this equation.
Answer
2-421 §2.9 source ↗
For the following exercises, use the fact that a falling body with friction equal to velocity squared obeys the equation
[T] Estimate how far a body has fallen in seconds by finding the area underneath the curve of
Answer
2-423 §2.9 source ↗
For the following exercises, use this scenario: A cable hanging under its own weight has a slope that satisfies The constant is the ratio of cable density to tension.
Integrate to find the cable height if
Answer
2-425 §2.9 source ↗
For the following exercises, solve each problem.
[T] A chain hangs from two posts m apart to form a catenary described by the equation Find the slope of the catenary at the left fence post.
Answer
2-427 §2.9 source ↗
For the following exercises, solve each problem.
[T] A high-voltage power line is a catenary described by Find the ratio of the area under the catenary to its arc length. What do you notice?
Answer
2-435 §2.R source ↗
True or False? Justify your answer with a proof or a counterexample.
The amount of work to pump the water out of a half-full cylinder is half the amount of work to pump the water out of the full cylinder.
Answer
2-437 §2.R source ↗
True or False? Justify your answer with a proof or a counterexample.
The disk method can be used in any situation in which the washer method is successful at finding the volume of a solid of revolution.
Answer
2-439 §2.R source ↗
For the following exercises, use the requested method to determine the volume of the solid.
The volume that has a base of the ellipse and cross-sections of an equilateral triangle perpendicular to the Use the method of slicing.
Answer
2-441 §2.R source ↗
For the following exercises, use the requested method to determine the volume of the solid.
and rotated around the y-axis using the washer method
Answer
2-443 §2.R source ↗
For the following exercises, find
Answer
2-445 §2.R source ↗
For the following exercises, find
[T]
Answer
2-447 §2.R source ↗
For the following exercises, find
and
Answer
2-449 §2.R source ↗
For the following exercises, find
Find the mass of on a disk centered at the origin with radius
Answer
2-451 §2.R source ↗
For the following exercises, find
Find the mass and the center of mass of on the region bounded by and
Answer
2-453 §2.R source ↗
For the following exercises, find the requested arc lengths.
The length of for from to
Answer
2-455 §2.R source ↗
For the following exercises, find the surface area and volume when the given curves are revolved around the specified axis.
The loudspeaker created by revolving from to around the x-axis.
Answer
2-457 §2.R source ↗
For the following exercises, find the surface area and volume when the given curves are revolved around the specified axis.
You are a crime scene investigator attempting to determine the time of death of a victim. It is noon and outside and the temperature of the body is You know the cooling constant is When did the victim die, assuming that a human’s temperature is ?
Answer
2-459 §2.R source ↗
For the following exercises, consider the catenoid, the only solid of revolution that has a minimal surface, or zero mean curvature. A catenoid in nature can be found when stretching soap between two rings.
Find the volume of the catenoid from that is created by rotating this curve around the as shown here.
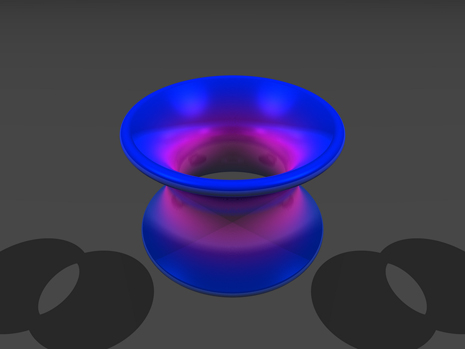
Answer
Loading chapter 3…
Problems and answers are adapted from Calculus Volume 2 by Gilbert Strang and Edwin “Jed” Herman, OpenStax, and are used under the CC BY-NC-SA 4.0 licence. Access for free at https://openstax.org/books/calculus-volume-2/pages/1-introduction. Illustrations: Copyright Rice University, OpenStax, under CC BY-NC-SA 4.0 license. This adaptation is released under the same licence, is non-commercial, and is neither affiliated with nor endorsed by OpenStax or Rice University.