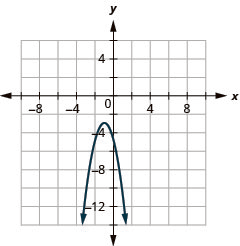
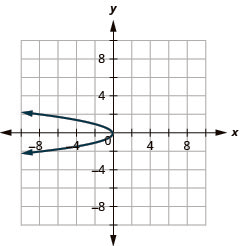
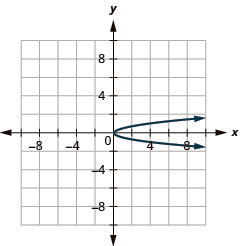
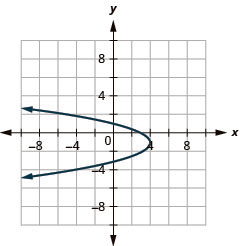
Every problem in the chapter beside the book’s answer, a chapter at a time as you scroll.

Chapter 11: Conics

271 problems · 171 figures

Be Prepared 11.1 §11.1 source ↗

Find the length of the hypotenuse of a right triangle whose legs are 12 and 16 inches.
If you missed this problem, review Example 2.34.
Example 2.34 in the book ↗

Answer

20 inches

Be Prepared 11.2 §11.1 source ↗

Factor: x2−18x+81.
If you missed this problem, review Example 6.24.
Example 6.24 in the book ↗

Answer

x − 9 2

Be Prepared 11.3 §11.1 source ↗

Solve by completing the square: x2− 12x− 12= 0.
If you missed this problem, review Example 9.22.
Example 9.22 in the book ↗

Answer

x = 6 ± 4 3

Try It 11.1 §11.1 source ↗

Use the rectangular coordinate system to find the distance between the points (6,1) and (2,−2).

Answer

d = 5

Try It 11.2 §11.1 source ↗

Use the rectangular coordinate system to find the distance between the points (5,3) and (−3,−3).

Answer

d = 10

Try It 11.3 §11.1 source ↗

Use the Distance Formula to find the distance between the points (−4,−5) and (5,7).

Answer

d = 15

Try It 11.4 §11.1 source ↗

Use the Distance Formula to find the distance between the points (−2,−5) and (−14,−10).

Answer

d = 13

Try It 11.5 §11.1 source ↗

Use the Distance Formula to find the distance between the points (−4,−5) and (3,4). Write the answer in exact form and then find the decimal approximation, rounded to the nearest tenth if needed.

Answer

d= 130 , d≈ 11.4

Try It 11.6 §11.1 source ↗

Use the Distance Formula to find the distance between the points (−2,−5) and (−3,−4). Write the answer in exact form and then find the decimal approximation, rounded to the nearest tenth if needed.

Answer

d = 2 , d ≈ 1.4

Try It 11.7 §11.1 source ↗

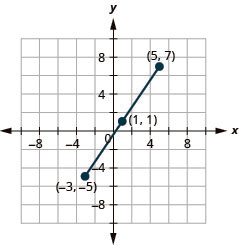
Use the Midpoint Formula to find the midpoint of the line segment whose endpoints are (−3,−5) and (5,7). Plot the endpoints and the midpoint on a rectangular coordinate system.

Answer

This graph shows a line segment with endpoints (negative 3, negative 5) and (5, 7) and midpoint (1, negative 1).

Try It 11.8 §11.1 source ↗

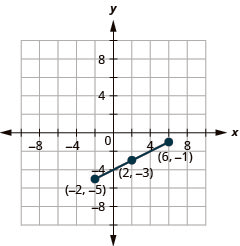
Use the Midpoint Formula to find the midpoint of the line segment whose endpoints are (−2,−5) and (6,−1). Plot the endpoints and the midpoint on a rectangular coordinate system.

Answer

This graph shows a line segment with endpoints (negative 2, negative 5) and (6, negative 1) and midpoint (2, negative 3).

Try It 11.9 §11.1 source ↗

Write the standard form of the equation of the circle with a radius of 6 and center (0,0).

Answer

x 2 + y 2 = 36

Try It 11.10 §11.1 source ↗

Write the standard form of the equation of the circle with a radius of 8 and center (0,0).

Answer

x 2 + y 2 = 64

Try It 11.11 §11.1 source ↗

Write the standard form of the equation of the circle with a radius of 7 and center (2,−4).

Answer

( x − 2 ) 2 + ( y + 4 ) 2 = 49

Try It 11.12 §11.1 source ↗

Write the standard form of the equation of the circle with a radius of 9 and center (−3,−5).

Answer

( x + 3 ) 2 + ( y + 5 ) 2 = 81

Try It 11.13 §11.1 source ↗

Write the standard form of the equation of the circle with center (2,1) that also contains the point (−2,−2).

Answer

( x − 2 ) 2 + ( y − 1 ) 2 = 25

Try It 11.14 §11.1 source ↗

Write the standard form of the equation of the circle with center (7,1) that also contains the point (−1,−5).

Answer

( x − 7 ) 2 + ( y − 1 ) 2 = 100

Try It 11.15 §11.1 source ↗

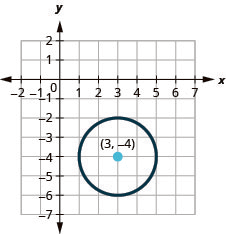
ⓐ Find the center and radius, then ⓑ graph the circle: (x−3)2+ (y+4)2= 4.

Answer

ⓐ The circle is centered at (3,−4) with a radius of 2.
ⓑ

This graph shows a circle with center at (3, negative 4) and a radius of 2.

Try It 11.16 §11.1 source ↗

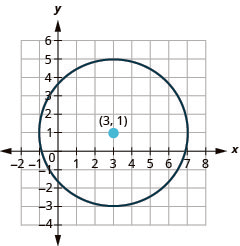
ⓐ Find the center and radius, then ⓑ graph the circle: (x−3)2+ (y−1)2= 16.

Answer

ⓐ The circle is centered at (3,1) with a radius of 4.
ⓑ

This graph shows circle with center at (3, 1) and a radius of 4.

Try It 11.17 §11.1 source ↗

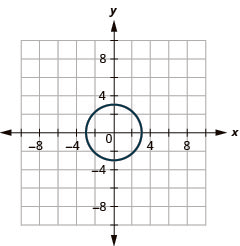
ⓐ Find the center and radius, then ⓑ graph the circle: 3x2+3y2=27

Answer

ⓐ The circle is centered at (0,0) with a radius of 3.
ⓑ

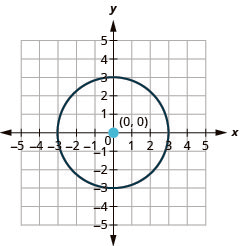
This graph shows circle with center at (0, 0) and a radius of 3.

Try It 11.18 §11.1 source ↗

ⓐ Find the center and radius, then ⓑ graph the circle: 5x2+5y2=125

Answer

ⓐ The circle is centered at (0,0) with a radius of 5.
ⓑ

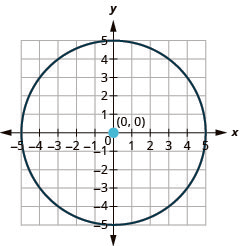
This graph shows circle with center at (0, 0) and a radius of 5.

Try It 11.19 §11.1 source ↗

ⓐ Find the center and radius, then ⓑ graph the circle: x2+ y2− 6x− 8y+ 9= 0.

Answer

ⓐ The circle is centered at (3,4) with a radius of 4.
ⓑ

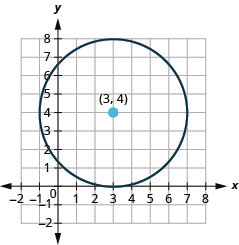
This graph shows circle with center at (3, 4) and a radius of 4.

Try It 11.20 §11.1 source ↗

ⓐ Find the center and radius, then ⓑ graph the circle: x2+ y2+ 6x− 2y+ 1= 0.

Answer

ⓐ The circle is centered at (−3,1) with a radius of 3.
ⓑ

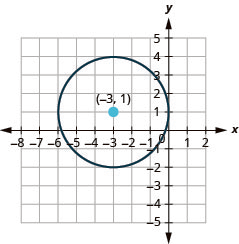
This graph shows circle with center at (negative 3, 1) and a radius of 3.

Try It 11.21 §11.1 source ↗

ⓐ Find the center and radius, then ⓑ graph the circle: x2+ y2− 2x− 3= 0.

Answer

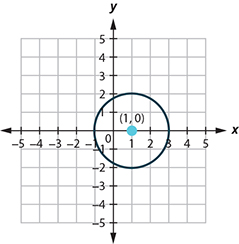
ⓐ The circle is centered at (1,0) with a radius of 2.
ⓑ

This graph shows circle with center at (1, 0) and a radius of 2.

Try It 11.22 §11.1 source ↗

ⓐ Find the center and radius, then ⓑ graph the circle: x2+ y2− 12y+ 11= 0.

Answer

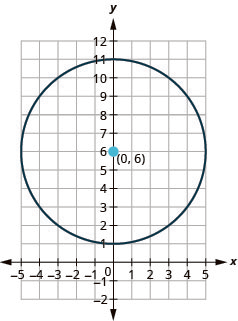
ⓐ The circle is centered at (0,6) with a radius of 5.
ⓑ

This graph shows circle with center at (0, 6) and a radius of 5.

11.1-1 §11.1 source ↗

Use the Distance Formula

In the following exercises, find the distance between the points. Write the answer in exact form and then find the decimal approximation, rounded to the nearest tenth if needed.

(2,0) and (5,4)

Answer

d = 5

11.1-3 §11.1 source ↗

Use the Distance Formula

In the following exercises, find the distance between the points. Write the answer in exact form and then find the decimal approximation, rounded to the nearest tenth if needed.

(−4,−3) and (8,2)

Answer

13

11.1-5 §11.1 source ↗

Use the Distance Formula

In the following exercises, find the distance between the points. Write the answer in exact form and then find the decimal approximation, rounded to the nearest tenth if needed.

(−1,4) and (2,0)

Answer

5

11.1-7 §11.1 source ↗

Use the Distance Formula

In the following exercises, find the distance between the points. Write the answer in exact form and then find the decimal approximation, rounded to the nearest tenth if needed.

(1,−4) and (6,8)

Answer

13

11.1-9 §11.1 source ↗

Use the Distance Formula

In the following exercises, find the distance between the points. Write the answer in exact form and then find the decimal approximation, rounded to the nearest tenth if needed.

(−3,−5) and (0,1)

Answer

d = 3 5 , d ≈ 6.7

11.1-11 §11.1 source ↗

Use the Distance Formula

In the following exercises, find the distance between the points. Write the answer in exact form and then find the decimal approximation, rounded to the nearest tenth if needed.

(3,−1) and (1,7)

Answer

d = 2 17 , d ≈ 8.2

11.1-13 §11.1 source ↗

Use the Midpoint Formula

In the following exercises, ⓐ find the midpoint of the line segment whose endpoints are given and ⓑ plot the endpoints and the midpoint on a rectangular coordinate system.

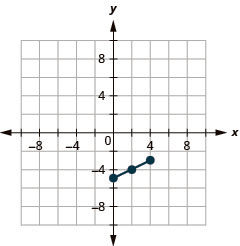
(0,−5) and (4,−3)

Answer

ⓐ Midpoint: (2,−4)
ⓑ

This graph shows line segment with endpoints (0, negative 5) and (4, negative 3) and midpoint (2, negative 4).

11.1-15 §11.1 source ↗

Use the Midpoint Formula

In the following exercises, ⓐ find the midpoint of the line segment whose endpoints are given and ⓑ plot the endpoints and the midpoint on a rectangular coordinate system.

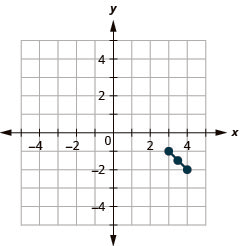
(3,−1) and (4,−2)

Answer

ⓐ Midpoint: (312,−112)
ⓑ

This graph shows line segment with endpoints (3, negative 1) and (4, negative 2) and midpoint (3 and a half, negative 1 and a half).

11.1-17 §11.1 source ↗

Write the Equation of a Circle in Standard Form

In the following exercises, write the standard form of the equation of the circle with the given radius and center (0,0).

Radius: 7

Answer

x 2 + y 2 = 49

11.1-19 §11.1 source ↗

Write the Equation of a Circle in Standard Form

In the following exercises, write the standard form of the equation of the circle with the given radius and center (0,0).

Radius: 2

Answer

x 2 + y 2 = 2

11.1-21 §11.1 source ↗

In the following exercises, write the standard form of the equation of the circle with the given radius and center

Radius: 1, center: (3,5)

Answer

( x − 3 ) 2 + ( y − 5 ) 2 = 1

11.1-23 §11.1 source ↗

In the following exercises, write the standard form of the equation of the circle with the given radius and center

Radius: 2.5, center: (1.5,−3.5)

Answer

( x − 1.5 ) 2 + ( y + 3.5 ) 2 = 6.25

11.1-25 §11.1 source ↗

For the following exercises, write the standard form of the equation of the circle with the given center with point on the circle.

Center (3,−2) with point (3,6)

Answer

( x − 3 ) 2 + ( y + 2 ) 2 = 64

11.1-27 §11.1 source ↗

For the following exercises, write the standard form of the equation of the circle with the given center with point on the circle.

Center (4,4) with point (2,2)

Answer

( x − 4 ) 2 + ( y − 4 ) 2 = 8

11.1-29 §11.1 source ↗

Graph a Circle

In the following exercises, ⓐ find the center and radius, then ⓑ graph each circle.

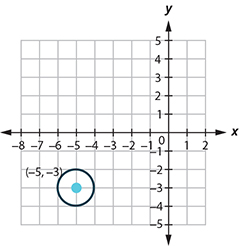
( x + 5 ) 2 + ( y + 3 ) 2 = 1

Answer

ⓐ The circle is centered at (−5,−3) with a radius of 1.
ⓑ

This graph shows a circle with center at (negative 5, negative 3) and a radius of 1.

11.1-31 §11.1 source ↗

Graph a Circle

In the following exercises, ⓐ find the center and radius, then ⓑ graph each circle.

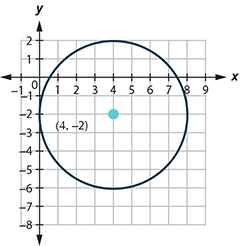
( x − 4 ) 2 + ( y + 2 ) 2 = 16

Answer

ⓐ The circle is centered at (4,−2) with a radius of 4.
ⓑ

This graph shows circle with center at (4, negative 2) and a radius of 4.

11.1-33 §11.1 source ↗

Graph a Circle

In the following exercises, ⓐ find the center and radius, then ⓑ graph each circle.

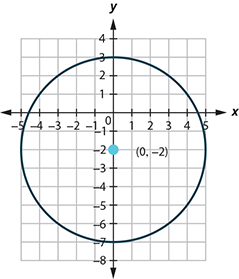
x 2 + ( y + 2 ) 2 = 25

Answer

ⓐ The circle is centered at (0,−2) with a radius of 5.
ⓑ

This graph shows circle with center at (negative 2, 5) and a radius of 5.

11.1-35 §11.1 source ↗

Graph a Circle

In the following exercises, ⓐ find the center and radius, then ⓑ graph each circle.

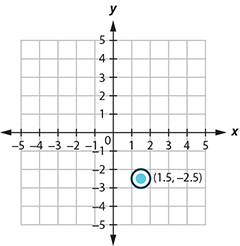
( x − 1.5 ) 2 + ( y + 2.5 ) 2 = 0.25

Answer

ⓐ The circle is centered at (1.5,−2.5) with a radius of 0.5.
ⓑ

This graph shows circle with center at (1.5, 2.5) and a radius of 0.5

11.1-37 §11.1 source ↗

Graph a Circle

In the following exercises, ⓐ find the center and radius, then ⓑ graph each circle.

x 2 + y 2 = 64

Answer

ⓐ The circle is centered at (0,0) with a radius of 8.
ⓑ

This graph shows circle with center at (0, 0) and a radius of 8.

11.1-39 §11.1 source ↗

Graph a Circle

In the following exercises, ⓐ find the center and radius, then ⓑ graph each circle.

2 x 2 + 2 y 2 = 8

Answer

ⓐ The circle is centered at (0,0) with a radius of 2.
ⓑ

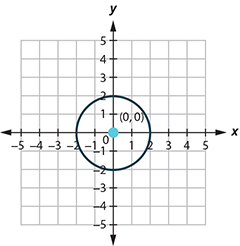
This graph shows circle with center at (0, 0) and a radius of 2.

11.1-41 §11.1 source ↗

In the following exercises, ⓐ identify the center and radius and ⓑ graph.

x 2 + y 2 + 2x+ 6y+ 9= 0

Answer

ⓐ Center: (−1,−3), radius: 1
ⓑ

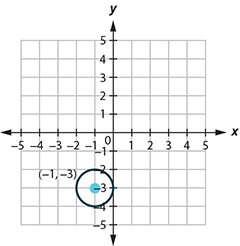
This graph shows circle with center at (negative 1, negative 3) and a radius of 1.

11.1-43 §11.1 source ↗

In the following exercises, ⓐ identify the center and radius and ⓑ graph.

x 2 + y 2 − 4x+ 10y− 7= 0

Answer

ⓐ Center: (2,−5), radius: 6
ⓑ

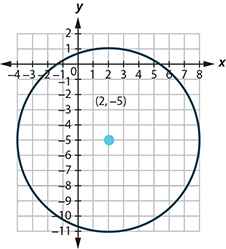
This graph shows circle with center at (2, negative 5) and a radius of 6.

11.1-45 §11.1 source ↗

In the following exercises, ⓐ identify the center and radius and ⓑ graph.

x 2 + y 2 + 6y+ 5= 0

Answer

ⓐ Center: (0,−3), radius: 2
ⓑ

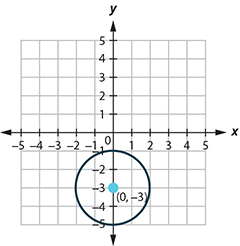
This graph shows circle with center at (0, negative 3) and a radius of 2.

11.1-47 §11.1 source ↗

In the following exercises, ⓐ identify the center and radius and ⓑ graph.

x 2 + y 2 + 4 x = 0

Answer

ⓐ Center: (−2,0), radius: 2
ⓑ

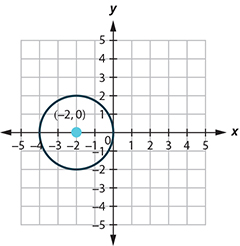
This graph shows circle with center at (negative 2, 0) and a radius of 2.

11.1-49 §11.1 source ↗

In the following exercises, ⓐ identify the center and radius and ⓑ graph.

Explain the relationship between the distance formula and the equation of a circle.

Answer

Answers will vary.

11.1-51 §11.1 source ↗

In the following exercises, ⓐ identify the center and radius and ⓑ graph.

In your own words, state the definition of a circle.

Answer

Answers will vary.

Be Prepared 11.4 §11.2 source ↗

Graph: y= −3x2+ 12x− 12.
If you missed this problem, review Example 9.47.
Example 9.47 in the book ↗

Answer

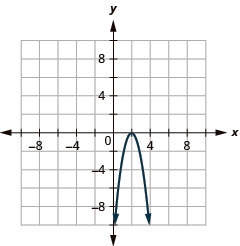
A downward-opening parabola is graphed on a Cartesian coordinate system. Its vertex is located at (2, 0), and it passes through points such as (0, -4) and (4, -4).

Be Prepared 11.5 §11.2 source ↗

Solve by completing the square: x2−6x+6=0.
If you missed this problem, review Example 9.12.
Example 9.12 in the book ↗

Answer

x = 3 ± 3

Be Prepared 11.6 §11.2 source ↗

Write in standard form: y=3x2−6x+5.
If you missed this problem, review Example 9.59.
Example 9.59 in the book ↗

Answer

y = 3 x − 1 2 + 2

Try It 11.23 §11.2 source ↗

Graph y=−x2+5x−6 by using properties.

Answer

This graph shows a parabola opening downward, with x intercepts (2, 0) and (3, 0) and y intercept (0, negative 6).

Try It 11.24 §11.2 source ↗

Graph y=−x2+8x−12 by using properties.

Answer

This graph shows a parabola opening downward, with vertex (4, 4) and x intercepts (2, 0) and (6, 0).

Try It 11.25 §11.2 source ↗

ⓐ Write y=2x2+4x+5 in standard form and ⓑ use properties of standard form to graph the equation.

Answer

ⓐ y=2(x+1)2+3
ⓑ

This graph shows a parabola opening upwards, with vertex (negative 1, 3) and y intercept (0, 5). It has the point minus (2, 5) on it.

Try It 11.26 §11.2 source ↗

ⓐ Write y=−2x2+8x−7 in standard form and ⓑ use properties of standard form to graph the equation.

Answer

ⓐ y= −2(x−2)2+ 1
ⓑ

This graph shows a parabola opening downwards, with vertex (2, 1) and axis of symmetry x equals 2. Its y intercept is (0, negative 7).

Try It 11.27 §11.2 source ↗

Graph x=y2 by using properties.

Answer

This graph shows right opening parabola with vertex at origin. Two points on it are (4, 2) and (4, negative 2).

Try It 11.28 §11.2 source ↗

Graph x=−y2 by using properties.

Answer

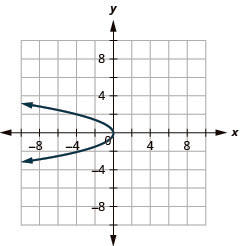
This graph shows left opening parabola with vertex at origin. Two points on it are (negative 4, 2) and (negative 4, negative 2).

Try It 11.29 §11.2 source ↗

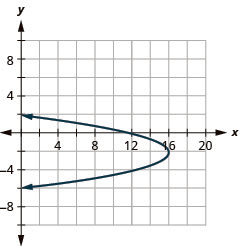
Graph x=−y2−4y+12 by using properties.

Answer

This graph shows left opening parabola with vertex (16, negative 2) and x intercept (12, 0).

Try It 11.30 §11.2 source ↗

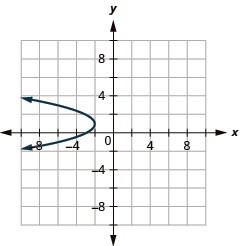
Graph x=−y2+2y−3 by using properties.

Answer

This graph shows left opening parabola with vertex (negative 2, 1) and x intercept minus (3, 0).

Try It 11.31 §11.2 source ↗

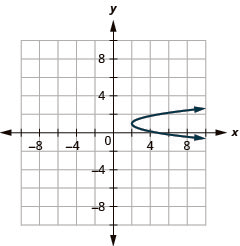
Graph x=3(y−1)2+2 using properties.

Answer

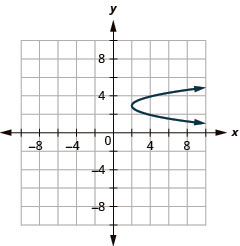
This graph shows a parabola opening right with vertex (2, 1) and x intercept (5, 0).

Try It 11.32 §11.2 source ↗

Graph x=2(y−3)2+2 using properties.

Answer

This graph shows a parabola opening right with vertex (2, 3) and symmetric points (4, 2) and (4, 4).

Try It 11.33 §11.2 source ↗

Graph x= −4(y+2)2+ 4 using properties.

Answer

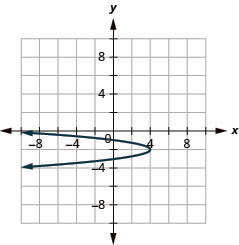
This figure shows a parabola opening to the left with vertex (4, negative 2) and y intercepts (0, negative 1) and (0, negative 3).

Try It 11.34 §11.2 source ↗

Graph x= −2(y+3)2+ 2 using properties.

Answer

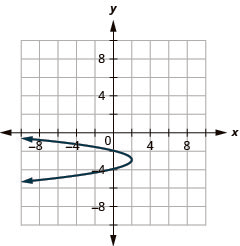
This figure shows a parabola opening to the left with vertex (2, negative 3) and y intercepts (0, negative 2) and (0, negative 4).

Try It 11.35 §11.2 source ↗

ⓐ Write x=3y2+6y+7 in standard form and ⓑ use properties of the standard form to graph the equation.

Answer

ⓐ x=3(y+1)2+4
ⓑ

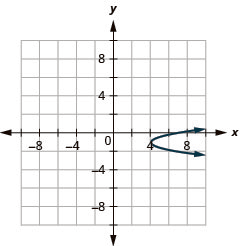
This graph shows a parabola opening to the right with vertex (4, negative 1) and x intercept (7, 0).

Try It 11.36 §11.2 source ↗

ⓐ Write x= −4y2− 16y− 12 in standard form and ⓑ use properties of the standard form to graph the equation.

Answer

ⓐ x= −4(y+2)2+ 4
ⓑ

This graph shows a parabola opening to the left with vertex (4, negative 2) and x intercept minus (12, 0).

Try It 11.37 §11.2 source ↗

Find the equation of the parabolic arch formed in the foundation of the bridge shown. Write the equation in standard form.
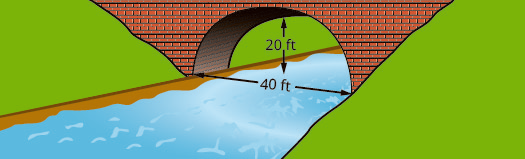
This figure shows a parabolic arch formed in the foundation of a bridge. It is 20 feet high and 40 feet wide at the base.

Answer

y= − 1 20 ( x − 20 ) 2 + 20

Try It 11.38 §11.2 source ↗

Find the equation of the parabolic arch formed in the foundation of the bridge shown. Write the equation in standard form.
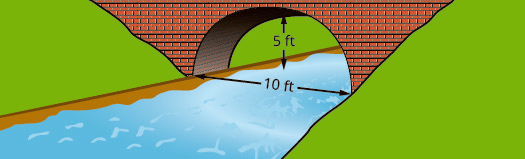
This figure shows a parabolic arch formed in the foundation of a bridge. It is 5 feet high and 10 feet wide at the base.

Answer

y= − 1 5 ( x − 5 ) 2 + 5

11.2-53 §11.2 source ↗

Graph Vertical Parabolas

In the following exercises, graph each equation by using properties.

y = − x 2 + 4 x − 3

Answer

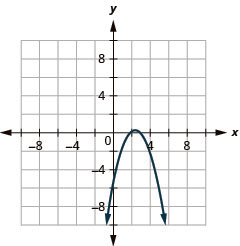
This graph shows a parabola opening downward with vertex (2, 1) and x intercepts (1, 0) and (3, 0).

11.2-55 §11.2 source ↗

Graph Vertical Parabolas

In the following exercises, graph each equation by using properties.

y = 6 x 2 + 2 x − 1

Answer

This graph shows a parabola opening upward. The vertex is (negative 0.167, negative 1.167), the x intercepts are (negative 0.608) and (negative 0.274, 0), and the y-intercept is (0, negative 1).

11.2-57 §11.2 source ↗

In the following exercises, ⓐ write the equation in standard form and ⓑ use properties of the standard form to graph the equation.

y = − x 2 + 2 x − 4

Answer

ⓐ y=−(x−1)2−3
ⓑ

This graph shows a parabola opening downward with vertex (1, negative 3) and y intercept (0, 4).

11.2-59 §11.2 source ↗

In the following exercises, ⓐ write the equation in standard form and ⓑ use properties of the standard form to graph the equation.

y = −2 x 2 − 4 x − 5

Answer

ⓐ y= −2(x+1)2− 3
ⓑ

This graph shows a parabola opening downward with vertex (negative 1, negative 3) and x intercepts (negative 5, 0).

11.2-61 §11.2 source ↗

Graph Horizontal Parabolas

In the following exercises, graph each equation by using properties.

x = −2 y 2

Answer

This graph shows a parabola opening to the left with vertex (0, 0). Two points on it are (negative 2, 1) and (negative 2, negative 1).

11.2-63 §11.2 source ↗

Graph Horizontal Parabolas

In the following exercises, graph each equation by using properties.

x = 4 y 2

Answer

This graph shows a parabola opening to the right with vertex (0, 0). Two points on it are (4, 1) and (4, negative 1).

11.2-65 §11.2 source ↗

Graph Horizontal Parabolas

In the following exercises, graph each equation by using properties.

x = − y 2 − 2 y + 3

Answer

This graph shows a parabola opening to the left with vertex (4, negative 1) and y intercepts (0, 1) and (0, negative 3).

11.2-67 §11.2 source ↗

Graph Horizontal Parabolas

In the following exercises, graph each equation by using properties.

x = y 2 + 6 y + 8

Answer

This graph shows a parabola opening to the right with vertex (negative 1, negative 3) and y intercepts (0, negative 2) and (0, negative 4).

11.2-69 §11.2 source ↗

Graph Horizontal Parabolas

In the following exercises, graph each equation by using properties.

x = ( y − 2 ) 2 + 3

Answer

This graph shows a parabola opening to the right with vertex (3, 2) and x intercept (7, 0).

11.2-71 §11.2 source ↗

Graph Horizontal Parabolas

In the following exercises, graph each equation by using properties.

x = − ( y − 1 ) 2 + 2

Answer

This graph shows a parabola opening to the left with vertex (2, 1) and x intercept (1, 0).

11.2-73 §11.2 source ↗

Graph Horizontal Parabolas

In the following exercises, graph each equation by using properties.

x = ( y + 2 ) 2 + 1

Answer

This graph shows a parabola opening to the right with vertex (1, negative 2) and x intercept (5, 0).

11.2-75 §11.2 source ↗

Graph Horizontal Parabolas

In the following exercises, graph each equation by using properties.

x = − ( y + 3 ) 2 + 2

Answer

This graph shows a parabola opening to the left with vertex (2, negative 3). Two points on it are (negative 2, negative 1) and (negative 2, 5).

11.2-77 §11.2 source ↗

Graph Horizontal Parabolas

In the following exercises, graph each equation by using properties.

x= −3 ( y − 2 ) 2 + 3

Answer

This graph shows a parabola opening to the left with vertex (3, 2) and y intercepts (0, 1) and (0, 3).

11.2-79 §11.2 source ↗

Graph Horizontal Parabolas

In the following exercises, graph each equation by using properties.

x = 4 ( y + 1 ) 2 − 4

Answer

This graph shows a parabola opening to the right with vertex (negative 4, negative 1) and y intercepts (0, 0) and (0, negative 2).

11.2-81 §11.2 source ↗

In the following exercises, ⓐ write the equation in standard form and ⓑ use properties of the standard form to graph the equation.

x = y 2 + 4 y − 5

Answer

ⓐ x=(y+2)2−9
ⓑ

This graph shows a parabola opening to the right with vertex (negative 9, negative 2) and y intercepts (0, 1) and (0, negative 5).

11.2-83 §11.2 source ↗

In the following exercises, ⓐ write the equation in standard form and ⓑ use properties of the standard form to graph the equation.

x= −2 y 2 − 12y− 16

Answer

ⓐ x= −2(y+3)2+ 2
ⓑ

This graph shows a parabola opening to the left with vertex (2, negative 3) and y intercepts (0, negative 2) and (0, negative 4).

11.2-85 §11.2 source ↗

Mixed Practice

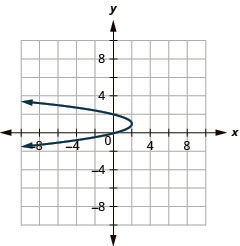
In the following exercises, match each graph to one of the following equations: ⓐ x2 + y2 = 64 ⓑ x2 + y2 = 49
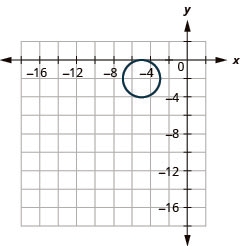
ⓒ (x + 5)2 + (y + 2)2 = 4 ⓓ (x − 2)2 + (y − 3)2 = 9 ⓔ y = −x2 + 8x − 15 ⓕ y = 6x2 + 2x − 1
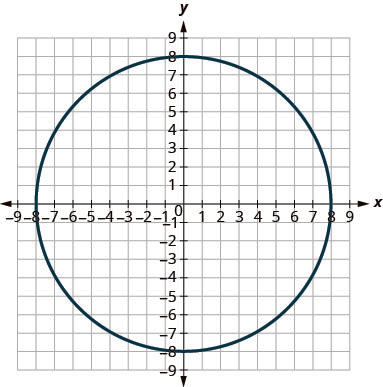
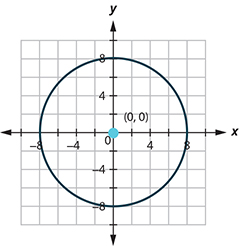
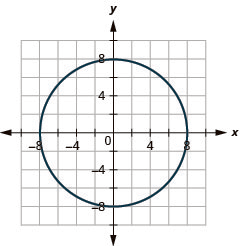
This graph shows circle with center (0, 0) and radius 8 units.

Answer

ⓐ

11.2-87 §11.2 source ↗

Mixed Practice

In the following exercises, match each graph to one of the following equations: ⓐ x2 + y2 = 64 ⓑ x2 + y2 = 49
ⓒ (x + 5)2 + (y + 2)2 = 4 ⓓ (x − 2)2 + (y − 3)2 = 9 ⓔ y = −x2 + 8x − 15 ⓕ y = 6x2 + 2x − 1
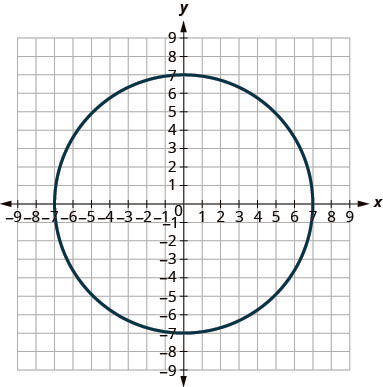
This graph shows circle with center (0, 0) and radius 7 units.

Answer

ⓑ

11.2-89 §11.2 source ↗

Mixed Practice

In the following exercises, match each graph to one of the following equations: ⓐ x2 + y2 = 64 ⓑ x2 + y2 = 49
ⓒ (x + 5)2 + (y + 2)2 = 4 ⓓ (x − 2)2 + (y − 3)2 = 9 ⓔ y = −x2 + 8x − 15 ⓕ y = 6x2 + 2x − 1
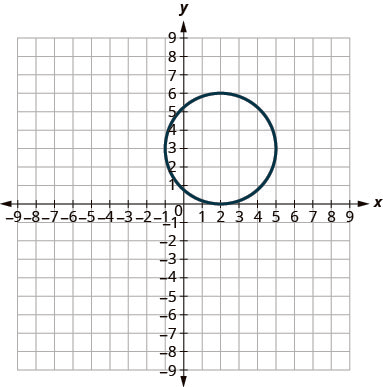
This graph shows circle with center (2, 3) and radius 3 units.

Answer

ⓓ

11.2-91 §11.2 source ↗

Solve Applications with Parabolas

Write the equation in standard form of the parabolic arch formed in the foundation of the bridge shown. Write the equation in standard form.

This graph shows circle with center (negative 5, negative 2) and radius 2 units.

Answer

y= − 1 15 ( x − 15 ) 2 + 15

11.2-93 §11.2 source ↗

Solve Applications with Parabolas

Write the equation in standard form of the parabolic arch formed in the foundation of the bridge shown. Write the equation in standard form.

This figure shows a parabolic arch formed in the foundation of a bridge. It is 90 feet high and 60 feet wide at the base.

Answer

y= − 1 10 ( x − 30 ) 2 + 90

11.2-95 §11.2 source ↗

Solve Applications with Parabolas

In your own words, define a parabola.

Answer

Answers will vary.

11.2-97 §11.2 source ↗

Solve Applications with Parabolas

Write the equation of a parabola that opens up or down in standard form and the equation of a parabola that opens left or right in standard form. Provide a sketch of the parabola for each one, label the vertex and axis of symmetry.

Answer

Answers will vary.

Be Prepared 11.7 §11.3 source ↗

Graph y=(x−1)2−2 using transformations.
If you missed this problem, review Example 9.57.
Example 9.57 in the book ↗

Answer

A graph displays a blue upward-opening parabola on a Cartesian coordinate plane. The curve has its vertex at approximately (1, -2) and crosses the x-axis at roughly x=0 and x=2.5. Grid lines are visible.

Be Prepared 11.8 §11.3 source ↗

Complete the square: x2−8x=8.
If you missed this problem, review Example 9.12.
Example 9.12 in the book ↗

Answer

x − 4 2 = 8

Be Prepared 11.9 §11.3 source ↗

Write in standard form. y= 2x2− 12x+ 14
If you missed this problem, review Example 9.59.
Example 9.59 in the book ↗

Answer

y = 2 x − 3 2 − 4

Try It 11.39 §11.3 source ↗

Graph: x24+y216=1.

Answer

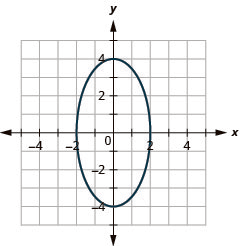
This graph shows an ellipse with x intercepts (negative 2, 0) and (2, 0) and y intercepts (0, 4) and (0, negative 4).

Try It 11.40 §11.3 source ↗

Graph: x29+y216=1.

Answer

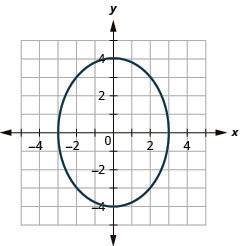
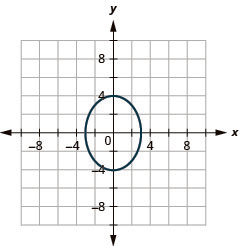
This graph shows an ellipse with x intercepts (negative 3, 0) and (3, 0) and y intercepts (0, 4) and (0, negative 4).

Try It 11.41 §11.3 source ↗

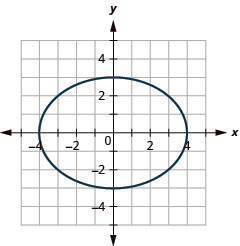
Graph 9x2+ 16y2= 144.

Answer

This graph shows an ellipse with x intercepts (negative 4, 0) and (4, 0) and y intercepts (0, 3) and (0, negative 3).

Try It 11.42 §11.3 source ↗

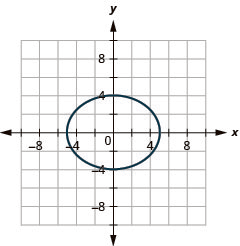
Graph 16x2+ 25y2= 400.

Answer

This graph shows an ellipse with x intercepts (negative 5, 0) and (5, 0) and y intercepts (0, 4) and (0, negative 4).

Try It 11.43 §11.3 source ↗

Find the equation of the ellipse shown.
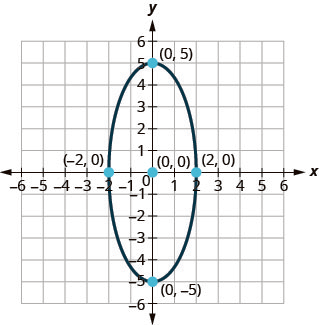
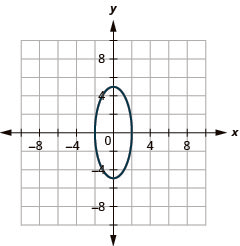
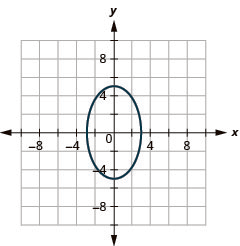
This graph shows an ellipse with x intercepts (negative 2, 0) and (2, 0) and y intercepts (0, 5) and (0, negative 5).

Answer

x 2 4 + y 2 25 = 1

Try It 11.44 §11.3 source ↗

Find the equation of the ellipse shown.
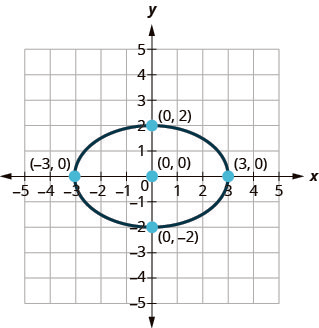
This graph shows an ellipse with x intercepts (negative 3, 0) and (3, 0) and y intercepts (0, 2) and (0, negative 2).

Answer

x 2 9 + y 2 4 = 1

Try It 11.45 §11.3 source ↗

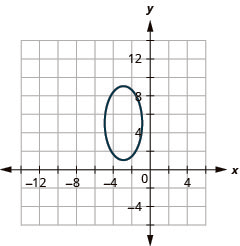
Graph: (x+3)24+ (y−5)216= 1.

Answer

This graph shows an ellipse with center at (negative 3, 5), vertices at (negative 3, 9) and (negative 3, 1) and endpoints of minor axis at (negative 5, 5) and (negative 1, 5).

Try It 11.46 §11.3 source ↗

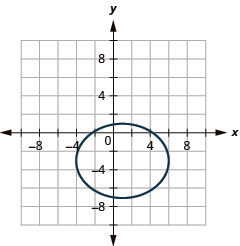
Graph: (x−1)225+ (y+3)216= 1.

Answer

This graph shows an ellipse with center at 1, negative 3, vertices at (negative 4, negative 3) and (6, negative 3) and endpoints of minor axis at 1, 1) and (negative 1, negative 7).

Try It 11.47 §11.3 source ↗

Graph (x−5)29+ (y+4)24= 1 by translation.

Answer

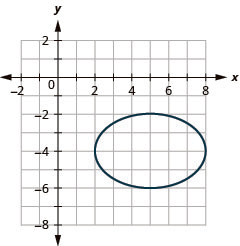
This graph shows an ellipse with center (5, negative 4), vertices (2, negative 4) and (8, negative 4) and endpoints of minor axis (5, negative 2) and (5, negative 6).

Try It 11.48 §11.3 source ↗

Graph (x+6)216+ (y+2)225= 1 by translation.

Answer

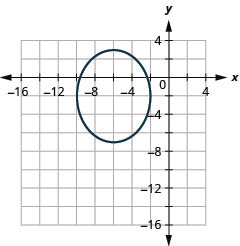
This graph shows an ellipse with center (negative 6, negative 2), vertices (negative 6, 3) and (negative 6, negative 7) and endpoints of minor axis (negative 10, negative 2), and (negative 2, negative 2).

Try It 11.49 §11.3 source ↗

ⓐ Write the equation 6x2+ 4y2+ 12x− 32y+ 34= 0 in standard form and ⓑ graph.

Answer

ⓐ (x+1)26+ (y−4)29= 1
ⓑ

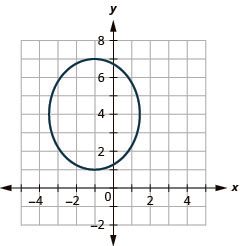
This graph shows an ellipse with center (negative 1, 4), vertices minus (1, 1) and (negative 1, 7) and endpoints of minor axis approximately (negative 3.5, 4) and (approximately 1.5, 4).

Try It 11.50 §11.3 source ↗

ⓐ Write the equation 4x2+ y2− 16x− 6y+ 9= 0 in standard form and ⓑ graph.

Answer

ⓐ (x−2)24+ (y−3)216= 1
ⓑ

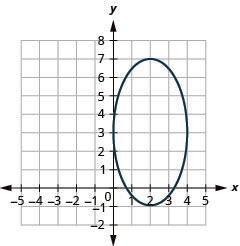
This graph shows an ellipse with center (2, 3), vertices (2, negative 1) and (2, 7) and endpoints of minor axis (0, 3) and (4, 3).

Try It 11.51 §11.3 source ↗

A planet moves in an elliptical orbit around its sun. The closest the planet gets to the sun is approximately 20 AU and the furthest is approximately 30 AU. The sun is one of the foci of the elliptical orbit. Letting the ellipse center at the origin and labeling the axes in AU, the orbit will look like the figure below. Use the graph to write an equation for the elliptical orbit of the planet.
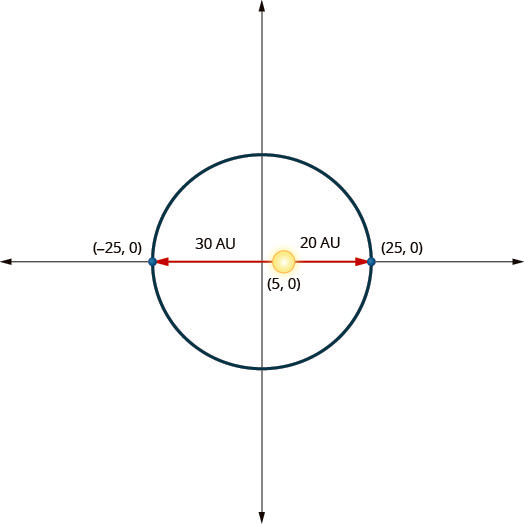
This graph shows an ellipse with center (0, 0) and vertices (negative 25, 0) and (25, 0). The sun is shown at point (5, 0). This is 20 units from the right vertex and 30 units from the left vertex.

Answer

x 2 625 + y 2 600 = 1

Try It 11.52 §11.3 source ↗

A planet moves in an elliptical orbit around its sun. The closest the planet gets to the sun is approximately 20 AU and the furthest is approximately 50 AU. The sun is one of the foci of the elliptical orbit. Letting the ellipse center at the origin and labeling the axes in AU, the orbit will look like the figure below. Use the graph to write an equation for the elliptical orbit of the planet.
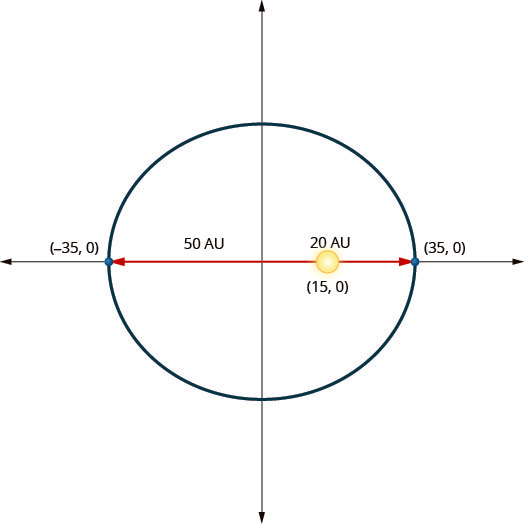
This graph shows an ellipse with center (0, 0) and vertices (negative 35, 0) and (35, 0). The sun is shown at point (15, 0). This is 20 units from the right vertex and 50 units from the left vertex.

Answer

x 2 1225 + y 2 1000 = 1

11.3-99 §11.3 source ↗

Graph an Ellipse with Center at the Origin

In the following exercises, graph each ellipse.

x 2 4 + y 2 25 = 1

Answer

This graph shows an ellipse with center (0, 0), vertices (0, 5) and (0, negative 5) and endpoints of minor axis (2, 0) and (negative 2, 0).

11.3-101 §11.3 source ↗

Graph an Ellipse with Center at the Origin

In the following exercises, graph each ellipse.

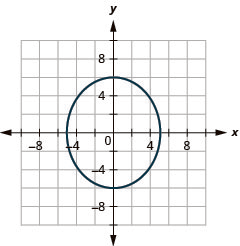
x 2 25 + y 2 36 = 1

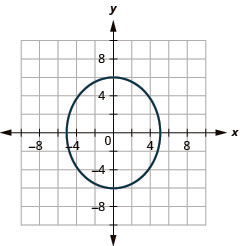
Answer

This graph shows an ellipse with center (0, 0), vertices (0, 6) and (0, negative 6) and endpoints of minor axis (5, 0) and (negative 5, 0).

11.3-103 §11.3 source ↗

Graph an Ellipse with Center at the Origin

In the following exercises, graph each ellipse.

x 2 36 + y 2 16 = 1

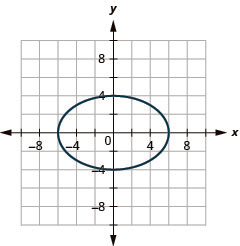
Answer

This graph shows an ellipse with center (0, 0), vertices (6, 0) and (negative 6, 0) and endpoints of minor axis (0, 4) and (0, negative 4).

11.3-105 §11.3 source ↗

Graph an Ellipse with Center at the Origin

In the following exercises, graph each ellipse.

x 2 + y 2 4 = 1

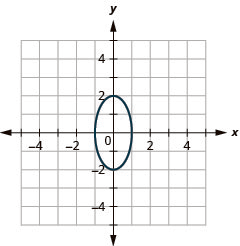
Answer

This graph shows an ellipse with center (0, 0), vertices (0, 2) and (0, negative 2) and endpoints of minor axis (1, 0) and (negative 1, 0).

11.3-107 §11.3 source ↗

Graph an Ellipse with Center at the Origin

In the following exercises, graph each ellipse.

4 x 2 + 25 y 2 = 100

Answer

This graph shows an ellipse with center (0, 0), vertices (5, 0) and (negative 5, 0) and endpoints of minor axis (0, 2) and (0, negative 2).

11.3-109 §11.3 source ↗

Graph an Ellipse with Center at the Origin

In the following exercises, graph each ellipse.

16 x 2 + 36 y 2 = 576

Answer

This graph shows an ellipse with center (0, 0), vertices (6, 0) and (negative 6, 0) and endpoints of minor axis (0, 4) and (0, negative 4).

11.3-111 §11.3 source ↗

Find the Equation of an Ellipse with Center at the Origin

In the following exercises, find the equation of the ellipse shown in the graph.
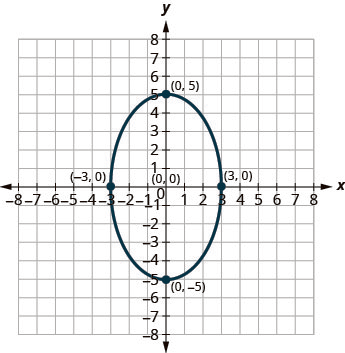

This graph shows an ellipse with center (0, 0), vertices (0, 5) and (0, negative 5) and endpoints of minor axis (negative 3, 0) and (3, 0).

Answer

x 2 9 + y 2 25 = 1

11.3-113 §11.3 source ↗

Find the Equation of an Ellipse with Center at the Origin

In the following exercises, find the equation of the ellipse shown in the graph.
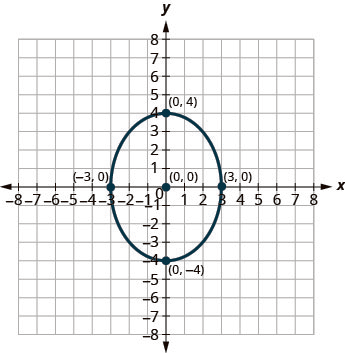

This graph shows an ellipse with center (0, 0), vertices (0, 4) and (0, negative 4) and endpoints of minor axis (negative 3, 0) and (3, 0).

Answer

x 2 9 + y 2 16 = 1

11.3-115 §11.3 source ↗

Graph an Ellipse with Center Not at the Origin

In the following exercises, graph each ellipse.

( x + 1 ) 2 4 + ( y + 6 ) 2 25 = 1

Answer

This graph shows an ellipse with center (negative 1, negative 6, vertices (negative 1, negative 1) and (negative 1, negative 11) and endpoints of minor axis (negative 3, negative 6) and (1, negative 6).

11.3-117 §11.3 source ↗

Graph an Ellipse with Center Not at the Origin

In the following exercises, graph each ellipse.

( x + 4 ) 2 4 + ( y − 2 ) 2 9 = 1

Answer

This graph shows an ellipse with center (negative 4, 2, vertices (negative 4, 5) and (negative 4, negative 1) and endpoints of minor axis (3, 1) and (negative 6, 2) and (negative 2, 2).

11.3-119 §11.3 source ↗

In the following exercises, graph each equation by translation.

( x − 3 ) 2 4 + ( y − 7 ) 2 25 = 1

Answer

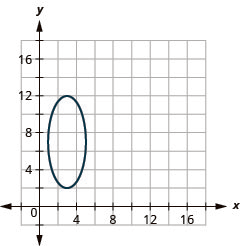
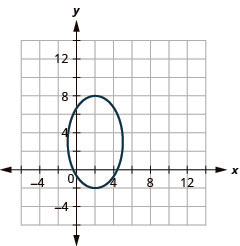
This graph shows an ellipse with center (3, 7), vertices (3, 2) and (3, 12), and endpoints of minor axis (1, 7) and (5, 7).

11.3-121 §11.3 source ↗

In the following exercises, graph each equation by translation.

( x − 5 ) 2 9 + ( y + 4 ) 2 25 = 1

Answer

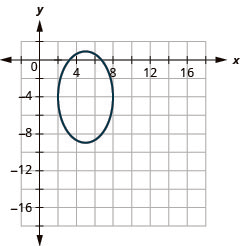
This graph shows an ellipse with center (5, negative 4), vertices (5, 1) and (5, negative 9) and endpoints of minor axis (2, negative 4) and (8, negative 4).

11.3-123 §11.3 source ↗

In the following exercises, ⓐ write the equation in standard form and ⓑ graph.

25 x 2 + 9 y 2 − 100x− 54y− 44= 0

Answer

ⓐ (x−2)29+ (y−3)225= 1
ⓑ

This graph shows an ellipse with center (2, 3), vertices (2, negative 2) and (2, 8) and endpoints of minor axis (negative 1, 3) and (5, 3).

11.3-125 §11.3 source ↗

In the following exercises, ⓐ write the equation in standard form and ⓑ graph.

4 x 2 + 25 y 2 − 24x− 64= 0

Answer

ⓐ y24+ (x−3)225= 1
ⓑ

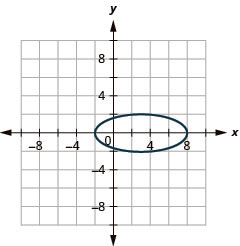
This graph shows an ellipse with center (3, 0), vertices (negative 2, 0) and (8, 0) and endpoints of minor axis (3, 2) and (3, negative 2).

11.3-127 §11.3 source ↗

In the following exercises, graph the equation.

x= −2 ( y − 1 ) 2 + 2

Answer

This graph shows a parabola with vertex (2, 1) and y intercepts (0, 0) and (2, 0).

11.3-129 §11.3 source ↗

In the following exercises, graph the equation.

( x + 5 ) 2 + ( y + 2 ) 2 = 4

Answer

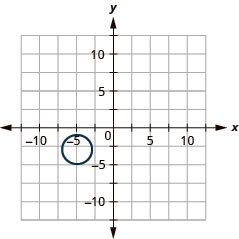
This graph shows a circle with center (negative 5, negative 2) and a radius of 2 units.

11.3-131 §11.3 source ↗

In the following exercises, graph the equation.

( x + 3 ) 2 16 + ( y + 1 ) 2 4 = 1

Answer

This graph shows an ellipse with center (negative 3, negative 1), vertices (1, negative 1) and (negative 7, negative 1) and endpoints of minor axis (negative 3, 1) and (negative 3, negative 3).

11.3-133 §11.3 source ↗

In the following exercises, graph the equation.

x 2 25 + y 2 36 = 1

Answer

This graph shows an ellipse with center (0, 0), vertices (0, 6) and (0, negative 6) and endpoints of minor axis (negative 5, 0) and (5, 0).

11.3-135 §11.3 source ↗

In the following exercises, graph the equation.

x 2 + y 2 = 64

Answer

This graph shows circle with center (0, 0) and with radius 8 units.

11.3-137 §11.3 source ↗

In the following exercises, graph the equation.

y = 6 x 2 + 2 x − 1

Answer

This graph shows upward opening parabola. Its vertex has an x value of slightly less than 0 and a y value of slightly less than minus 1. A point on it is approximately at (negative 1, 3).

11.3-139 §11.3 source ↗

Solve Application with Ellipses

A planet moves in an elliptical orbit around its sun. The closest the planet gets to the sun is approximately 10 AU and the furthest is approximately 30 AU. The sun is one of the foci of the elliptical orbit. Letting the ellipse center at the origin and labeling the axes in AU, the orbit will look like the figure below. Use the graph to write an equation for the elliptical orbit of the planet.
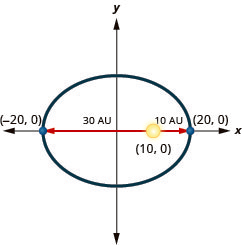
This graph shows an ellipse with center (0, 0), vertices (negative 20, 0) and (20, 0). The sun is shown at point (10, 0), which is 30 units from the left vertex and 10 units from the right vertex.

Answer

x 2 400 + y 2 300 = 1

11.3-141 §11.3 source ↗

Solve Application with Ellipses

A comet moves in an elliptical orbit around a sun. The closest the comet gets to the sun is approximately 15 AU and the furthest is approximately 85 AU. The sun is one of the foci of the elliptical orbit. Letting the ellipse center at the origin and labeling the axes in AU, the orbit will look like the figure below. Use the graph to write an equation for the elliptical orbit of the comet.
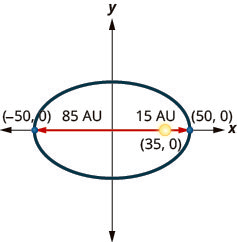
This graph shows an ellipse with center (0, 0), vertices (negative 50, 0) and (50, 0). The sun is shown at point (35, 0), which is 85 units from the left vertex and 15 units from the right vertex.

Answer

x 2 2500 + y 2 1275 = 1

11.3-143 §11.3 source ↗

Solve Application with Ellipses

In your own words, define an ellipse and write the equation of an ellipse centered at the origin in standard form. Draw a sketch of the ellipse labeling the center, vertices and major and minor axes.

Answer

Answers will vary.

11.3-145 §11.3 source ↗

Solve Application with Ellipses

Compare and contrast the graphs of the equations x24+y29=1 and x29+y24=1.

Answer

Answers will vary.

Be Prepared 11.10 §11.4 source ↗

Solve: x2=12.
If you missed this problem, review Example 9.1.
Example 9.1 in the book ↗

Answer

x = ± 2 3

Be Prepared 11.11 §11.4 source ↗

Expand: (x−4)2.
If you missed this problem, review Example 5.32.
Example 5.32 in the book ↗

Answer

x 2 − 8 x + 16

Be Prepared 11.12 §11.4 source ↗

Graph y=−23x.
If you missed this problem, review Example 3.4.
Example 3.4 in the book ↗

Answer

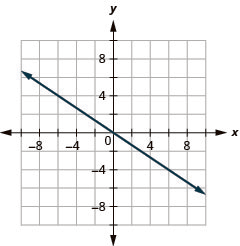
A coordinate plane with a line graph passing through the origin (0,0), showing a negative slope, extending infinitely in both directions.

Try It 11.53 §11.4 source ↗

Graph x216−y24=1.

Answer

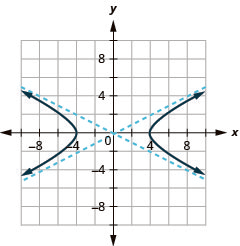
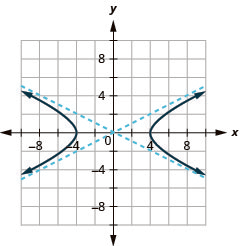
The graph shows the x-axis and y-axis that both run in the negative and positive directions, but at unlabeled intervals, with asymptotes y is equal to plus or minus one-half times x, and branches that pass through the vertices (plus or minus 4, 0) and open left and right.

Try It 11.54 §11.4 source ↗

Graph x29−y216=1.

Answer

The graph shows the x-axis and y-axis that both run in the negative and positive directions, but at unlabeled intervals, with asymptotes y is equal to plus or minus four-thirds times x, and branches that pass through the vertices (plus or minus 3, 0) and open left and right.

Try It 11.55 §11.4 source ↗

Graph 4y2− 25x2= 100.

Answer

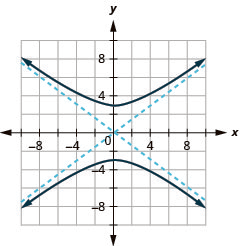
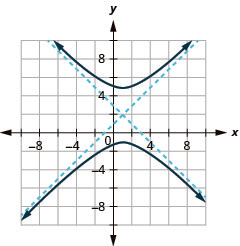
The graph shows the x-axis and y-axis that both run in the negative and positive directions, but at unlabeled intervals, with asymptotes y is equal to plus or minus five-halves times x, and branches that pass through the vertices (0, plus or minus 5) and open up and down.

Try It 11.56 §11.4 source ↗

Graph 25y2− 9x2= 225.

Answer

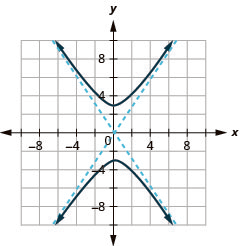
The graph shows the x-axis and y-axis that both run in the negative and positive directions, but at unlabeled intervals, with asymptotes y is equal to plus or minus three-fifths times x, and branches that pass through the vertices (0, plus or minus 3) and open up and down.

Try It 11.57 §11.4 source ↗

Graph (x−3)225− (y−1)29= 1.

Answer

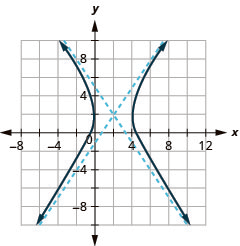
The graph shows the x-axis and y-axis that both run in the negative and positive directions, but at unlabeled intervals, with an asymptote that passes through (negative 2, negative 2) and (8, 4) and an asymptote that passes through (negative 2, 4) and (8, negative 2), and branches that pass through the vertices (negative 2, 2) and (8, 2) and opens left and right.

Try It 11.58 §11.4 source ↗

Graph (x−2)24− (y−2)29= 1.

Answer

The graph shows the x-axis and y-axis that both run in the negative and positive directions, but at unlabeled intervals, with the center (2, 2), an asymptote that passes through (0, negative 1) and (4, 5) and an asymptote that passes through (0, 5) and (4, negative 1), and branches that pass through the vertices (0, 2) and (4, 2) and opens left and right.

Try It 11.59 §11.4 source ↗

Graph (y+3)216− (x+2)29= 1.

Answer

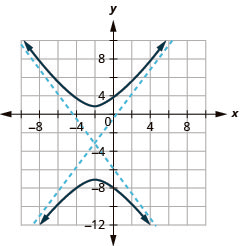
The graph shows the x-axis and y-axis that both run in the negative and positive directions, but at unlabeled intervals, with a center at (negative 2, negative 3), an asymptote that passes through (negative 5, negative 7) and (1, 1) and an asymptote that passes through (negative 5, 1) and (1, 7), and branches that pass through the vertices (negative 2, 1) and (negative 2, negative 7) and opens up and down.

Try It 11.60 §11.4 source ↗

Graph (y+2)29− (x+2)29= 1.

Answer

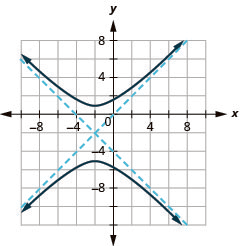
The graph shows the x-axis and y-axis that both run in the negative and positive directions, but at unlabeled intervals, with a center at (negative 2, negative 2), an asymptote that passes through (negative 5, negative 5) and (1, 1) and an asymptote that passes through (negative 5, 1) and (1, negative 5), and branches that pass through the vertices (negative 2, 1) and (negative 2, negative 5) and opens up and down.

Try It 11.61 §11.4 source ↗

ⓐ Write the equation in standard form and ⓑ graph 9x2− 16y2+ 18x+ 64y− 199= 0.

Answer

ⓐ (x+1)216− (y−2)29= 1
ⓑ

The graph shows the x-axis and y-axis that both run in the negative and positive directions, but at unlabeled intervals, with the center (negative 1, 2), an asymptote that passes through (negative 5, 5) and (3, negative 1) and an asymptote that passes through (3, 5) and (negative 5, negative 1), and branches that pass through the vertices (negative 5, 2) and (3, 2) and opens left and right.

Try It 11.62 §11.4 source ↗

ⓐ Write the equation in standard form and ⓑ graph 16x2− 25y2+ 96x− 50y− 281= 0.

Answer

ⓐ (x+3)225− (y+1)216= 1
ⓑ

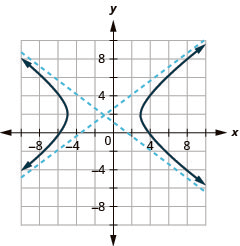
The graph shows the x-axis and y-axis that both run in the negative and positive directions, but at unlabeled intervals, with the center (negative 3, negative 1), an asymptote that passes through (negative 8, negative 5) and (2, 3) and an asymptote that passes through (negative 8, 3) and (2, negative 5), and branches that pass through the vertices (negative 8, negative 1) and (2, negative 1) and opens left and right.

Try It 11.63 §11.4 source ↗

Identify the graph of each equation as a circle, parabola, ellipse, or hyperbola.

ⓐ x2+ y2− 8x− 6y= 0 ⓑ 4x2+ 25y2= 100 ⓒ y=6x2+2x−1 ⓓ 16y2− 9x2= 144

Answer

ⓐ circle ⓑ ellipse ⓒ parabola ⓓ hyperbola

Try It 11.64 §11.4 source ↗

Identify the graph of each equation as a circle, parabola, ellipse, or hyperbola.

ⓐ 16x2+ 9y2= 144 ⓑ y=2x2+4x+6 ⓒ x2+ y2+ 2x+ 6y+ 9= 0 ⓓ 4x2−16y2=64

Answer

ⓐ ellipse ⓑ parabola ⓒ circle ⓓ hyperbola

11.4-147 §11.4 source ↗

Graph a Hyperbola with Center at (0,0)

In the following exercises, graph.

x 2 9 − y 2 4 = 1

Answer

The graph shows the x-axis and y-axis that both run in the negative and positive directions, but at unlabeled intervals, with asymptotes y is equal to plus or minus two-thirds times x, and branches that pass through the vertices (plus or minus 3, 0) and open left and right.

11.4-149 §11.4 source ↗

Graph a Hyperbola with Center at (0,0)

In the following exercises, graph.

x 2 16 − y 2 25 = 1

Answer

The graph shows the x-axis and y-axis that both run in the negative and positive directions with asymptotes y is equal to plus or minus five-fourths times x, and branches that pass through the vertices (plus or minus 4, 0) and open left and right.

11.4-151 §11.4 source ↗

Graph a Hyperbola with Center at (0,0)

In the following exercises, graph.

y 2 25 − x 2 4 = 1

Answer

The graph shows the x-axis and y-axis that both run in the negative and positive directions with asymptotes y is equal to plus or minus five-halves times x, and branches that pass through the vertices (0, plus or minus 5) and open up and down.

11.4-153 §11.4 source ↗

Graph a Hyperbola with Center at (0,0)

In the following exercises, graph.

16 y 2 − 9 x 2 = 144

Answer

The graph shows the x-axis and y-axis that both run in the negative and positive directions with asymptotes y is equal to plus or minus three-fourths times x, and branches that pass through the vertices (0, plus or minus 3) and open up and down.

11.4-155 §11.4 source ↗

Graph a Hyperbola with Center at (0,0)

In the following exercises, graph.

4 y 2 − 9 x 2 = 36

Answer

The graph shows the x-axis and y-axis that both run in the negative and positive directions with asymptotes y is equal to plus or minus three-halves times x, and branches that pass through the vertices (0, plus or minus 3) and open up and down.

11.4-157 §11.4 source ↗

Graph a Hyperbola with Center at (0,0)

In the following exercises, graph.

4 x 2 − 16 y 2 = 64

Answer

The graph shows the x-axis and y-axis that both run in the negative and positive directions with asymptotes y is equal to plus or minus one-half times x, and branches that pass through the vertices (plus or minus 4, 0) and open left and right.

11.4-159 §11.4 source ↗

Graph a Hyperbola with Center at (h,k)

In the following exercises, graph.

( x − 1 ) 2 16 − ( y − 3 ) 2 4 = 1

Answer

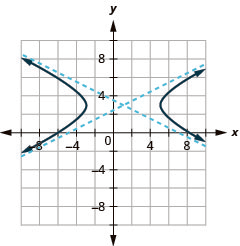
The graph shows the x-axis and y-axis that both run in the negative and positive directions with the center (1, 3) an asymptote that passes through (negative 3, 1) and (5, 5) and an asymptote that passes through (5, 1) and (negative 3, 5), and branches that pass through the vertices (negative 3, 3) and (5, 3) and opens left and right.

11.4-161 §11.4 source ↗

Graph a Hyperbola with Center at (h,k)

In the following exercises, graph.

( y − 4 ) 2 9 − ( x − 2 ) 2 25 = 1

Answer

The graph shows the x-axis and y-axis that both run in the negative and positive directions with the center (1, 3) an asymptote that passes through (negative 3, 1) and (5, 5) and an asymptote that passes through (5, 1) and (negative 3, 5), and branches that pass through the vertices (negative 3, 3) and (5, 3) and opens left and right.

11.4-163 §11.4 source ↗

Graph a Hyperbola with Center at (h,k)

In the following exercises, graph.

( y + 4 ) 2 25 − ( x + 1 ) 2 36 = 1

Answer

The graph shows the x-axis and y-axis that both run in the negative and positive directions with the center (1, negative 4) an asymptote that passes through (negative 7, 1) and (5, negative 9) and an asymptote that passes through (5, 1) and (negative 7, negative 9), and branches that pass through the vertices (1, 1) and (1, negative 9) and open up and down.

11.4-165 §11.4 source ↗

Graph a Hyperbola with Center at (h,k)

In the following exercises, graph.

( y − 4 ) 2 16 − ( x + 1 ) 2 25 = 1

Answer

The graph shows the x-axis and y-axis that both run in the negative and positive directions with the center (negative 1, 4) an asymptote that passes through (4, 8) and (negative 6, 0) and an asymptote that passes through (negative 6, 8) and (4, 0), and branches that pass through the vertices (negative 1, 0) and (negative 1, 8) and open up and down.

11.4-167 §11.4 source ↗

Graph a Hyperbola with Center at (h,k)

In the following exercises, graph.

( x − 3 ) 2 25 − ( y + 2 ) 2 9 = 1

Answer

The graph shows the x-axis and y-axis that both run in the negative and positive directions with the center (3, negative 2) an asymptote that passes through (8, 1) and (negative 2, negative 5) and an asymptote that passes through (negative 2, negative 1) and (8, negative 5), and branches that pass through the vertices (negative 2, negative 2) and (8, negative 2) and opens left and right.

11.4-169 §11.4 source ↗

In the following exercises, ⓐ write the equation in standard form and ⓑ graph.

9 x 2 − 4 y 2 − 18x+ 8y− 31= 0

Answer

ⓐ (x−1)24− (y−1)29= 1
ⓑ

The graph shows the x-axis and y-axis that both run in the negative and positive directions with the center (1, 1) an asymptote that passes through (3, 4) and (negative 1, negative 2) and an asymptote that passes through (negative 1, 4) and (3, negative 2), and branches that pass through the vertices (negative 1, 1) and (3, 1) and opens left and right.

11.4-171 §11.4 source ↗

In the following exercises, ⓐ write the equation in standard form and ⓑ graph.

y 2 − x 2 − 4y+ 2x− 6= 0

Answer

ⓐ (y−2)29− (x−1)29= 1
ⓑ

The graph shows the x-axis and y-axis that both run in the negative and positive directions with the center (1, 2) an asymptote that passes through (4, 5) and (negative 2, negative 1) and an asymptote that passes through (negative 2, 5) and (4, negative 1), and branches that pass through the vertices (1, 5) and (1, negative 1) and open up and down.

11.4-173 §11.4 source ↗

In the following exercises, ⓐ write the equation in standard form and ⓑ graph.

9 y 2 − x 2 + 18y− 4x− 4= 0

Answer

ⓐ (y+1)21− (x+2)29= 1
ⓑ

The graph shows the x-axis and y-axis that both run in the negative and positive directions with the center (negative 2, negative 1) an asymptote that passes through (1, 0) and (negative 5, negative 2) and an asymptote that passes through (3, 0) and (1, negative 2), and branches that pass through the vertices (negative 2, 0) and (negative 2, negative 2) and open up and down.

11.4-175 §11.4 source ↗

Identify the Graph of each Equation as a Circle, Parabola, Ellipse, or Hyperbola

In the following exercises, identify the type of graph.

ⓐ x= −2y2− 12y− 16 ⓑ x2+y2=9 ⓒ 16x2− 4y2+ 64x− 24y− 36= 0 ⓓ 16x2+ 36y2= 576

Answer

ⓐ parabola ⓑ circle ⓒ hyperbola ⓓ ellipse

11.4-177 §11.4 source ↗

Mixed Practice

In the following exercises, graph each equation.

x 2 + y 2 − 4x+ 10y− 7= 0

Answer

The graph shows the x y coordinate plane with a circle whose center is (2, negative 5) and whose radius is 6 units.

11.4-179 §11.4 source ↗

Mixed Practice

In the following exercises, graph each equation.

x 2 9 + y 2 25 = 1

Answer

The graph shows the x y coordinate plane with an ellipse whose major axis is vertical, vertices are (0, plus or minus 5) and co-vertices are (plus or minus 3, 0).

11.4-181 §11.4 source ↗

Mixed Practice

In the following exercises, graph each equation.

y 2 − x 2 − 4y+ 2x− 6= 0

Answer

The graph shows the x y coordinate plane with the center (1, 2) an asymptote that passes through (negative 2, 5) and (5, negative 1) and an asymptote that passes through (4, 5) and (2, 0), and branches that pass through the vertices (1, 5) and (negative 2, negative 1) and open up and down.

11.4-183 §11.4 source ↗

Mixed Practice

In the following exercises, graph each equation.

16 x 2 + 9 y 2 = 144

Answer

The graph shows the x y coordinate plane with an ellipse whose major axis is vertical, vertices are (0, plus or minus 4) and co-vertices are (plus or minus 3, 0).

11.4-185 §11.4 source ↗

Mixed Practice

In the following exercises, graph each equation.

Explain in your own words how to create and use the rectangle that helps graph a hyperbola.

Answer

Answers will vary.

11.4-187 §11.4 source ↗

Mixed Practice

In the following exercises, graph each equation.

Explain in your own words, how to distinguish the equation of an ellipse with the equation of a hyperbola.

Answer

Answers will vary.

Be Prepared 11.13 §11.5 source ↗

Solve the system by graphing: {x−3y=−3x+y=5.
If you missed this problem, review Example 4.2.
Example 4.2 in the book ↗

Answer

3 , 2

Be Prepared 11.14 §11.5 source ↗

Solve the system by substitution: {x−4y=−4−3x+4y=0.
If you missed this problem, review Example 4.7.
Example 4.7 in the book ↗

Answer

2 , 3 2

Be Prepared 11.15 §11.5 source ↗

Solve the system by elimination: {3x−4y=−95x+3y=14.
If you missed this problem, review Example 4.9.
Example 4.9 in the book ↗

Answer

1 , 3

Try It 11.65 §11.5 source ↗

Solve the system by graphing: {x+y=4y=x2+2.

Answer

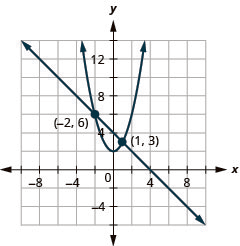
This graph shows the equations of a system, x plus y is equal to 4 and y is equal x squared plus 2, and the x y-coordinate plane. The line has a slope of negative 1 and a y-intercept at 4. The vertex of the parabola is (0, 2) and opens upward. The line and parabola intersect at the points (negative 2, 6) and (1, 3), which are labeled.

Try It 11.66 §11.5 source ↗

Solve the system by graphing: {x−y=−1y=−x2+3.

Answer

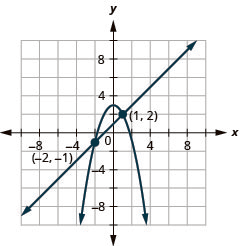
This graph shows the equations of a system, x minus y is equal to negative 1 and y is equal to negative x squared plus three, and the x y-coordinate plane. The line has a slope of 1 and a y-intercept at 1. The vertex of the parabola is (0, negative 3) and opens upward. The line and parabola intersect at the points (negative 2, negative 1) and (1, 2), which are labeled.

Try It 11.67 §11.5 source ↗

Solve the system by graphing: {x=−6(x+3)2+(y−1)2=9.

Answer

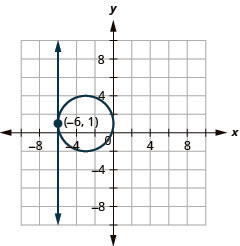
This graph shows the equations of a system, x is equal to negative 6 and the quantity x plus 3 squared plus the quantity y minus 1 squared is equal to 9, which is a circle, on the x y-coordinate plane. The line is a vertical line. The center of the circle is (negative 3, 1) and it has a radius of 3 units. The point of intersection between the line and circle is (negative 6, 1).

Try It 11.68 §11.5 source ↗

Solve the system by graphing: {y=4(x−2)2+(y+3)2=4.

Answer

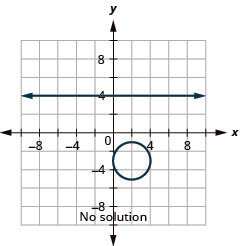
This graph shows the equations of a system, y is equal to negative 4 and the quantity x minus 2 squared plus the quantity y plus 3 squared is equal to 4, which is a circle, on the x y-coordinate plane. The line is a horizontal line. The center of the circle is (2, negative 3) and it has a radius of 2 units. There is no point of intersection between the line and circle, so the system has no solution.

Try It 11.69 §11.5 source ↗

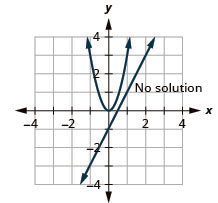
Solve the system by using substitution: {x2+9y2=9y=13x−3.

Answer

No solution

Try It 11.70 §11.5 source ↗

Solve the system by using substitution: {4x2+y2=4y=x+2.

Answer

(− 4 5 , 6 5 ), (0,2)

Try It 11.71 §11.5 source ↗

Solve the system by using substitution: {x2−y=0y=2x−3.

Answer

No solution

Try It 11.72 §11.5 source ↗

Solve the system by using substitution: {y2−x=0y=3x−2.

Answer

( 4 9 ,− 2 3 ), (1,1)

Try It 11.73 §11.5 source ↗

Solve the system by elimination: {x2+y2=9x2−y=9.

Answer

(−3,0), (3,0), (−2 2 ,−1), (2 2 ,−1)

Try It 11.74 §11.5 source ↗

Solve the system by elimination: {x2+y2=1−x+y2=1.

Answer

(−1,0), (0,1), (0,−1)

Try It 11.75 §11.5 source ↗

Solve the system by elimination: {x2+y2=25y2−x2=7.

Answer

(−3,−4), (−3,4), (3,−4), (3,4)

Try It 11.76 §11.5 source ↗

Solve the system by elimination: {x2+y2=4x2−y2=4.

Answer

(−2,0), (2,0)

Try It 11.77 §11.5 source ↗

The difference of the squares of two numbers is −20. The sum of the numbers is 10. Find the numbers.

Answer

4 and 6

Try It 11.78 §11.5 source ↗

The difference of the squares of two numbers is 35. The sum of the numbers is −1. Find the numbers.

Answer

−18 and 17

Try It 11.79 §11.5 source ↗

Edgar purchased a small 20” TV for his garage. The size of a TV is measured on the diagonal of the screen. The screen also has an area of 192 square inches. What are the length and width of the TV screen?

Answer

If the length is 12 inches, the width is 16 inches. If the length is 16 inches, the width is 12 inches.

Try It 11.80 §11.5 source ↗

The Harper family purchased a small microwave for their family room. The diagonal of the door measures 15 inches. The door also has an area of 108 square inches. What are the length and width of the microwave door?

Answer

If the length is 12 inches, the width is 9 inches. If the length is 9 inches, the width is 12 inches.

11.5-189 §11.5 source ↗

Solve a System of Nonlinear Equations Using Graphing

In the following exercises, solve the system of equations by using graphing.

{ y = 6 x − 4 y = 2 x 2

Answer

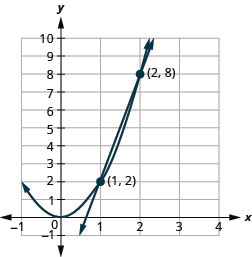
This graph shows the equations of a system, y is equal to 6 x minus 4 which is a line and y is equal to 2 x squared which is a parabola, on the x y-coordinate plane. The vertex of the parabola is (0, 0) and the parabola opens upward. The line has a slope of 6. The line and parabola intersect at the points (1, 2) and (2, 8), which are labeled. The solutions are (1, 2) and (2, 8).

11.5-191 §11.5 source ↗

Solve a System of Nonlinear Equations Using Graphing

In the following exercises, solve the system of equations by using graphing.

{ x − y = −2 x = y 2

Answer

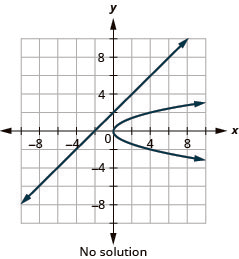
This graph shows the equations of a system, x minus y is equal to negative 2 which is a line and x is equal to y squared which is a rightward-opening parabola, on the x y-coordinate plane. The vertex of the parabola is (0, 0) and it passes through the points (1, 1) and (1, negative 1). The line has a slope of 1 and a y-intercept at 2. The line and parabola do not intersect, so the system has no solution.

11.5-193 §11.5 source ↗

Solve a System of Nonlinear Equations Using Graphing

In the following exercises, solve the system of equations by using graphing.

{ y = x − 1 y = x 2 + 1

Answer

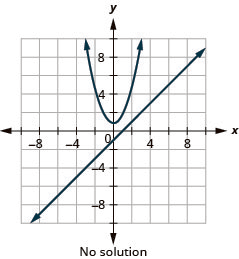
This graph shows the equations of a system, y is x minus 1 which is a line and y is equal to x squared plus 1 which is an upward-opening parabola, on the x y-coordinate plane. The vertex of the parabola is (0, 1) and it passes through the points (negative 1, 2) and (1, 2). The line has a slope of 1 and a y-intercept at negative 1. The line and parabola do not intersect, so the system has no solution.

11.5-195 §11.5 source ↗

Solve a System of Nonlinear Equations Using Graphing

In the following exercises, solve the system of equations by using graphing.

{ y = −4 x 2 + y 2 = 16

Answer

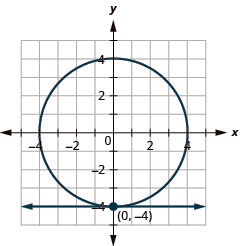
This graph shows the equations of a system, x is equal to negative 2 which is a line and x squared plus y squared is equal to 16 which is a circle, on the x y-coordinate plane. The line is horizontal. The center of the circle is (0, 0) and the radius of the circle is 4. The line and circle intersect at (negative 2, 0), so the solution of the system is (negative 2, 0).

11.5-197 §11.5 source ↗

Solve a System of Nonlinear Equations Using Graphing

In the following exercises, solve the system of equations by using graphing.

{ y = −1 ( x − 2 ) 2 + ( y − 4 ) 2 = 25

Answer

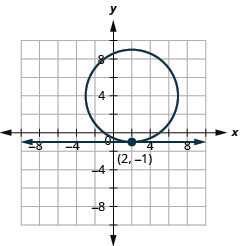
This graph shows the equations of a system, x is equal to 2 which is a line and the quantity x minus 2 end quantity squared plus the quantity y minus 4 end quantity squared is equal to 25 which is a circle, on the x y-coordinate plane. The line is horizontal. The center of the circle is (2, 4) and the radius of the circle is 5. The line and circle intersect at (2, negative 1), so the solution of the system is (2, negative 1).

11.5-199 §11.5 source ↗

Solve a System of Nonlinear Equations Using Graphing

In the following exercises, solve the system of equations by using graphing.

{ y = − 1 2 x + 2 y = x − 2

Answer

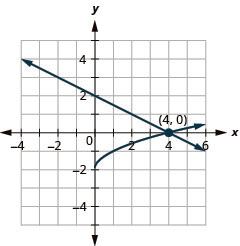
This graph shows the equations of a system, y is equal to negative one-half x plus 2 which is a line and the y is equal to the square root of x minus 2, on the x y-coordinate plane. The curve for y is equal to the square root of x minus 2 The curve for y is equal to the square root of x plus 1 where x is greater than or equal to 0 and y is greater than or equal to negative 2. The line and square root curve intersect at (4, 0), so the solution is (4, 0).

11.5-201 §11.5 source ↗

Solve a System of Nonlinear Equations Using Substitution

In the following exercises, solve the system of equations by using substitution.

{ 9 x 2 + y 2 = 9 y = 3 x + 3

Answer

(−1,0), (0,3)

11.5-203 §11.5 source ↗

Solve a System of Nonlinear Equations Using Substitution

In the following exercises, solve the system of equations by using substitution.

{ 9 x 2 + 4 y 2 = 36 x = 2

Answer

( 2 , 0 )

11.5-205 §11.5 source ↗

Solve a System of Nonlinear Equations Using Substitution

In the following exercises, solve the system of equations by using substitution.

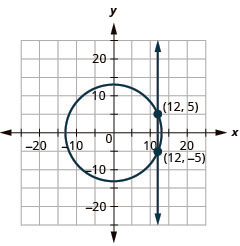
{ x 2 + y 2 = 169 x = 12

Answer

(12,−5), (12,5)

11.5-207 §11.5 source ↗

Solve a System of Nonlinear Equations Using Substitution

In the following exercises, solve the system of equations by using substitution.

{ 2 y 2 − x = 0 y = x + 1

Answer

No solution

11.5-209 §11.5 source ↗

Solve a System of Nonlinear Equations Using Substitution

In the following exercises, solve the system of equations by using substitution.

{ y = x 2 − 4 y = x − 4

Answer

(0,−4), (1,−3)

11.5-211 §11.5 source ↗

Solve a System of Nonlinear Equations Using Substitution

In the following exercises, solve the system of equations by using substitution.

{ x 2 + y 2 = 25 2 x + y = 10

Answer

( 3 , 4 ) , ( 5 , 0 )

11.5-213 §11.5 source ↗

Solve a System of Nonlinear Equations Using Elimination

In the following exercises, solve the system of equations by using elimination.

{ x 2 + y 2 = 16 x 2 − y = 4

Answer

(0,−4), (− 7 ,3), ( 7 ,3)

11.5-215 §11.5 source ↗

Solve a System of Nonlinear Equations Using Elimination

In the following exercises, solve the system of equations by using elimination.

{ x 2 + y 2 = 4 x 2 − y = 2

Answer

(0,−2), (− 3 ,1), ( 3 ,1)

11.5-217 §11.5 source ↗

Solve a System of Nonlinear Equations Using Elimination

In the following exercises, solve the system of equations by using elimination.

{ x 2 + y 2 = 4 y 2 − x = 2

Answer

(−2,0), (1,− 3 ), (1, 3 )

11.5-219 §11.5 source ↗

Solve a System of Nonlinear Equations Using Elimination

In the following exercises, solve the system of equations by using elimination.

{ x 2 + y 2 = 20 x 2 − y 2 = −12

Answer

(−2,−4), (−2,4), (2,−4), (2,4)

11.5-221 §11.5 source ↗

Solve a System of Nonlinear Equations Using Elimination

In the following exercises, solve the system of equations by using elimination.

{ x 2 + y 2 = 16 x 2 − y 2 = 16

Answer

(−4,0), (4,0)

11.5-223 §11.5 source ↗

Solve a System of Nonlinear Equations Using Elimination

In the following exercises, solve the system of equations by using elimination.

{ x 2 − y 2 = 3 2 x 2 + y 2 = 6

Answer

(− 3 ,0), ( 3 ,0)

11.5-225 §11.5 source ↗

Solve a System of Nonlinear Equations Using Elimination

In the following exercises, solve the system of equations by using elimination.

{ x 2 − y 2 = −5 3 x 2 + 2 y 2 = 30

Answer

(−2,−3), (−2,3), (2,−3), (2,3)

11.5-227 §11.5 source ↗

Solve a System of Nonlinear Equations Using Elimination

In the following exercises, solve the system of equations by using elimination.

{ 2 x 2 + y 2 = 11 x 2 + 3 y 2 = 28

Answer

(−1,−3), (−1,3), (1,−3), (1,3)

11.5-229 §11.5 source ↗

Use a System of Nonlinear Equations to Solve Applications

In the following exercises, solve the problem using a system of equations.

The sum of two numbers is 11 and the product is −42. Find the numbers.

Answer

−3 and 14

11.5-231 §11.5 source ↗

Use a System of Nonlinear Equations to Solve Applications

In the following exercises, solve the problem using a system of equations.

The sum of the squares of two numbers is 113. The difference of the numbers is 1. Find the numbers.

Answer

−7 and −8 or 8 and 7

11.5-233 §11.5 source ↗

Use a System of Nonlinear Equations to Solve Applications

In the following exercises, solve the problem using a system of equations.

The difference of the squares of two numbers is 20. The difference of the square of the first number and twice the square of the second number is 4. Find the numbers.

Answer

−6 and −4 or −6 and 4 or 6 and −4 or 6 and 4

11.5-235 §11.5 source ↗

Use a System of Nonlinear Equations to Solve Applications

In the following exercises, solve the problem using a system of equations.

The perimeter of a rectangle is 52 cm and its area is 165 cm2. Find the length and width of the rectangle.

Answer

If the length is 11 cm, the width is 15 cm. If the length is 15 cm, the width is 11 cm.

11.5-237 §11.5 source ↗

Use a System of Nonlinear Equations to Solve Applications

In the following exercises, solve the problem using a system of equations.

Jules purchased a microwave for his kitchen. The diagonal of the front of the microwave measures 26 inches. The front also has an area of 240 square inches. What are the length and width of the microwave?

Answer

If the length is 10 inches, the width is 24 inches. If the length is 24 inches, the width is 10 inches.

11.5-239 §11.5 source ↗

Use a System of Nonlinear Equations to Solve Applications

In the following exercises, solve the problem using a system of equations.

Donnette found a widescreen TV at a garage sale, but isn’t sure if it will fit her entertainment center. The TV is 50”. The size of a TV is measured on the diagonal of the screen and a widescreen has a length that is larger than the width. The screen also has an area of 1200 square inches. Her entertainment center has an insert for the TV with a length of 38 inches and width of 27 inches. What are the length and width of the TV screen and will it fit Donnette’s entertainment center?

Answer

The length is 40 inches and the width is 30 inches. The TV will not fit Donnette’s entertainment center.

11.5-241 §11.5 source ↗

Use a System of Nonlinear Equations to Solve Applications

In the following exercises, solve the problem using a system of equations.

Explain in your own words how to solve a system of equations using substitution.

Answer

Answers will vary.

11.5-243 §11.5 source ↗

Use a System of Nonlinear Equations to Solve Applications

In the following exercises, solve the problem using a system of equations.

A circle and a parabola can intersect in ways that would result in 0, 1, 2, 3, or 4 solutions. Draw a sketch of each of the possibilities.

Answer

Answers will vary.

11.R-245 §11.R source ↗

Use the Distance Formula

In the following exercises, find the distance between the points. Round to the nearest tenth if needed.

(−2,5) and (1,5)

Answer

d = 3

11.R-247 §11.R source ↗

Use the Distance Formula

In the following exercises, find the distance between the points. Round to the nearest tenth if needed.

(1,−4) and (5,−5)

Answer

d = 17 , d ≈ 4.1

11.R-249 §11.R source ↗

Use the Midpoint Formula

In the following exercises, find the midpoint of the line segment whose endpoints are given.

(3,7) and (5,1)

Answer

( 4 , 4 )

11.R-251 §11.R source ↗

Use the Midpoint Formula

In the following exercises, find the midpoint of the line segment whose endpoints are given.

(−3,2) and (6,−9)

Answer

( 3 2 , − 7 2 )

11.R-253 §11.R source ↗

Write the Equation of a Circle in Standard Form

In the following exercises, write the standard form of the equation of the circle with the given information.

radius is 7 and center is (0,0)

Answer

x 2 + y 2 = 7

11.R-255 §11.R source ↗

Write the Equation of a Circle in Standard Form

In the following exercises, write the standard form of the equation of the circle with the given information.

radius is 7 and center is (−2,−5)

Answer

( x + 2 ) 2 + ( y + 5 ) 2 = 49

11.R-257 §11.R source ↗

Write the Equation of a Circle in Standard Form

In the following exercises, write the standard form of the equation of the circle with the given information.

center is (2,2) and a point on the circle is (4,4)

Answer

( x − 2 ) 2 + ( y − 2 ) 2 = 8

11.R-259 §11.R source ↗

Graph a Circle

In the following exercises, ⓐ find the center and radius, then ⓑ graph each circle.

3 x 2 + 3 y 2 = 432

Answer

ⓐ radius: 12, center: (0,0)
ⓑ

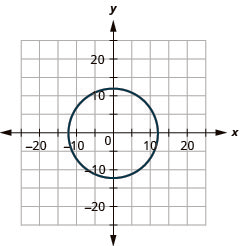
The figure shows a circle graphed on the x y coordinate plane. The x-axis of the plane runs from negative 20 to 20. The y-axis of the plane runs from negative 15 to 15. The center of the circle is (0, 0) and the radius of the circle is 12.

11.R-261 §11.R source ↗

Graph a Circle

In the following exercises, ⓐ find the center and radius, then ⓑ graph each circle.

( x + 2 ) 2 + ( y + 5 ) 2 = 49

Answer

ⓐ radius: 7, center: (−2,−5)
ⓑ

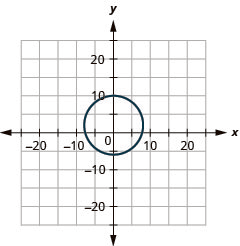
The figure shows a circle graphed on the x y coordinate plane. The x-axis of the plane runs from negative 20 to 20. The y-axis of the plane runs from negative 15 to 15. The center of the circle is (negative 2, negative 5) and the radius of the circle is 7.

11.R-263 §11.R source ↗

Graph a Circle

In the following exercises, ⓐ find the center and radius, then ⓑ graph each circle.

x 2 + y 2 − 4y− 60= 0

Answer

ⓐ radius: 8, center: (0,2)
ⓑ

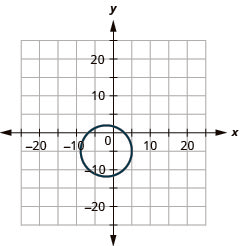
The figure shows a circle graphed on the x y coordinate plane. The x-axis of the plane runs from negative 20 to 20. The y-axis of the plane runs from negative 15 to 15. The center of the circle is (0, 2) and the radius of the circle is 8.

11.R-265 §11.R source ↗

Graph Vertical Parabolas

In the following exercises, graph each equation by using its properties.

y = 2 x 2 + 10 x + 7

Answer

The figure shows an upward-opening parabola graphed on the x y coordinate plane. The x-axis of the plane runs from negative 10 to 10. The y-axis of the plane runs from negative 7 to 7. The vertex is (negative five-halves, negative eleven-halves) and the parabola passes through the points (negative 4, negative 1) and (negative 1, negative 1).

11.R-267 §11.R source ↗

Graph Vertical Parabolas

In the following exercises, graph each equation by using its properties.

y = − x 2 + 10 x

Answer

The figure shows a downward-opening parabola graphed on the x y coordinate plane. The x-axis of the plane runs from negative 36 to 36. The y-axis of the plane runs from negative 26 to 26. The vertex is (5, 25) and the parabola passes through the points (2, 16) and (8, 16).

11.R-269 §11.R source ↗

In the following exercises, ⓐ write the equation in standard form, then ⓑ use properties of the standard form to graph the equation.

y = 2 x 2 − 4 x − 2

Answer

ⓐ y=2(x−1)2−4
ⓑ

The figure shows an upward-opening parabola graphed on the x y coordinate plane. The x-axis of the plane runs from negative 22 to 22. The y-axis of the plane runs from negative 16 to 16. The vertex is (1, negative 4) and the parabola passes through the points (0, negative 2) and (2, negative 2).

11.R-271 §11.R source ↗

In the following exercises, ⓐ write the equation in standard form, then ⓑ use properties of the standard form to graph the equation.

y= − x 2 + 12x− 35

Answer

ⓐ y=−(x−6)2+1
ⓑ

The figure shows a downward-opening parabola graphed on the x y coordinate plane. The x-axis of the plane runs from negative 60 to 60. The y-axis of the plane runs from negative 46 to 46. The vertex is (6, 1) and the parabola passes through the points (5, 0) and (7, 0).

11.R-273 §11.R source ↗

Graph Horizontal Parabolas

In the following exercises, graph each equation by using its properties.

x = 2 y 2 + 4 y + 6

Answer

The figure shows a rightward-opening parabola graphed on the x y coordinate plane. The x-axis of the plane runs from negative 10 to 10. The y-axis of the plane runs from negative 8 to 8. The vertex is (4, negative 1) and the parabola passes through the points (6, 0) and (6, negative 2).

11.R-275 §11.R source ↗

Graph Horizontal Parabolas

In the following exercises, graph each equation by using its properties.

x = −3 y 2

Answer

The figure shows a leftward-opening parabola graphed on the x y coordinate plane. The x-axis of the plane runs from negative 10 to 10. The y-axis of the plane runs from negative 8 to 8. The vertex is (0, 0) and the parabola passes through the points (negative 3, 1) and (negative 3, negative 1).

11.R-277 §11.R source ↗

In the following exercises, ⓐ write the equation in standard form, then ⓑ use properties of the standard form to graph the equation.

x = y 2 + 4 y + 5

Answer

ⓐ x=(y+2)2+1
ⓑ

The figure shows a rightward-opening parabola graphed on the x y coordinate plane. The x-axis of the plane runs from negative 10 to 10. The y-axis of the plane runs from negative 8 to 8. The vertex is (1, negative 2) and the parabola passes through the points (5, 0) and (5, negative 4).

11.R-279 §11.R source ↗

In the following exercises, ⓐ write the equation in standard form, then ⓑ use properties of the standard form to graph the equation.

x = −2 y 2 + 4 y

Answer

ⓐ x= −2(y−1)2+ 2
ⓑ

The figure shows a leftward-opening parabola graphed on the x y coordinate plane. The x-axis of the plane runs from negative 10 to 10. The y-axis of the plane runs from negative 8 to 8. The vertex is (2, negative 3) and the parabola passes through the points (0, 2) and (0, 0).

11.R-281 §11.R source ↗

Solve Applications with Parabolas

In the following exercises, create the equation of the parabolic arch formed in the foundation of the bridge shown. Give the answer in standard form.
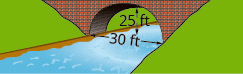
The figure shows a parabolic arch formed in the foundation of the bridge. The arch is 25 feet high and 30 feet wide.

Answer

y= − 1 9 x 2 + 10 3 x

11.R-283 §11.R source ↗

Graph an Ellipse with Center at the Origin

In the following exercises, graph each ellipse.

x 2 4 + y 2 81 = 1

Answer

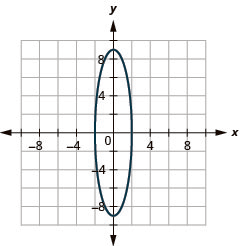
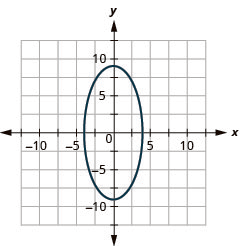
The figure shows an ellipse graphed on the x y coordinate plane. The x-axis of the plane runs from negative 14 to 14. The y-axis of the plane runs from negative 10 to 10. The ellipse has a center at (0, 0), a vertical major axis, vertices at (0, plus or minus 9), and co-vertices at (plus or minus 2, 0).

11.R-285 §11.R source ↗

Graph an Ellipse with Center at the Origin

In the following exercises, graph each ellipse.

9 x 2 + y 2 = 9

Answer

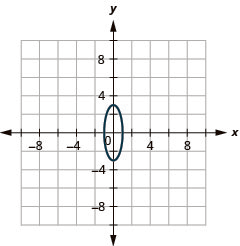
The figure shows an ellipse graphed on the x y coordinate plane. The x-axis of the plane runs from negative 9 to 9. The y-axis of the plane runs from negative 7 to 7. The ellipse has a center at (0, 0), a vertical major axis, vertices at (0, plus or minus 3), and co-vertices at (plus or minus 1, 0).

11.R-287 §11.R source ↗

Find the Equation of an Ellipse with Center at the Origin

In the following exercises, find the equation of the ellipse shown in the graph.
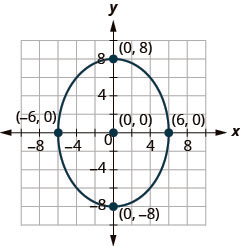
The figure shows an ellipse graphed on the x y coordinate plane. The ellipse has a center at (0, 0), a vertical major axis, vertices at (0, plus or minus 8), and co-vertices at (plus or minus 6, 0).

Answer

x 2 36 + y 2 64 = 1

11.R-289 §11.R source ↗

Graph an Ellipse with Center Not at the Origin

In the following exercises, graph each ellipse.

( x + 4 ) 2 16 + ( y + 1 ) 2 9 = 1

Answer

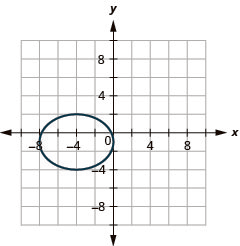
The figure shows an ellipse graphed on the x y coordinate plane. The x-axis of the plane runs from negative 14 to 14. The y-axis of the plane runs from negative 10 to 10. The ellipse has a center at (negative 4, negative 1), a horizontal major axis, vertices at (negative 8, negative 1) and (0, negative 1) and co-vertices at (negative 4, 2) and (negative 4, negative 4).

11.R-291 §11.R source ↗

Graph an Ellipse with Center Not at the Origin

In the following exercises, graph each ellipse.

( x + 3 ) 2 9 + ( y − 2 ) 2 25 = 1

Answer

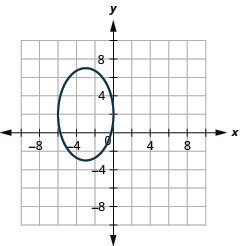
The figure shows an ellipse graphed on the x y coordinate plane. The x-axis of the plane runs from negative 14 to 14. The y-axis of the plane runs from negative 10 to 10. The ellipse has a center at (negative 3, 2), a vertical major axis, vertices at (negative 3, 7) and (negative 3, negative 3) and co-vertices at (negative 6, 2) and (0, 2).

11.R-293 §11.R source ↗

In the following exercises, ⓐ write the equation in standard form and ⓑ graph.

25 x 2 + 4 y 2 − 150x− 56y+ 321= 0

Answer

ⓐ (x−3)24+ (y−7)225= 1
ⓑ

The figure shows an ellipse graphed on the x y coordinate plane. The x-axis of the plane runs from negative 18 to 18. The y-axis of the plane runs from negative 14 to 14. The ellipse has a center at (3, 7), a vertical major axis, vertices at (3, 2) and (3, 12) and co-vertices at (negative 1, 7) and (5, 7).

11.R-295 §11.R source ↗

In the following exercises, ⓐ write the equation in standard form and ⓑ graph.

4 x 2 + 9 y 2 − 126y+ 405= 0

Answer

ⓐ x29+ (y−7)24= 1
ⓑ

The figure shows an ellipse graphed on the x y coordinate plane. The x-axis of the plane runs from negative 15 to 15. The y-axis of the plane runs from negative 11 to 11. The ellipse has a center at (0, 7), a horizontal major axis, vertices at (3, 7) and (negative 3, 7) and co-vertices at (0, 5) and (0, 9).

11.R-297 §11.R source ↗

Graph a Hyperbola with Center at (0,0)

In the following exercises, graph.

x 2 25 − y 2 9 = 1

Answer

The figure shows a hyperbola graphed on the x y coordinate plane. The x-axis of the plane runs from negative 12 to 12. The y-axis of the plane runs from negative 9 to 9. The hyperbola has a center at (0, 0) and branches that pass through the vertices (plus or minus 5, 0), and that open left and right.

11.R-299 §11.R source ↗

Graph a Hyperbola with Center at (0,0)

In the following exercises, graph.

9 y 2 − 16 x 2 = 144

Answer

The figure shows a hyperbola graphed on the x y coordinate plane. The x-axis of the plane runs from negative 19 to 19. The y-axis of the plane runs from negative 15 to 15. The hyperbola has a center at (0, 0) and branches that pass through the vertices (0, plus or minus 4), and that open up and down.

11.R-301 §11.R source ↗

Graph a Hyperbola with Center at (h,k)

In the following exercises, graph.

( x + 1 ) 2 4 − ( y + 1 ) 2 9 = 1

Answer

The figure shows a hyperbola graphed on the x y coordinate plane. The x-axis of the plane runs from negative 14 to 14. The y-axis of the plane runs from negative 10 to 10. The hyperbola has a center at (negative 1, negative 1) and branches that pass through the vertices (negative 3, negative 1) and (1, negative 1), and that open left and right.

11.R-303 §11.R source ↗

Graph a Hyperbola with Center at (h,k)

In the following exercises, graph.

( y + 2 ) 2 9 − ( x + 1 ) 2 9 = 1

Answer

The figure shows a hyperbola graphed on the x y coordinate plane. The x-axis of the plane runs from negative 14 to 14. The y-axis of the plane runs from negative 10 to 10. The hyperbola has a center at (negative 1, negative 2) and branches that pass through the vertices (negative 1, 1) and (negative 1, negative 5), and that open up and down.

11.R-305 §11.R source ↗

In the following exercises, ⓐ write the equation in standard form and ⓑ graph.

4 x 2 − 16 y 2 + 8x+ 96y− 204= 0

Answer

ⓐ (x+1)216− (y−3)24= 1
ⓑ

The figure shows a hyperbola graphed on the x y coordinate plane. The x-axis of the plane runs from negative 14 to 14. The y-axis of the plane runs from negative 10 to 10. The hyperbola has a center at (negative 1, 3) and branches that pass through the vertices (negative 5, 3) and (3, 3), and that open left and right.

11.R-307 §11.R source ↗

In the following exercises, ⓐ write the equation in standard form and ⓑ graph.

4 y 2 − 16 x 2 + 32x− 8y− 76= 0

Answer

ⓐ (y−1)216− (x−1)24= 1
ⓑ

The figure shows a hyperbola graphed on the x y coordinate plane. The x-axis of the plane runs from negative 14 to 14. The y-axis of the plane runs from negative 10 to 10. The hyperbola has a center at (1, 1) and branches that pass through the vertices (1, negative 3) and (1, 5), and that open up and down.

11.R-309 §11.R source ↗

Identify the Graph of each Equation as a Circle, Parabola, Ellipse, or Hyperbola

In the following exercises, identify the type of graph.


ⓐ 16y2− 9x2− 36x− 96y− 36= 0
ⓑ x2+ y2− 4x+ 10y− 7= 0
ⓒ y=x2−2x+3
ⓓ 25x2+ 9y2= 225

Answer

ⓐ hyperbola ⓑ circle ⓒ parabola ⓓ ellipse

11.R-311 §11.R source ↗

Solve a System of Nonlinear Equations Using Graphing

In the following exercises, solve the system of equations by using graphing.

{ 3 x 2 − y = 0 y = 2 x − 1

Answer

The figure shows a parabola and line graphed on the x y coordinate plane. The x-axis of the plane runs from negative 5 to 5. The y-axis of the plane runs from negative 4 to 4. The parabola has a vertex at (0, 0) and opens upward. The line has a slope of 2 with a y-intercept at negative 1. The parabola and line do not intersect, so the system has no solution.

11.R-313 §11.R source ↗

Solve a System of Nonlinear Equations Using Graphing

In the following exercises, solve the system of equations by using graphing.

{ x 2 + y 2 = 169 x = 12

Answer

The figure shows a circle and line graphed on the x y coordinate plane. The x-axis of the plane runs from negative 20 to 20. The y-axis of the plane runs from negative 15 to 15. The circle has a center at (0, 0) and a radius of 13. The line is vertical. The circle and line intersect at the points (12, 5) and (12, negative 5), which are labeled. The solution of the system is (12, 5) and (12, negative 5)

11.R-315 §11.R source ↗

Solve a System of Nonlinear Equations Using Substitution

In the following exercises, solve the system of equations by using substitution.

{ y = x 2 + 3 y = −2 x + 2

Answer

( −1 , 4 )

11.R-317 §11.R source ↗

Solve a System of Nonlinear Equations Using Substitution

In the following exercises, solve the system of equations by using substitution.

{ 9 x 2 + 4 y 2 = 36 y − x = 5

Answer

No solution

11.R-319 §11.R source ↗

Solve a System of Nonlinear Equations Using Elimination

In the following exercises, solve the system of equations by using elimination.

{ x 2 + y 2 = 16 x 2 − 2 y − 1 = 0

Answer

(− 7 ,3), ( 7 ,3)

11.R-321 §11.R source ↗

Solve a System of Nonlinear Equations Using Elimination

In the following exercises, solve the system of equations by using elimination.

{ 4 x 2 + 9 y 2 = 36 3 y 2 − 4 x = 12

Answer

(−3,0), (0,−2), (0,2)

11.R-323 §11.R source ↗

Use a System of Nonlinear Equations to Solve Applications

In the following exercises, solve the problem using a system of equations.

The sum of the squares of two numbers is 25. The difference of the numbers is 1. Find the numbers.

Answer

−3 and −4 or 4 and 3

11.R-325 §11.R source ↗

Use a System of Nonlinear Equations to Solve Applications

In the following exercises, solve the problem using a system of equations.

The perimeter of a rectangle is 58 meters and its area is 210 square meters. Find the length and width of the rectangle.

Answer

If the length is 14 inches, the width is 15 inches. If the length is 15 inches, the width is 14 inches.

11.T-327 §11.T source ↗

In the following exercises, find the distance between the points and the midpoint of the line segment with the given endpoints. Round to the nearest tenth as needed.

(−4,−3) and (−10,−11)

Answer

distance: 10, midpoint: (−7,−7)

11.T-329 §11.T source ↗

In the following exercises, write the standard form of the equation of the circle with the given information.

radius is 11 and center is (0,0)

Answer

x 2 + y 2 = 121

11.T-331 §11.T source ↗

In the following exercises, write the standard form of the equation of the circle with the given information.

center is (−2,3) and a point on the circle is (2,−3)

Answer

( x + 2 ) 2 + ( y − 3 ) 2 = 52

11.T-333 §11.T source ↗

In the following exercises, ⓐ identify the type of graph of each equation as a circle, parabola, ellipse, or hyperbola, and ⓑ graph the equation.

4 x 2 + 49 y 2 = 196

Answer

ⓐ ellipse
ⓑ

The figure shows an ellipse graphed on the x y coordinate plane. The x-axis of the plane runs from negative 10 to 10. The y-axis of the plane runs from negative 8 to 8. The ellipse has a center at (0, 0), a horizontal major axis, vertices at (plus or minus 7, 0) and co-vertices at (0, plus or minus 2).

11.T-335 §11.T source ↗

In the following exercises, ⓐ identify the type of graph of each equation as a circle, parabola, ellipse, or hyperbola, and ⓑ graph the equation.

3 x 2 + 3 y 2 = 27

Answer

ⓐ circle
ⓑ

The figure shows a circle graphed on the x y coordinate plane. The x-axis of the plane runs from negative 10 to 10. The y-axis of the plane runs from negative 8 to 8. The parabola circle has a center at (0, 0) and a radius of 3.

11.T-337 §11.T source ↗

In the following exercises, ⓐ identify the type of graph of each equation as a circle, parabola, ellipse, or hyperbola, and ⓑ graph the equation.

x 2 16 + y 2 81 = 1

Answer

ⓐ ellipse
ⓑ

The figure shows an ellipse graphed on the x y coordinate plane. The x-axis of the plane runs from negative 14 to 14. The y-axis of the plane runs from negative 10 to 10. The ellipse has a center at (0, 0), a vertical major axis, vertices at (0, plus or minus 9) and co-vertices at (plus or minus 4, 0).

11.T-339 §11.T source ↗

In the following exercises, ⓐ identify the type of graph of each equation as a circle, parabola, ellipse, or hyperbola, and ⓑ graph the equation.

64 x 2 − 9 y 2 = 576

Answer

ⓐ hyperbola
ⓑ

The figure shows a hyperbola graphed on the x y coordinate plane. The x-axis of the plane runs from negative 10 to 10. The y-axis of the plane runs from negative 8 to 8. The hyperbola has a center at (0, 0) and branches that pass through the vertices (plus or minus 3, 0) and that open left and right.

11.T-341 §11.T source ↗

In the following exercises, ⓐ identify the type of graph of each equation as a circle, parabola, ellipse, or hyperbola, ⓑ write the equation in standard form, and ⓒ graph the equation.

x 2 + y 2 + 10x+ 6y+ 30= 0

Answer

ⓐ circle
ⓑ (x+5)2+ (y+3)2= 4
ⓒ

The figure shows a circle graphed on the x y coordinate plane. The x-axis of the plane runs from negative 14 to 14. The y-axis of the plane runs from negative 10 to 10. The circle has a center at (negative 5, negative 3) and a radius 2.

11.T-343 §11.T source ↗

In the following exercises, ⓐ identify the type of graph of each equation as a circle, parabola, ellipse, or hyperbola, ⓑ write the equation in standard form, and ⓒ graph the equation.

9 x 2 − 25 y 2 − 36x− 50y− 214= 0

Answer

ⓐ hyperbola
ⓑ (x−2)225− (y+1)29= 1
ⓒ

The figure shows a hyperbola graphed on the x y coordinate plane. The x-axis of the plane runs from negative 14 to 14. The y-axis of the plane runs from negative 10 to 10. The hyperbola has a center at (2, negative 1) and branches that pass through the vertices (negative 3, negative 1) and (7, negative 1) that open left and right.

11.T-345 §11.T source ↗

In the following exercises, ⓐ identify the type of graph of each equation as a circle, parabola, ellipse, or hyperbola, ⓑ write the equation in standard form, and ⓒ graph the equation.

Solve the nonlinear system of equations by graphing:
{3y2−x=0y=−2x−1.

Answer

No solution

A graph displays a downward-sloping line and a parabola opening to the right, both intersecting at the origin (0,0) on a Cartesian coordinate system.

11.T-347 §11.T source ↗

In the following exercises, ⓐ identify the type of graph of each equation as a circle, parabola, ellipse, or hyperbola, ⓑ write the equation in standard form, and ⓒ graph the equation.

Solve the nonlinear system of equations using elimination:
{x2+9y2=92x2−9y2=18.

Answer

(3,0), (−3,0)

11.T-349 §11.T source ↗

In the following exercises, ⓐ identify the type of graph of each equation as a circle, parabola, ellipse, or hyperbola, ⓑ write the equation in standard form, and ⓒ graph the equation.

A comet moves in an elliptical orbit around a sun. The closest the comet gets to the sun is approximately 20 AU and the furthest is approximately 70 AU. The sun is one of the foci of the elliptical orbit. Letting the ellipse center at the origin and labeling the axes in AU, the orbit will look like the figure below. Use the graph to write an equation for the elliptical orbit of the comet.
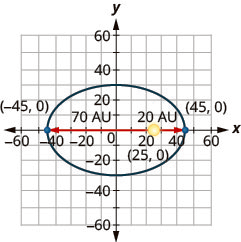
The figure shows a model of an elliptical orbit around the sun on the x y coordinate plane. The ellipse has a center at (0, 0), a horizontal major axis, vertices marked at (plus or minus 45, 0), the sun marked as a foci and labeled (25, 0), the closest distance the comet is from the sun marked as 20 A U, and the farthest a comet is from the sun marked as 70 A U.

Answer

x 2 2025 + y 2 1400 = 1

11.T-351 §11.T source ↗

In the following exercises, ⓐ identify the type of graph of each equation as a circle, parabola, ellipse, or hyperbola, ⓑ write the equation in standard form, and ⓒ graph the equation.

For her birthday, Olive’s grandparents bought her a new widescreen TV. Before opening it she wants to make sure it will fit her entertainment center. The TV is 55”. The size of a TV is measured on the diagonal of the screen and a widescreen has a length that is larger than the width. The screen also has an area of 1452 square inches. Her entertainment center has an insert for the TV with a length of 50 inches and width of 40 inches. What are the length and width of the TV screen and will it fit Olive’s entertainment center?

Answer

The length is 44 inches and the width is 33 inches. The TV will fit Olive’s entertainment center.

Loading chapter 12…

Problems and answers are adapted from Intermediate Algebra 2e by Lynn Marecek and Andrea Honeycutt Mathis, OpenStax, and are used under the CC BY-NC-SA 4.0 licence. Access for free at https://openstax.org/books/intermediate-algebra-2e/pages/1-introduction. Illustrations: Copyright Rice University, OpenStax, under CC BY-NC-SA 4.0 license. This adaptation is released under the same licence, is non-commercial, and is neither affiliated with nor endorsed by OpenStax or Rice University.