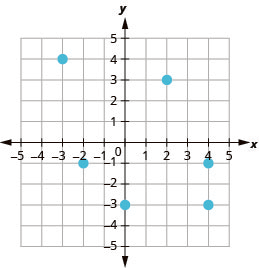
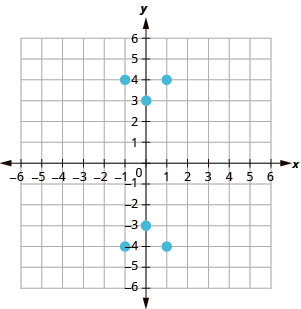
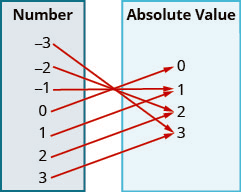
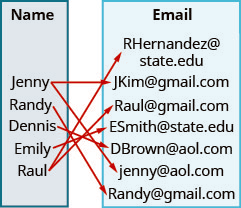
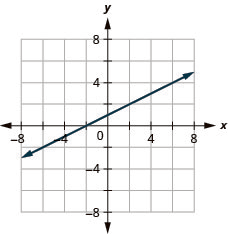
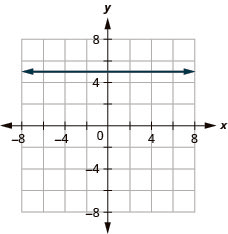
Every problem in the chapter beside the book’s answer, a chapter at a time as you scroll.

Chapter 3: Graphs and Functions

413 problems · 242 figures

Be Prepared 3.1 §3.1 source ↗

Evaluate 5x−4 when x=−1.
If you missed this problem, review Example 1.6.
Example 1.6 in the book ↗

Answer

− 9

Be Prepared 3.2 §3.1 source ↗

Evaluate 3x−2y when x=4,y=−3.
If you missed this problem, review Example 1.21.
Example 1.21 in the book ↗

Answer

18

Be Prepared 3.3 §3.1 source ↗

Solve for y: 8−3y=20.
If you missed this problem, review Example 2.2.
Example 2.2 in the book ↗

Answer

y = − 4

Try It 3.1 §3.1 source ↗

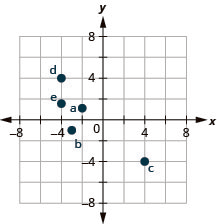
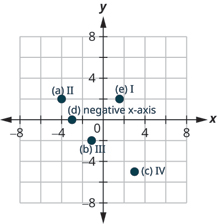
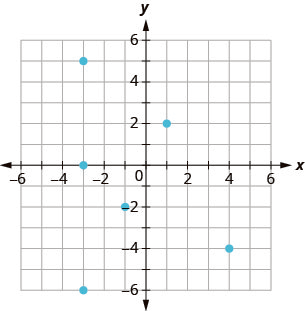
Plot each point in a rectangular coordinate system and identify the quadrant in which the point is located:
ⓐ (−2,1) ⓑ (−3,−1) ⓒ (4,−4) ⓓ (−4,4) ⓔ (−4,32)

Answer

This figure shows points plotted on the x y-coordinate plane. The x and y axes run from negative 6 to 6. The point labeled a is 2 units to the left of the origin and 1 unit above the origin and is located in quadrant II. The point labeled b is 3 units to the left of the origin and 1 unit below the origin and is located in quadrant III. The point labeled c is 4 units to the right of the origin and 4 units below the origin and is located in quadrant IV. The point labeled d is 4 units to the left of the origin and 4 units above the origin and is located in quadrant II. The point labeled e is 4 units to the left of the origin and 1 and a half units above the origin and is located in quadrant II.

Try It 3.2 §3.1 source ↗

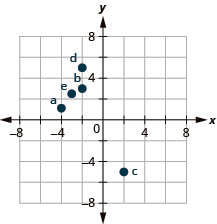
Plot each point in a rectangular coordinate system and identify the quadrant in which the point is located:
ⓐ (−4,1) ⓑ (−2,3) ⓒ (2,−5) ⓓ (−2,5) ⓔ (−3,52)

Answer

This figure shows points plotted on the x y-coordinate plane. The x and y axes run from negative 6 to 6. The point labeled a is 4 units to the left of the origin and 1 unit above the origin and is located in quadrant II. The point labeled b is 2 units to the left of the origin and 3 units above the origin and is located in quadrant II. The point labeled c is 2 units to the right of the origin and 5 units below the origin and is located in quadrant IV. The point labeled d is 2 units to the left of the origin and 5 units above the origin and is located in quadrant II. The point labeled e is 3 units to the left of the origin and 2 and a half units above the origin and is located in quadrant II.

Try It 3.3 §3.1 source ↗

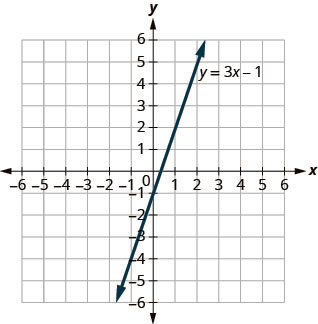
Use graph of y=3x−1. For each ordered pair, decide:

ⓐ Is the ordered pair a solution to the equation?
ⓑ Is the point on the line?

A (0,−1) B (2,5)

This figure shows a straight line graphed on the x y-coordinate plane. The x and y-axes run from negative 10 to 10. The line has arrows on both ends and goes through the points (negative 3, negative 10), (negative 2, negative 7), (negative 1, negative 4), (0, negative 1), (1, 2), (2, 5), and (3, 8). The line is labeled y plus 3 x minus 1.

Answer

ⓐ yes, yes ⓑ yes, yes

Try It 3.4 §3.1 source ↗

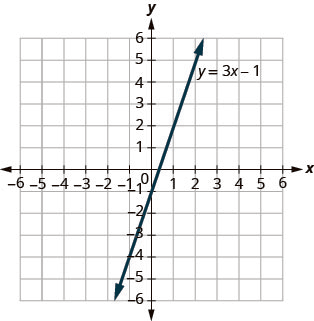
Use graph of y=3x−1. For each ordered pair, decide:

ⓐ Is the ordered pair a solution to the equation?
ⓑ Is the point on the line?

A(3,−1) B(−1,−4)

This figure shows a straight line graphed on the x y-coordinate plane. The x and y-axes run from negative 10 to 10. The line has arrows on both ends and goes through the points (negative 3, negative 10), (negative 2, negative 7), (negative 1, negative 4), (0, negative 1), (1, 2), (2, 5), and (3, 8). The line is labeled y plus 3 x minus 1.

Answer

ⓐ no, no ⓑ yes, yes

Try It 3.5 §3.1 source ↗

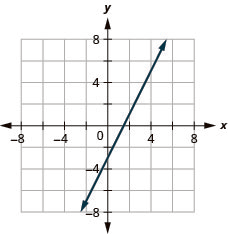
Graph the equation by plotting points: y=2x−3.

Answer


This figure shows a straight line graphed on the x y-coordinate plane. The x and y-axes run from negative 8 to 8. The line goes through the points (negative 2, negative 7), (negative 1, negative 5), (0, negative 3), (1, negative 1), (2, 1), (3, 3), (4, 5), and (5, 7).

Try It 3.6 §3.1 source ↗

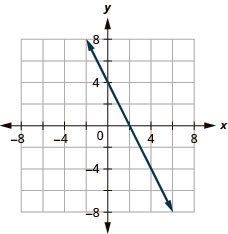
Graph the equation by plotting points: y=−2x+4.

Answer


This figure shows a straight line graphed on the x y-coordinate plane. The x and y-axes run from negative 8 to 8. The line goes through the points (negative 2, 8), (negative 1, 6), (0, 4), (1, 2), (2, 0), (3, negative 2), (4, negative 4), (5, negative 6) and (6, negative 8).

Try It 3.7 §3.1 source ↗

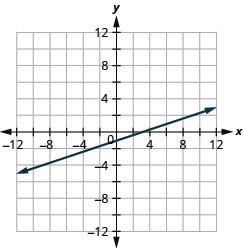
Graph the equation: y=13x−1.

Answer


This figure shows a straight line graphed on the x y-coordinate plane. The x and y-axes run from negative 12 to 12. The line goes through the points (negative 12, negative 5), (negative 9, negative 4), (negative 6, negative 3), (negative 3, negative 2), (0, negative 1), (3, 0), (6, 1), (9, 2), and (12, 3).

Try It 3.8 §3.1 source ↗

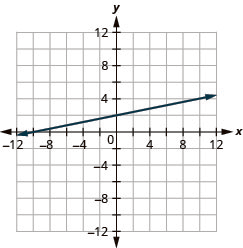
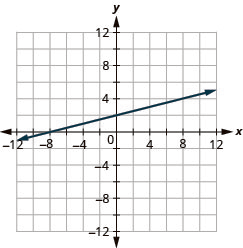
Graph the equation: y=14x+2.

Answer


This figure shows a straight line graphed on the x y-coordinate plane. The x and y-axes run from negative 12 to 12. The line goes through the points (negative 12, negative 1), (negative 8, 0), (negative 4, 1), (0, 2), (4, 3), (8, 4), and (12, 5).

Try It 3.9 §3.1 source ↗

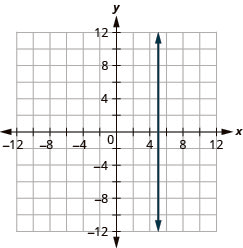
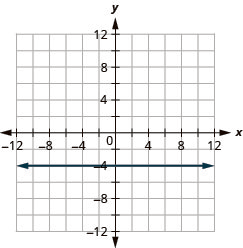
Graph the equations: ⓐ x=5 ⓑ y=−4.

Answer

ⓐ

The figure shows the graph of a straight vertical line on the x y-coordinate plane. The x and y axes run from negative 12 to 12. The line goes through the points (5, negative 3), (5, negative 2), (5, negative 1), (5, 0), (5, 1), (5, 2), and (5, 3).


ⓑ

The figure shows the graph of a straight horizontal line on the x y-coordinate plane. The x and y axes run from negative 12 to 12. The line goes through the points (negative 3, negative 4), (negative 2, negative 4), (negative 1, negative 4), (0, negative 4), (1, negative 4), (2, negative 4), and (3, negative 4).

Try It 3.10 §3.1 source ↗

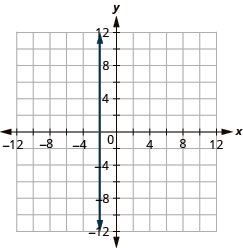
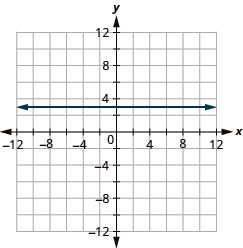
Graph the equations: ⓐ x=−2 ⓑ y=3.

Answer

ⓐ

The figure shows the graph of a straight vertical line on the x y-coordinate plane. The x and y axes run from negative 12 to 12. The line goes through the points (negative 2, negative 3), (negative 2, negative 2), (negative 2, negative 1), (negative 2, 0), (negative 2, 1), (negative 2, 2), and (negative 2, 3).


ⓑ

The figure shows the graph of a straight horizontal line on the x y-coordinate plane. The x and y axes run from negative 12 to 12. The line goes through the points (negative 3, 3), (negative 2, 3), (negative 1, 3), (0, 3), (1, 3), (2, 3), and (3, 3).

Try It 3.11 §3.1 source ↗

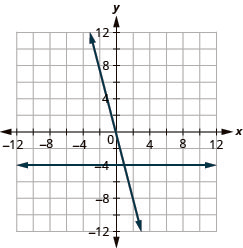
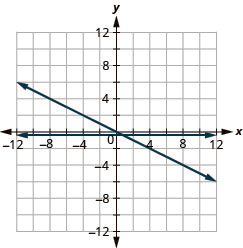
Graph the equations in the same rectangular coordinate system: y=−4x and y=−4.

Answer


The figure shows the graphs of a straight horizontal line and a straight slanted line on the same x y-coordinate plane. The x and y axes run from negative 12 to 12. The horizontal line goes through the points (0, negative 4), (1, negative 4), and (2, negative 4). The slanted line goes through the points (0, 0), (1, negative 4), and (2, negative 8).

Try It 3.12 §3.1 source ↗

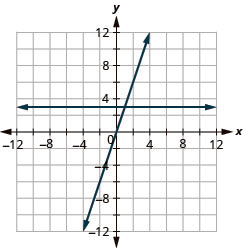
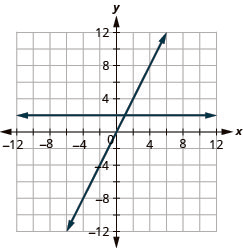
Graph the equations in the same rectangular coordinate system: y=3 and y=3x.

Answer


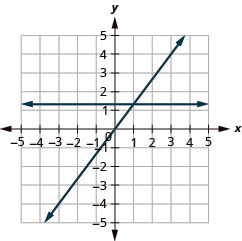
The figure shows the graphs of a straight horizontal line and a straight slanted line on the same x y-coordinate plane. The x and y axes run from negative 12 to 12. The horizontal line goes through the points (0, 3), (1, 3), and (2, 3). The slanted line goes through the points (0, 0), (1, 3), and (2, 6).

Try It 3.13 §3.1 source ↗

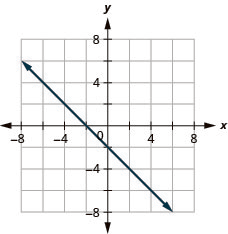
Find the x- and y-intercepts on the graph.
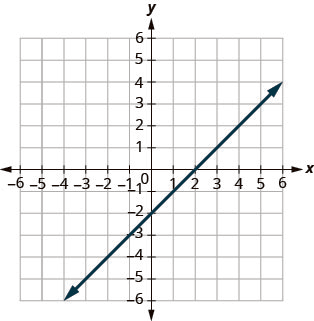
This figure a shows a straight line graphed on the x y-coordinate plane. The x and y axes run from negative 10 to 10. The line goes through the points (negative 6, negative 8), (negative 4, negative 6), (negative 2, negative 4), (0, negative 2), (2, 0), (4, 2), (6, 4), (8, 6).

Answer

x-intercept: (2,0),
y-intercept: (0,−2)

Try It 3.14 §3.1 source ↗

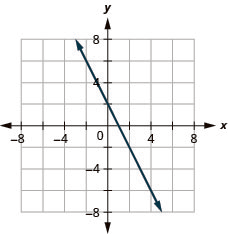
Find the x- and y-intercepts on the graph.
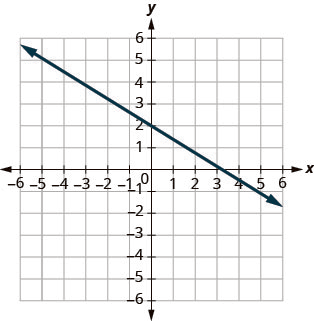
This figure a shows a straight line graphed on the x y-coordinate plane. The x and y axes run from negative 10 to 10. The line goes through the points (negative 6, 6), (negative 3, 4), (0, 2), (3, 0), (6, negative 2), and (9, negative 4).

Answer

x-intercept: (3,0),
y-intercept: (0,2)

Try It 3.15 §3.1 source ↗

Find the intercepts: 3x+y=12.

Answer

x-intercept: (4,0),
y-intercept: (0,12)

Try It 3.16 §3.1 source ↗

Find the intercepts: x+4y=8.

Answer

x-intercept: (8,0),
y-intercept: (0,2)

Try It 3.17 §3.1 source ↗

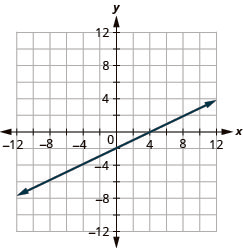
Graph using the intercepts: x–2y=4.

Answer

The figure shows a graph of a straight line on the x y-coordinate plane. The x and y-axes run from negative 12 to 12. The straight line goes through the points (negative 4, negative 4), (negative 2, negative 3), (0, negative 2), (2, negative 1), (4, 0), (6, 1), and (8, 2).

Try It 3.18 §3.1 source ↗

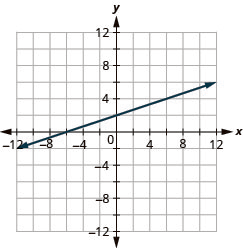
Graph using the intercepts: –x+3y=6.

Answer


The figure shows a graph of a straight line on the x y-coordinate plane. The x and y-axes run from negative 12 to 12. The straight line goes through the points (negative 9, negative 1), (negative 6, 0), (negative 3, 1), (0, 2), (3, 3), (6, 4), and (9, 5).

Try It 3.19 §3.1 source ↗

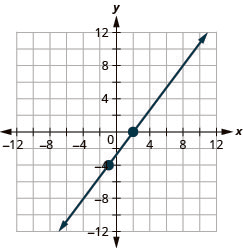
Graph using the intercepts: 5x−2y=10.

Answer


The figure shows a graph of a straight line on the x y-coordinate plane. The x and y-axes run from negative 8 to 8. The straight line goes through the points (0, negative 5), (2, 0), and (4, 5).

Try It 3.20 §3.1 source ↗

Graph using the intercepts: 3x−4y=12.

Answer


The figure shows a graph of a straight line on the x y-coordinate plane. The x and y-axes run from negative 8 to 8. The straight line goes through the points (negative 4, negative 6), (0, negative 3), (4, 0), and (8, 3).

Try It 3.21 §3.1 source ↗

Graph using the intercepts: y=4x.

Answer


The figure shows a graph of a straight line on the x y-coordinate plane. The x and y-axes run from negative 12 to 12. The straight line goes through the points (negative 1, negative 4), (0, 0), and (1, 4).

Try It 3.22 §3.1 source ↗

Graph the intercepts: y=−x.

Answer


The figure shows a graph of a straight line on the x y-coordinate plane. The x and y-axes run from negative 12 to 12. The straight line goes through the points (negative 1, 1), (0, 0), and (1, negative 1).

3.1-1 §3.1 source ↗

Plot Points in a Rectangular Coordinate System

In the following exercises, plot each point in a rectangular coordinate system and identify the quadrant in which the point is located.

ⓐ (−4,2) ⓑ (−1,−2) ⓒ (3,−5) ⓓ (−3,0) ⓔ (53,2)

Answer

This figure shows points plotted on the x y-coordinate plane. The x and y axes run from negative 6 to 6. The point labeled a is 4 units to the left of the origin and 2 units above the origin and is located in quadrant II. The point labeled b is 1 unit to the left of the origin and 2 units below the origin and is located in quadrant III. The point labeled c is 3 units to the right of the origin and 5 units below the origin and is located in quadrant IV. The point labeled d is 3 units to the left of the origin and 5 units above the origin and is located in quadrant II. The point labeled e is 1 and a half units to the right of the origin and 2 units above the origin and is located in quadrant I.

3.1-3 §3.1 source ↗

Plot Points in a Rectangular Coordinate System

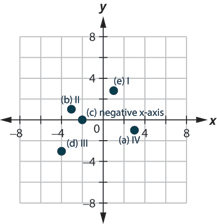
In the following exercises, plot each point in a rectangular coordinate system and identify the quadrant in which the point is located.

ⓐ (3,−1) ⓑ (−3,1) ⓒ (−2,0) ⓓ (−4,−3) ⓔ (1,145)

Answer

This figure shows points plotted on the x y-coordinate plane. The x and y axes run from negative 6 to 6. The point labeled a is 3 units to the right of the origin and 1 unit below the origin and is located in quadrant IV. The point labeled b is 3 units to the left of the origin and 1 unit above the origin and is located in quadrant II. The point labeled c is 2 units to the left of the origin and 2 units above the origin and is located in quadrant II. The point labeled d is 4 units to the left of the origin and 3 units below the origin and is located in quadrant III. The point labeled e is 1 unit to the right of the origin and 3 and 4 fifths units above the origin and is located in quadrant I.

3.1-5 §3.1 source ↗

In the following exercises, for each ordered pair, decide

ⓐ is the ordered pair a solution to the equation? ⓑ is the point on the line?

y=x+2;
A: (0,2); B: (1,2); C: (−1,1); D: (−3,−1).

This figure shows a straight line graphed on the x y-coordinate plane. The x and y-axes run from negative 8 to 8. The line goes through the points (negative 3, negative 1), (negative 2, 0), (negative 1, 1), (0, 2), (1, 3), (2, 4), and (3, 5).

Answer

ⓐ A: yes, B: no, C: yes, D: yes ⓑ A: yes, B: no, C: yes, D: yes

3.1-7 §3.1 source ↗

In the following exercises, for each ordered pair, decide

ⓐ is the ordered pair a solution to the equation? ⓑ is the point on the line?

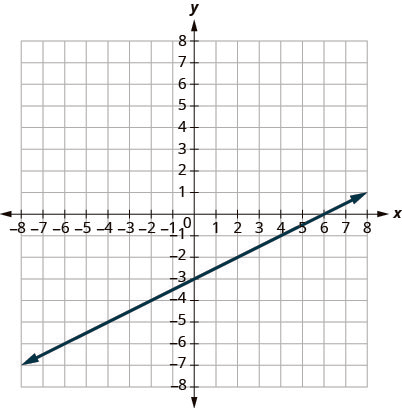
y=12x−3;
A: (0,−3); B: (2,−2); C: (−2,−4); D: (4,1)

This figure shows a straight line graphed on the x y-coordinate plane. The x and y-axes run from negative 8 to 8. The line goes through the points (negative 4, negative 5), (negative 2, negative 4), (0, negative 3), (2, negative 2), (4, negative 1), and (6, 0).

Answer

ⓐ A: yes, B: yes, C: yes, D: no ⓑ A: yes, B: yes, C: yes, D: no

3.1-9 §3.1 source ↗

Graph a Linear Equation by Plotting Points

In the following exercises, graph by plotting points.

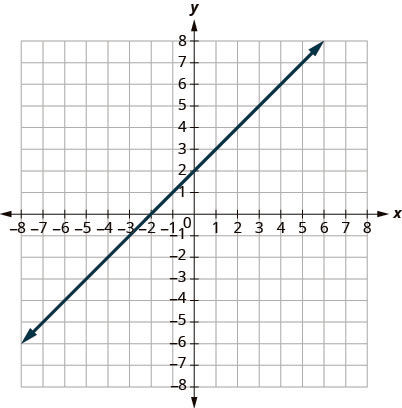
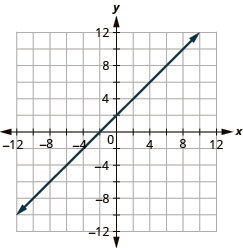
y = x + 2

Answer

This figure shows a straight line graphed on the x y-coordinate plane. The x and y-axes run from negative 12 to 12. The line goes through the points (negative 3, negative 1), (negative 2, 0), (negative 1, 1), (0, 2), (1, 3), (2, 4), and (3, 5).

3.1-11 §3.1 source ↗

Graph a Linear Equation by Plotting Points

In the following exercises, graph by plotting points.

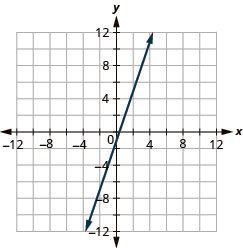
y = 3 x − 1

Answer

This figure shows a straight line graphed on the x y-coordinate plane. The x and y-axes run from negative 12 to 12. The line goes through the points (negative 3, negative 10), (negative 2, negative 7), (negative 1, negative 4), (0, negative 1), (1, 2), (2, 5), (3, 8), and (4, 11).

3.1-13 §3.1 source ↗

Graph a Linear Equation by Plotting Points

In the following exercises, graph by plotting points.

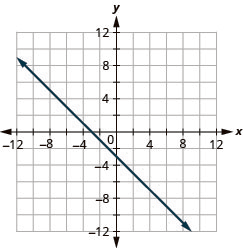
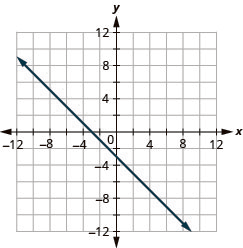
y = − x − 3

Answer

This figure shows a straight line graphed on the x y-coordinate plane. The x and y-axes run from negative 12 to 12. The line goes through the points (negative 3, 0), (negative 2, negative 1), (negative 1, negative 2), (0, negative 3), (1, negative 4), (2, negative 5), (3, negative 6), and (4, negative 7).

3.1-15 §3.1 source ↗

Graph a Linear Equation by Plotting Points

In the following exercises, graph by plotting points.

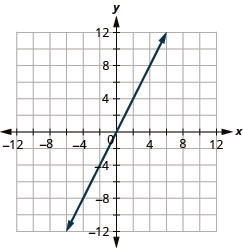
y = 2 x

Answer

This figure shows a straight line graphed on the x y-coordinate plane. The x and y-axes run from negative 12 to 12. The line goes through the points (negative 3, negative 6), (negative 2, negative 4), (negative 1, negative 2), (0, 0), (1, 2), (2, 4), and (3, 6).

3.1-17 §3.1 source ↗

Graph a Linear Equation by Plotting Points

In the following exercises, graph by plotting points.

y = 1 2 x + 2

Answer

This figure shows a straight line graphed on the x y-coordinate plane. The x and y-axes run from negative 12 to 12. The line goes through the points (negative 6, negative 2), (negative 4, 0), (negative 2, 1), (0, 2), (2, 3), (4, 4), and (6, 5).

3.1-19 §3.1 source ↗

Graph a Linear Equation by Plotting Points

In the following exercises, graph by plotting points.

y = 4 3 x − 5

Answer

This figure shows a straight line graphed on the x y-coordinate plane. The x and y-axes run from negative 12 to 12. The line goes through the points (negative 3, negative 9), (0, negative 5), (3, negative 1), (6, 3), and (9, 7).

3.1-21 §3.1 source ↗

Graph a Linear Equation by Plotting Points

In the following exercises, graph by plotting points.

y = − 2 5 x + 1

Answer

This figure shows a straight line graphed on the x y-coordinate plane. The x and y-axes run from negative 12 to 12. The line goes through the points (negative 10, 5), (negative 5, 3), (0, 1), (5, negative 1), and (10, negative 3).

3.1-23 §3.1 source ↗

Graph a Linear Equation by Plotting Points

In the following exercises, graph by plotting points.

y = − 3 2 x + 2

Answer

This figure shows a straight line graphed on the x y-coordinate plane. The x and y-axes run from negative 12 to 12. The line goes through the points (negative 4, 8), (negative 2, 5), (0, 2), (2, negative 1), (4, negative 4), and (6, negative 7).

3.1-25 §3.1 source ↗

Graph Vertical and Horizontal lines

In the following exercises, graph each equation.

ⓐ x=4 ⓑ y=3

Answer

ⓐ

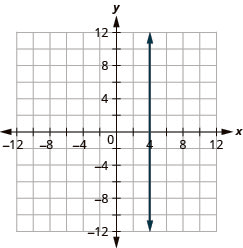
This figure shows a vertical straight line graphed on the x y-coordinate plane. The x and y-axes run from negative 12 to 12. The line goes through the points (4, negative 1), (4, 0), and (4, 1).


ⓑ

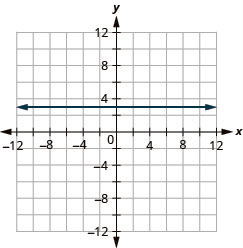
This figure shows a horizontal straight line graphed on the x y-coordinate plane. The x and y-axes run from negative 12 to 12. The line goes through the points (negative 1, 3), (0, 3), and (1, 3).

3.1-27 §3.1 source ↗

Graph Vertical and Horizontal lines

In the following exercises, graph each equation.

ⓐ x=−2 ⓑ y=−5

Answer

ⓐ

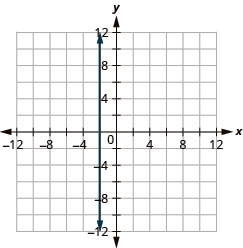
This figure shows a vertical straight line graphed on the x y-coordinate plane. The x and y-axes run from negative 12 to 12. The line goes through the points (negative 2, negative 1), (negative 2, 0), and (negative 2, 1).


ⓑ

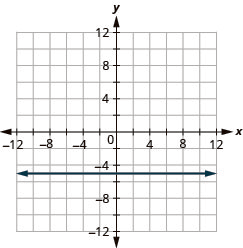
This figure shows a horizontal straight line graphed on the x y-coordinate plane. The x and y-axes run from negative 12 to 12. The line goes through the points (negative 1, negative 5), (0, negative 5), and (1, negative 5).

3.1-29 §3.1 source ↗

In the following exercises, graph each pair of equations in the same rectangular coordinate system.

y=2x and y=2

Answer

The figure shows the graphs of a straight horizontal line and a straight slanted line on the same x y-coordinate plane. The x and y axes run from negative 12 to 12. The horizontal line goes through the points (0, 2), (1, 2), and (2, 2). The slanted line goes through the points (0, 0), (1, 2), and (2, 4).

3.1-31 §3.1 source ↗

In the following exercises, graph each pair of equations in the same rectangular coordinate system.

y=−12x and y=−12

Answer

The figure shows the graphs of a straight horizontal line and a straight slanted line on the same x y-coordinate plane. The x and y axes run from negative 12 to 12. The horizontal line goes through the points (0, negative 1 divided 2), (1, negative 1 divided 2), and (2, negative 1 divided 2). The slanted line goes through the points (0, 0), (1, negative 1 divided 2), and (2, negative 1).

3.1-33 §3.1 source ↗

Find x- and y-Intercepts

In the following exercises, find the x- and y-intercepts on each graph.
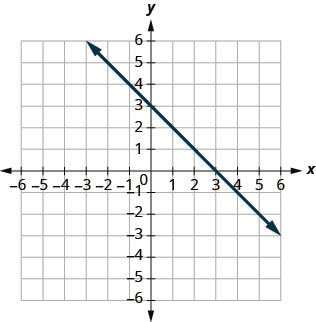

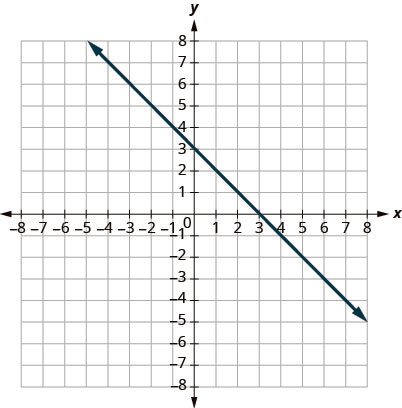
The figure shows a straight line graphed on the x y-coordinate plane. The x and y axes run from negative 8 to 8. The line goes through the points (negative 6, 9), (negative 3, 6), (0, 3), (3, 0), and (6, negative 3).

Answer

( 3 , 0 ) , ( 0 , 3 )

3.1-35 §3.1 source ↗

Find x- and y-Intercepts

In the following exercises, find the x- and y-intercepts on each graph.
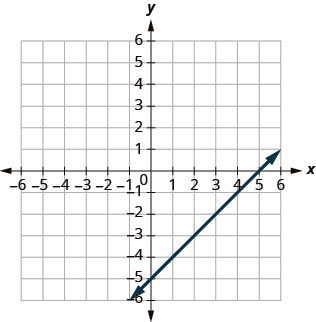

The figure shows a straight line graphed on the x y-coordinate plane. The x and y axes run from negative 8 to 8. The line goes through the points (negative 1, negative 6), (0, negative 5), (2, negative 3), (5, 0), and (7, 2).

Answer

(5,0), (0,−5)

3.1-37 §3.1 source ↗

In the following exercises, find the intercepts for each equation.

x − y = 5

Answer

(5,0), (0,−5)

3.1-39 §3.1 source ↗

In the following exercises, find the intercepts for each equation.

3 x + y = 6

Answer

( 2 , 0 ) , ( 0 , 6 )

3.1-41 §3.1 source ↗

In the following exercises, find the intercepts for each equation.

4 x − y = 8

Answer

(2,0), (0,−8)

3.1-43 §3.1 source ↗

In the following exercises, find the intercepts for each equation.

2 x + 5 y = 10

Answer

( 5 , 0 ) , ( 0 , 2 )

3.1-45 §3.1 source ↗

Graph a Line Using the Intercepts

In the following exercises, graph using the intercepts.

− x + 4 y = 8

Answer

The figure shows a straight line graphed on the x y-coordinate plane. The x and y axes run from negative 12 to 12. The line goes through the points (negative 8, 0), (0, 2), (4, 3), and (8, 4).

3.1-47 §3.1 source ↗

Graph a Line Using the Intercepts

In the following exercises, graph using the intercepts.

x + y = −3

Answer

The figure shows a straight line graphed on the x y-coordinate plane. The x and y axes run from negative 12 to 12. The line goes through the points (negative 3, 0), (0, negative 3), and (3, negative 6).

3.1-49 §3.1 source ↗

Graph a Line Using the Intercepts

In the following exercises, graph using the intercepts.

4 x + y = 4

Answer

The figure shows a straight line graphed on the x y-coordinate plane. The x and y axes run from negative 12 to 12. The line goes through the points (0, 4), (1, 0), and (2, negative 4).

3.1-51 §3.1 source ↗

Graph a Line Using the Intercepts

In the following exercises, graph using the intercepts.

3 x − y = −6

Answer

The figure shows a straight line graphed on the x y-coordinate plane. The x and y axes run from negative 12 to 12. The line goes through the points (negative 2, 0), (negative 1, 3), and (0, 6).

3.1-53 §3.1 source ↗

Graph a Line Using the Intercepts

In the following exercises, graph using the intercepts.

2 x + 4 y = 12

Answer

The figure shows a straight line graphed on the x y-coordinate plane. The x and y axes run from negative 8 to 8. The line goes through the points (0, 3), (2, 2), and (6, 0).

3.1-55 §3.1 source ↗

Graph a Line Using the Intercepts

In the following exercises, graph using the intercepts.

2 x − 5 y = −20

Answer

The figure shows a straight line graphed on the x y-coordinate plane. The x and y axes run from negative 12 to 12. The line goes through the points (negative 10, 0), (0, 4), and (10, 8).

3.1-57 §3.1 source ↗

Graph a Line Using the Intercepts

In the following exercises, graph using the intercepts.

y = −2 x

Answer

The figure shows a straight line graphed on the x y-coordinate plane. The x and y axes run from negative 12 to 12. The line goes through the points (negative 1, 2), (0, 0), and (1, negative 2).

3.1-59 §3.1 source ↗

Graph a Line Using the Intercepts

In the following exercises, graph using the intercepts.

y = x

Answer

The figure shows a straight line graphed on the x y-coordinate plane. The x and y axes run from negative 12 to 12. The line goes through the points (negative 1, negative 1), (0, 0), and (1, 1).

3.1-61 §3.1 source ↗

Mixed Practice

In the following exercises, graph each equation.

y = 3 2 x

Answer

The figure shows a straight line graphed on the x y-coordinate plane. The x and y axes run from negative 8 to 8. The line goes through the points (negative 2, negative 3), (0, 0), and (2, 3).

3.1-63 §3.1 source ↗

Mixed Practice

In the following exercises, graph each equation.

y = − 1 2 x + 3

Answer

The figure shows a straight line graphed on the x y-coordinate plane. The x and y axes run from negative 8 to 8. The line goes through the points (negative 2, 4), (0, 3), (2, 2), (4, 1), and (6, 0).

3.1-65 §3.1 source ↗

Mixed Practice

In the following exercises, graph each equation.

4 x + y = 2

Answer

The figure shows a straight line graphed on the x y-coordinate plane. The x and y axes run from negative 8 to 8. The line goes through the points (negative 1, 6), (0, 2), (1, negative 2), and (2, negative 4).

3.1-67 §3.1 source ↗

Mixed Practice

In the following exercises, graph each equation.

y = −1

Answer

The figure shows a horizontal straight line graphed on the x y-coordinate plane. The x and y axes run from negative 8 to 8. The line goes through the points (negative 2, negative 1), (0, negative 1), and (1, negative 1).

3.1-69 §3.1 source ↗

Mixed Practice

In the following exercises, graph each equation.

Explain how you would choose three x-values to make a table to graph the line y=15x−2.

Answer

Answers will vary.

3.1-71 §3.1 source ↗

Mixed Practice

In the following exercises, graph each equation.

Do you prefer to use the method of plotting points or the method using the intercepts to graph the equation 4x+y=−4? Why?

Answer

Answers will vary.

Be Prepared 3.4 §3.2 source ↗

Simplify: (1–4)(8−2).
If you missed this problem, review Example 1.30.
Example 1.30 in the book ↗

Answer

− 1 2

Be Prepared 3.5 §3.2 source ↗

Divide: 04,40.
If you missed this problem, review Example 1.49.
Example 1.49 in the book ↗

Answer

0; undefined

Be Prepared 3.6 §3.2 source ↗

Simplify: 15−3, −153, −15−3.
If you missed this problem, review Example 1.30.
Example 1.30 in the book ↗

Answer

− 5 ; − 5 ; 5

Try It 3.23 §3.2 source ↗

Find the slope of the line shown.
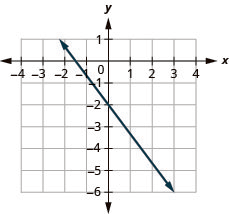
This figure shows the graph of a straight line on the x y-coordinate plane. The x-axis runs from negative 1 to 5. The y-axis runs from negative 6 to 1. The line goes through the points (0, negative 2) and (3, negative 6).

Answer

− 4 3

Try It 3.24 §3.2 source ↗

Find the slope of the line shown.
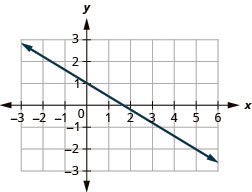
This figure shows the graph of a straight line on the x y-coordinate plane. The x-axis runs from negative 3 to 6. The y-axis runs from negative 3 to 2. The line goes through the points (0, 1) and (5, negative 2).

Answer

− 3 5

Try It 3.25 §3.2 source ↗

Find the slope of the line: x=−4.

Answer

undefined

Try It 3.26 §3.2 source ↗

Find the slope of the line: y=7.

Answer

0

Try It 3.27 §3.2 source ↗

Use the slope formula to find the slope of the line through the pair of points: (−3,4) and (2,−1).

Answer

−1

Try It 3.28 §3.2 source ↗

Use the slope formula to find the slope of the line through the pair of points: (−2,6) and (−3,−4).

Answer

10

Try It 3.29 §3.2 source ↗

Graph the line passing through the point (2,−2) with the slopem=43.

Answer


This figure shows the graph of a straight line on the x y-coordinate plane. The x-axis runs from negative 12 to 12. The y-axis runs from negative 12 to 12. The line goes through the points (2, negative 2) and (5, 2).

Try It 3.30 §3.2 source ↗

Graph the line passing through the point (−2,3) with the slope m=14.

Answer


This figure shows the graph of a straight line on the x y-coordinate plane. The x-axis runs from negative 12 to 12. The y-axis runs from negative 12 to 12. The line goes through the points (negative 2, 3) and (2, 4).

Try It 3.31 §3.2 source ↗

Identify the slope and y-intercept from the equation of the line.

ⓐ y=25x−1 ⓑ x+4y=8

Answer

ⓐ m=25;(0,−1)
ⓑ m=−14;(0,2)

Try It 3.32 §3.2 source ↗

Identify the slope and y-intercept from the equation of the line.

ⓐ y=−43x+1 ⓑ 3x+2y=12

Answer

ⓐ m=−43;(0,1)
ⓑ m=−32;(0,6)

Try It 3.33 §3.2 source ↗

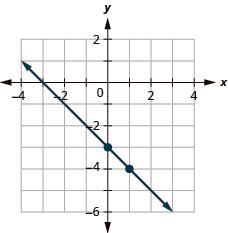
Graph the line of the equation y=−x−3 using its slope and y-intercept.

Answer


This figure shows the graph of a straight line on the x y-coordinate plane. The x-axis runs from negative 10 to 10. The y-axis runs from negative 10 to 10. The line goes through the points (0, negative 3) and (1, negative 4).

Try It 3.34 §3.2 source ↗

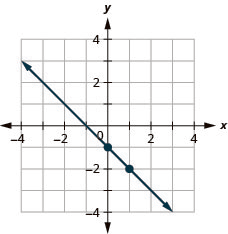
Graph the line of the equationy=−x−1 using its slope and y-intercept.

Answer


This figure shows the graph of a straight line on the x y-coordinate plane. The x-axis runs from negative 10 to 10. The y-axis runs from negative 10 to 10. The line goes through the points (0, negative 1) and (1, negative 2).

Try It 3.35 §3.2 source ↗

Determine the most convenient method to graph each line:

ⓐ 3x+2y=12 ⓑ y=4 ⓒ y=15x−4 ⓓ x=−7.

Answer

ⓐ intercepts ⓑ horizontal line ⓒ slope-intercept ⓓ vertical line

Try It 3.36 §3.2 source ↗

Determine the most convenient method to graph each line:

ⓐ x=6 ⓑ y=−34x+1 ⓒ y=−8 ⓓ 4x−3y=−1.

Answer

ⓐ vertical line ⓑ slope-intercept ⓒ horizontal line
ⓓ intercepts

Try It 3.37 §3.2 source ↗

The equation h=2s+50 is used to estimate a woman’s height in inches, h, based on her shoe size, s.

ⓐ Estimate the height of a child who wears women’s shoe size 0.

ⓑ Estimate the height of a woman with shoe size 8.

ⓒ Interpret the slope and h-intercept of the equation.

ⓓ Graph the equation.

Answer

ⓐ 50 inches
ⓑ 66 inches
ⓒ The slope, 2, means that the height, h, increases by 2 inches when the shoe size, s, increases by 1. The h-intercept means that when the shoe size is 0, the height is 50 inches.
ⓓ
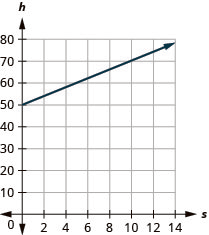
This figure shows the graph of a straight line on the x y-coordinate plane. The x-axis runs from negative 1 to 14. The y-axis runs from negative 1 to 80. The line goes through the points (0, 50) and (10, 70).

Try It 3.38 §3.2 source ↗

The equation T=14n+40 is used to estimate the temperature in degrees Fahrenheit, T, based on the number of cricket chirps, n, in one minute.

ⓐ Estimate the temperature when there are no chirps.

ⓑ Estimate the temperature when the number of chirps in one minute is 100.

ⓒ Interpret the slope and T-intercept of the equation.

ⓓ Graph the equation.

Answer

ⓐ 40 degrees
ⓑ 65 degrees
ⓒ The slope, 14, means that the temperature Fahrenheit (F) increases 1 degree when the number of chirps, n, increases by 4. The T-intercept means that when the number of chirps is 0, the temperature is 40°.
ⓓ
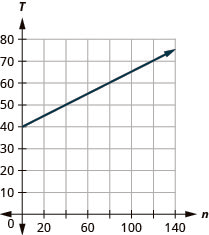
This figure shows the graph of a straight line on the x y-coordinate plane. The x-axis runs from negative 1 to 140. The y-axis runs from negative 1 to 80. The line goes through the points (0, 40) and (40, 50).

Try It 3.39 §3.2 source ↗

Stella has a home business selling gourmet pizzas. The equation C=4p+25 models the relation between her weekly cost, C, in dollars and the number of pizzas, p, that she sells.

ⓐ Find Stella’s cost for a week when she sells no pizzas.

ⓑ Find the cost for a week when she sells 15 pizzas.

ⓒ Interpret the slope and C-intercept of the equation.

ⓓ Graph the equation.

Answer

ⓐ $25
ⓑ $85
ⓒ The slope, 4, means that the weekly cost, C, increases by $4 when the number of pizzas sold, p, increases by 1. The C-intercept means that when the number of pizzas sold is 0, the weekly cost is $25.
ⓓ
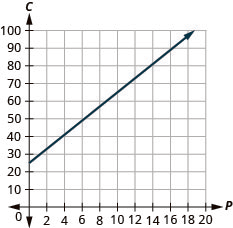
This figure shows the graph of a straight line on the x y-coordinate plane. The x-axis runs from negative 2 to 20. The y-axis runs from negative 10 to `00. The line goes through the points (0, 25) and (1, 29).

Try It 3.40 §3.2 source ↗

Loreen has a calligraphy business. The equation C=1.8n+35 models the relation between her weekly cost, C, in dollars and the number of wedding invitations, n, that she writes.

ⓐ Find Loreen’s cost for a week when she writes no invitations.

ⓑ Find the cost for a week when she writes 75 invitations.

ⓒ Interpret the slope and C-intercept of the equation.

ⓓ Graph the equation.

Answer

ⓐ $35
ⓑ $170
ⓒ The slope, 1.8, means that the weekly cost, C, increases by $1.80 when the number of invitations, n, increases by 1.
The C-intercept means that when the number of invitations is 0, the weekly cost is $35.
ⓓ
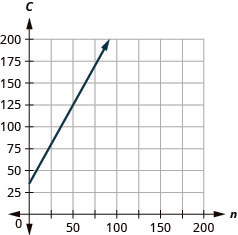
This figure shows the graph of a straight line on the x y-coordinate plane. The x-axis runs from negative 1 to 350. The y-axis runs from negative 1 to 350. The line goes through the points (0, 35) and (75, 170).

Try It 3.41 §3.2 source ↗

Use slopes and y-intercepts to determine if the lines are parallel:

ⓐ 2x+5y=5 and y=−25x−4 ⓑ y=−12x−1 and x+2y=−2.

Answer

ⓐ parallel ⓑ not parallel; same line

Try It 3.42 §3.2 source ↗

Use slopes and y-intercepts to determine if the lines are parallel:

ⓐ 4x−3y=6 and y=43x−1 ⓑ y=34x−3 and 3x−4y=12.

Answer

ⓐ parallel ⓑ not parallel; same line

Try It 3.43 §3.2 source ↗

Use slopes and y-intercepts to determine if the lines are parallel:

ⓐ y=8 and y=−6 ⓑ x=1 and x=−5.

Answer

ⓐ parallel ⓑ parallel

Try It 3.44 §3.2 source ↗

Use slopes and y-intercepts to determine if the lines are parallel:

ⓐ y=1 and y=−5 ⓑ x=8 and x=−6.

Answer

ⓐ parallel ⓑ parallel

Try It 3.45 §3.2 source ↗

Use slopes to determine if the lines are perpendicular:

ⓐ y=−3x+2 and x−3y=4 ⓑ 5x+4y=1 and 4x+5y=3.

Answer

ⓐ perpendicular ⓑ not perpendicular

Try It 3.46 §3.2 source ↗

Use slopes to determine if the lines are perpendicular:

ⓐ y=2x−5 and x+2y=−6 ⓑ 2x−9y=3 and 9x−2y=1.

Answer

ⓐ perpendicular ⓑ not perpendicular

3.2-73 §3.2 source ↗

Find the Slope of a Line

In the following exercises, find the slope of each line shown.
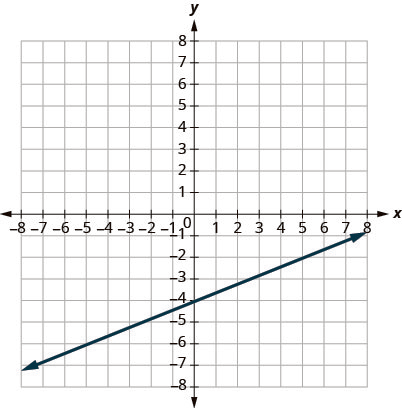
This figure shows the graph of a straight line on the x y-coordinate plane. The x-axis runs from negative 8 to 8. The y-axis runs from negative 8 to 8. The line goes through the points (0, negative 4) and (5, negative 2).

Answer

2 5

3.2-75 §3.2 source ↗

Find the Slope of a Line

In the following exercises, find the slope of each line shown.
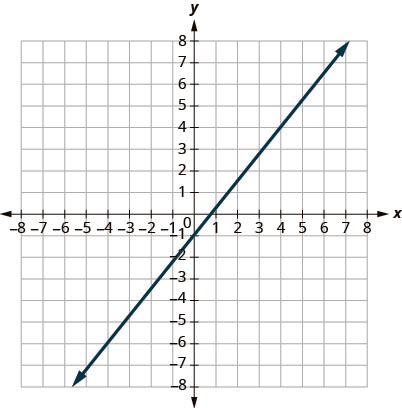
This figure shows the graph of a straight line on the x y-coordinate plane. The x-axis runs from negative 8 to 8. The y-axis runs from negative 8 to 8. The line goes through the points (0, negative 1) and (4, 4).

Answer

5 4

3.2-77 §3.2 source ↗

Find the Slope of a Line

In the following exercises, find the slope of each line shown.
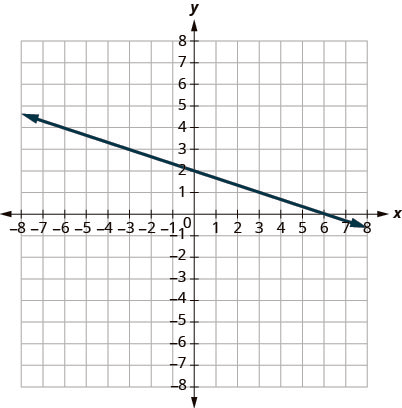
This figure shows the graph of a straight line on the x y-coordinate plane. The x-axis runs from negative 8 to 8. The y-axis runs from negative 8 to 8. The line goes through the points (0, 2) and (3, 1).

Answer

− 1 3

3.2-79 §3.2 source ↗

Find the Slope of a Line

In the following exercises, find the slope of each line shown.
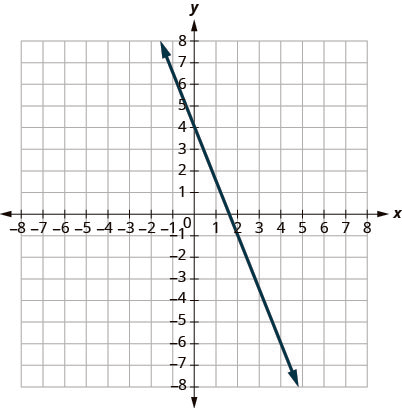
This figure shows the graph of a straight line on the x y-coordinate plane. The x-axis runs from negative 8 to 8. The y-axis runs from negative 8 to 8. The line goes through the points (0, 4) and (2, negative 1).

Answer

− 5 2

3.2-81 §3.2 source ↗

In the following exercises, find the slope of each line.

y = 3

Answer

0

3.2-83 §3.2 source ↗

In the following exercises, find the slope of each line.

x = −5

Answer

undefined

3.2-85 §3.2 source ↗

In the following exercises, use the slope formula to find the slope of the line between each pair of points.

( 2 , 5 ) , ( 4 , 0 )

Answer

− 5 2

3.2-87 §3.2 source ↗

In the following exercises, use the slope formula to find the slope of the line between each pair of points.

(−3,3), (4,−5)

Answer

− 8 7

3.2-89 §3.2 source ↗

In the following exercises, use the slope formula to find the slope of the line between each pair of points.

(−1,−2), (2,5)

Answer

7 3

3.2-91 §3.2 source ↗

In the following exercises, use the slope formula to find the slope of the line between each pair of points.

(4,−5), (1,−2)

Answer

−1

3.2-93 §3.2 source ↗

Graph a Line Given a Point and the Slope

In the following exercises, graph each line with the given point and slope.

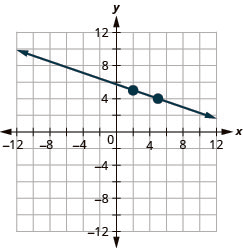
( 2 , 5 ) ; m = − 1 3

Answer

This figure shows the graph of a straight line on the x y-coordinate plane. The x-axis runs from negative 12 to 12. The y-axis runs from negative 12 to 12. The line goes through the points (2, 5) and (5, 4).

3.2-95 §3.2 source ↗

Graph a Line Given a Point and the Slope

In the following exercises, graph each line with the given point and slope.

(−1,−4); m=43

Answer

This figure shows the graph of a straight line on the x y-coordinate plane. The x-axis runs from negative 12 to 12. The y-axis runs from negative 12 to 12. The line goes through the points (negative 1, negative 4) and (2, 0).

3.2-97 §3.2 source ↗

Graph a Line Given a Point and the Slope

In the following exercises, graph each line with the given point and slope.

y-intercept 3; m=−25

Answer

This figure shows the graph of a straight line on the x y-coordinate plane. The x-axis runs from negative 12 to 12. The y-axis runs from negative 12 to 12. The line goes through the points (0, 3) and (5, 1).

3.2-99 §3.2 source ↗

Graph a Line Given a Point and the Slope

In the following exercises, graph each line with the given point and slope.

(−4,2); m=4

Answer

This figure shows the graph of a straight line on the x y-coordinate plane. The x-axis runs from negative 12 to 12. The y-axis runs from negative 12 to 12. The line goes through the points (negative 4, 2) and (negative 3, 6).

3.2-101 §3.2 source ↗

Graph a Line Using Its Slope and Intercept

In the following exercises, identify the slope and y-intercept of each line.

y = −7 x + 3

Answer

m = −7 ; ( 0 , 3 )

3.2-103 §3.2 source ↗

Graph a Line Using Its Slope and Intercept

In the following exercises, identify the slope and y-intercept of each line.

3 x + y = 5

Answer

m = −3 ; ( 0 , 5 )

3.2-105 §3.2 source ↗

Graph a Line Using Its Slope and Intercept

In the following exercises, identify the slope and y-intercept of each line.

6 x + 4 y = 12

Answer

m = − 3 2 ; ( 0 , 3 )

3.2-107 §3.2 source ↗

Graph a Line Using Its Slope and Intercept

In the following exercises, identify the slope and y-intercept of each line.

5 x − 2 y = 6

Answer

m = 5 2 ; ( 0 , −3 )

3.2-109 §3.2 source ↗

In the following exercises, graph the line of each equation using its slope and y-intercept.

y = 3 x − 1

Answer

This figure shows the graph of a straight line on the x y-coordinate plane. The x-axis runs from negative 10 to 10. The y-axis runs from negative 10 to 10. The line goes through the points (0, negative 1) and (1, 2).

3.2-111 §3.2 source ↗

In the following exercises, graph the line of each equation using its slope and y-intercept.

y = − x + 3

Answer

This figure shows the graph of a straight line on the x y-coordinate plane. The x-axis runs from negative 10 to 10. The y-axis runs from negative 10 to 10. The line goes through the points (0, 3) and (1, 2).

3.2-113 §3.2 source ↗

In the following exercises, graph the line of each equation using its slope and y-intercept.

y = − 2 5 x − 3

Answer

This figure shows the graph of a straight line on the x y-coordinate plane. The x-axis runs from negative 10 to 10. The y-axis runs from negative 10 to 10. The line goes through the points (0, negative 3) and (5, negative 5).

3.2-115 §3.2 source ↗

In the following exercises, graph the line of each equation using its slope and y-intercept.

3 x − 2 y = 4

Answer

This figure shows the graph of a straight line on the x y-coordinate plane. The x-axis runs from negative 10 to 10. The y-axis runs from negative 10 to 10. The line goes through the points (0, negative 2) and (2, 1).

3.2-117 §3.2 source ↗

Choose the Most Convenient Method to Graph a Line

In the following exercises, determine the most convenient method to graph each line.

x = 2

Answer

vertical line

3.2-119 §3.2 source ↗

Choose the Most Convenient Method to Graph a Line

In the following exercises, determine the most convenient method to graph each line.

y = −3 x + 4

Answer

slope-intercept

3.2-121 §3.2 source ↗

Choose the Most Convenient Method to Graph a Line

In the following exercises, determine the most convenient method to graph each line.

x − y = 1

Answer

intercepts

3.2-123 §3.2 source ↗

Choose the Most Convenient Method to Graph a Line

In the following exercises, determine the most convenient method to graph each line.

3 x − 2 y = −12

Answer

intercepts

3.2-125 §3.2 source ↗

Graph and Interpret Applications of Slope–Intercept

The equation P=31+1.75w models the relation between the amount of Tuyet’s monthly water bill payment, P, in dollars, and the number of units of water, w, used.

ⓐ Find Tuyet’s payment for a month when 0 units of water are used.

ⓑ Find Tuyet’s payment for a month when 12 units of water are used.

ⓒ Interpret the slope and P-intercept of the equation.

ⓓ Graph the equation.

Answer

ⓐ $31
ⓑ $52
ⓒ The slope, 1.75, means that the payment, P, increases by $1.75 when the number of units of water used, w, increases by 1. The P-intercept means that when the number units of water Tuyet used is 0, the payment is $31.
ⓓ
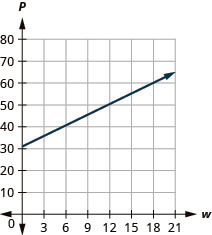
This figure shows the graph of a straight line on the x y-coordinate plane. The x-axis runs from negative 1 to 21. The y-axis runs from negative 1 to 80. The line goes through the points (0, 31) and (12, 52).

3.2-127 §3.2 source ↗

Graph and Interpret Applications of Slope–Intercept

Bruce drives his car for his job. The equation R=0.575m+42 models the relation between the amount in dollars, R, that he is reimbursed and the number of miles, m, he drives in one day.

ⓐ Find the amount Bruce is reimbursed on a day when he drives 0 miles.

ⓑ Find the amount Bruce is reimbursed on a day when he drives 220 miles.

ⓒ Interpret the slope and R-intercept of the equation.

ⓓ Graph the equation.

Answer

ⓐ $42
ⓑ $168.50
ⓒ The slope, 0.575 means that the amount he is reimbursed, R, increases by $0.575 when the number of miles driven, m, increases by 1. The R-intercept means that when the number miles driven is 0, the amount reimbursed is $42.
ⓓ
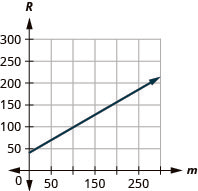
This figure shows the graph of a straight line on the x y-coordinate plane. The x-axis runs from negative 50 to 250. The y-axis runs from negative 50 to 300. The line goes through the points (0, 42) and (220, 168.5).

3.2-129 §3.2 source ↗

Graph and Interpret Applications of Slope–Intercept

Cherie works in retail and her weekly salary includes commission for the amount she sells. The equation S=400+0.15c models the relation between her weekly salary, S, in dollars and the amount of her sales, c, in dollars.

ⓐ Find Cherie’s salary for a week when her sales were $0.

ⓑ Find Cherie’s salary for a week when her sales were $3,600.

ⓒ Interpret the slope and S-intercept of the equation.

ⓓ Graph the equation.

Answer

ⓐ $400
ⓑ $940
ⓒ The slope, 0.15, means that Cherie’s salary, S, increases by $0.15 for every $1 increase in her sales. The S-intercept means that when her sales are $0, her salary is $400.
ⓓ
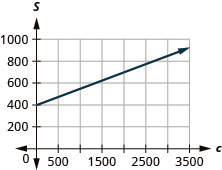
This figure shows the graph of a straight line on the x y-coordinate plane. The x-axis runs from negative 500 to 3500. The y-axis runs from negative 200 to 1000. The line goes through the points (0, 400) and (3600, 940).

3.2-131 §3.2 source ↗

Graph and Interpret Applications of Slope–Intercept

Costa is planning a lunch banquet. The equation C=450+28g models the relation between the cost in dollars, C, of the banquet and the number of guests, g.

ⓐ Find the cost if the number of guests is 40.

ⓑ Find the cost if the number of guests is 80.

ⓒ Interpret the slope and C-intercept of the equation.

ⓓ Graph the equation.

Answer

ⓐ $1570
ⓑ $2690
ⓒ The slope gives the cost per guest. The slope, 28, means that the cost, C, increases by $28 when the number of guests increases by 1. The C-intercept means that if the number of guests was 0, the cost would be $450.
ⓓ
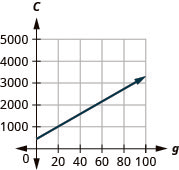
This figure shows the graph of a straight line on the x y-coordinate plane. The x-axis runs from negative 20 to 100. The y-axis runs from negative 1000 to 7000. The line goes through the points (0, 450) and (40, 1570).

3.2-133 §3.2 source ↗

Use Slopes to Identify Parallel and Perpendicular Lines

In the following exercises, use slopes and y-intercepts to determine if the lines are parallel, perpendicular, or neither.

y= 3 4 x− 3; 3x− 4y= −2

Answer

parallel

3.2-135 §3.2 source ↗

Use Slopes to Identify Parallel and Perpendicular Lines

In the following exercises, use slopes and y-intercepts to determine if the lines are parallel, perpendicular, or neither.

2x− 4y= 6; x− 2y= 3

Answer

neither

3.2-137 §3.2 source ↗

Use Slopes to Identify Parallel and Perpendicular Lines

In the following exercises, use slopes and y-intercepts to determine if the lines are parallel, perpendicular, or neither.

x = 5 ; x = −6

Answer

parallel

3.2-139 §3.2 source ↗

Use Slopes to Identify Parallel and Perpendicular Lines

In the following exercises, use slopes and y-intercepts to determine if the lines are parallel, perpendicular, or neither.

4x− 2y= 5; 3x+ 6y= 8

Answer

perpendicular

3.2-141 §3.2 source ↗

Use Slopes to Identify Parallel and Perpendicular Lines

In the following exercises, use slopes and y-intercepts to determine if the lines are parallel, perpendicular, or neither.

3x− 6y= 12; 6x− 3y= 3

Answer

neither

3.2-143 §3.2 source ↗

Use Slopes to Identify Parallel and Perpendicular Lines

In the following exercises, use slopes and y-intercepts to determine if the lines are parallel, perpendicular, or neither.

7x− 4y= 8; 4x+ 7y= 14

Answer

perpendicular

3.2-145 §3.2 source ↗

Use Slopes to Identify Parallel and Perpendicular Lines

In the following exercises, use slopes and y-intercepts to determine if the lines are parallel, perpendicular, or neither.

3x− 2y= 8; 2x+ 3y= 6

Answer

perpendicular

3.2-147 §3.2 source ↗

Use Slopes to Identify Parallel and Perpendicular Lines

In the following exercises, use slopes and y-intercepts to determine if the lines are parallel, perpendicular, or neither.

3x− 2y= 1; 2x− 3y= 2

Answer

neither

3.2-149 §3.2 source ↗

Use Slopes to Identify Parallel and Perpendicular Lines

In the following exercises, use slopes and y-intercepts to determine if the lines are parallel, perpendicular, or neither.

y = 2 ; y = 6

Answer

parallel

3.2-151 §3.2 source ↗

Use Slopes to Identify Parallel and Perpendicular Lines

In the following exercises, use slopes and y-intercepts to determine if the lines are parallel, perpendicular, or neither.

How does the graph of a line with slope m=-12 differ from the graph of a line with slope m=2?

Answer

It is perpendicular to the second line.

3.2-153 §3.2 source ↗

Use Slopes to Identify Parallel and Perpendicular Lines

In the following exercises, use slopes and y-intercepts to determine if the lines are parallel, perpendicular, or neither.

Explain how you can graph a line given a point and its slope.

Answer

Answers will vary.

Be Prepared 3.7 §3.3 source ↗

Simplify: 25(x+15).
If you missed this problem, review Example 1.50.
Example 1.50 in the book ↗

Answer

2 5 x + 6

Be Prepared 3.8 §3.3 source ↗

Simplify: −3(x−(−2)).
If you missed this problem, review Example 1.53.
Example 1.53 in the book ↗

Answer

− 3 x − 6

Be Prepared 3.9 §3.3 source ↗

Solve for y: y− 3= −2(x+1).
If you missed this problem, review Example 2.31.
Example 2.31 in the book ↗

Answer

y = − 2 x + 1

Try It 3.47 §3.3 source ↗

Find the equation of a line with slope 25 and y-intercept (0,4).

Answer

y = 2 5 x + 4

Try It 3.48 §3.3 source ↗

Find the equation of a line with slope −1 and y-intercept (0,−3).

Answer

y = − x − 3

Try It 3.49 §3.3 source ↗

Find the equation of the line shown in the graph.
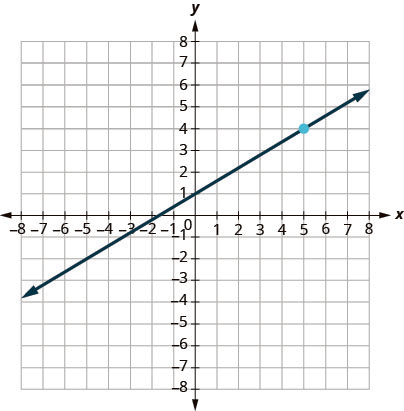
This figure has a graph of a straight line on the x y-coordinate plane. The x and y-axes run from negative 8 to 8. The line goes through the points (negative 5, negative 2), (0, 1), and (5, 4).

Answer

y = 3 5 x + 1

Try It 3.50 §3.3 source ↗

Find the equation of the line shown in the graph.
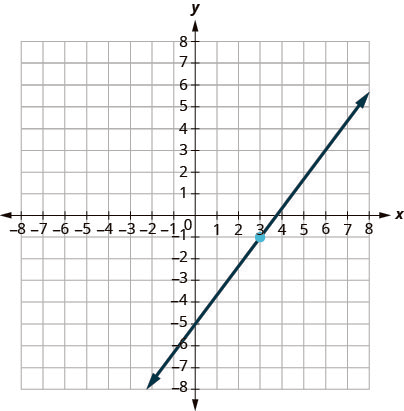
This figure has a graph of a straight line on the x y-coordinate plane. The x and y-axes run from negative 8 to 8. The line goes through the points (0, negative 5), (3, negative 1), and (6, 3).

Answer

y = 4 3 x − 5

Try It 3.51 §3.3 source ↗

Find the equation of a line with slope m=−25 and containing the point (10,−5).

Answer

y = − 2 5 x − 1

Try It 3.52 §3.3 source ↗

Find the equation of a line with slope m=−34, and containing the point (4,−7).

Answer

y = − 3 4 x − 4

Try It 3.53 §3.3 source ↗

Find the equation of a horizontal line containing the point (−3,8).

Answer

y = 8

Try It 3.54 §3.3 source ↗

Find the equation of a horizontal line containing the point (−1,4).

Answer

y = 4

Try It 3.55 §3.3 source ↗

Find the equation of a line containing the points (−2,−4) and (1,−3).

Answer

y = 1 3 x − 10 3

Try It 3.56 §3.3 source ↗

Find the equation of a line containing the points (−4,−3) and (1,−5).

Answer

y = − 2 5 x − 23 5

Try It 3.57 §3.3 source ↗

Find the equation of a line containing the points (5,1) and (5,−4).

Answer

x = 5

Try It 3.58 §3.3 source ↗

Find the equation of a line containing the points (−4,4) and (−4,3).

Answer

x = −4

Try It 3.59 §3.3 source ↗

Find an equation of a line parallel to the line y=3x+1 that contains the point (4,2). Write the equation in slope-intercept form.

Answer

y = 3 x − 10

Try It 3.60 §3.3 source ↗

Find an equation of a line parallel to the line y=12x−3 that contains the point (6,4).

Write the equation in slope-intercept form.

Answer

y = 1 2 x + 1

Try It 3.61 §3.3 source ↗

Find an equation of a line perpendicular to the line y=3x+1 that contains the point (4,2). Write the equation in slope-intercept form.

Answer

y = − 1 3 x + 10 3

Try It 3.62 §3.3 source ↗

Find an equation of a line perpendicular to the line y=12x−3 that contains the point (6,4). Write the equation in slope-intercept form.

Answer

y = −2 x + 16

Try It 3.63 §3.3 source ↗

Find an equation of a line that is perpendicular to the line x=4 that contains the point (4,−5).. Write the equation in slope-intercept form.

Answer

y = −5

Try It 3.64 §3.3 source ↗

Find an equation of a line that is perpendicular to the line x=2 that contains the point (2,−1). Write the equation in slope-intercept form.

Answer

y = −1

Try It 3.65 §3.3 source ↗

Find an equation of a line that is perpendicular to the line y=1 that contains the point (−5,1). Write the equation in slope-intercept form.

Answer

x = −5

Try It 3.66 §3.3 source ↗

Find an equation of a line that is perpendicular to the line y=−5 that contains the point (−4,−5). Write the equation in slope-intercept form.

Answer

x = −4

3.3-155 §3.3 source ↗

Find an Equation of the Line Given the Slope and y-Intercept

In the following exercises, find the equation of a line with given slope and y-intercept. Write the equation in slope-intercept form.

slope 3 and
y-intercept (0,5)

Answer

y = 3 x + 5

3.3-157 §3.3 source ↗

Find an Equation of the Line Given the Slope and y-Intercept

In the following exercises, find the equation of a line with given slope and y-intercept. Write the equation in slope-intercept form.

slope −3 and
y-intercept (0,−1)

Answer

y = −3 x − 1

3.3-159 §3.3 source ↗

Find an Equation of the Line Given the Slope and y-Intercept

In the following exercises, find the equation of a line with given slope and y-intercept. Write the equation in slope-intercept form.

slope 15 and
y-intercept (0,−5)

Answer

y = 1 5 x − 5

3.3-161 §3.3 source ↗

Find an Equation of the Line Given the Slope and y-Intercept

In the following exercises, find the equation of a line with given slope and y-intercept. Write the equation in slope-intercept form.

slope 0 and
y-intercept (0,−1)

Answer

y = −1

3.3-163 §3.3 source ↗

In the following exercises, find the equation of the line shown in each graph. Write the equation in slope-intercept form.
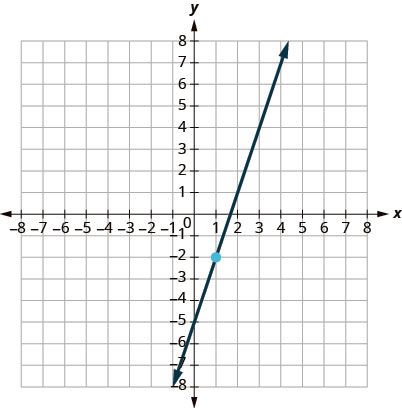

This figure has a graph of a straight line on the x y-coordinate plane. The x and y-axes run from negative 10 to 10. The line goes through the points (0, negative 5), (1, negative 2), and (2, 1).

Answer

y = 3 x − 5

3.3-165 §3.3 source ↗

In the following exercises, find the equation of the line shown in each graph. Write the equation in slope-intercept form.
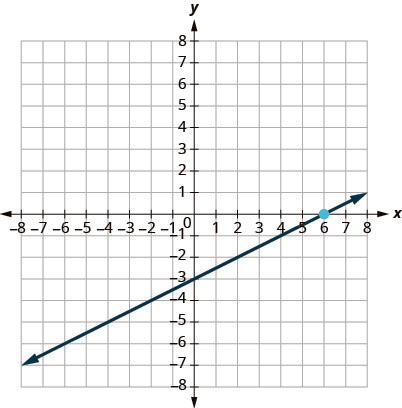

This figure has a graph of a straight line on the x y-coordinate plane. The x and y-axes run from negative 10 to 10. The line goes through the points (0, negative 3), (2, negative 2), and (6, 0).

Answer

y = 1 2 x − 3

3.3-167 §3.3 source ↗

In the following exercises, find the equation of the line shown in each graph. Write the equation in slope-intercept form.
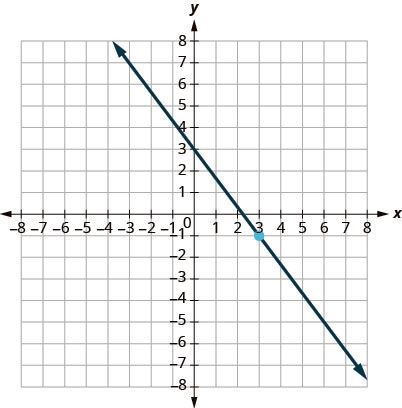

This figure has a graph of a straight line on the x y-coordinate plane. The x and y-axes run from negative 10 to 10. The line goes through the points (0, 3), (3, negative 1), and (6, negative 5).

Answer

y = − 4 3 x + 3

3.3-169 §3.3 source ↗

In the following exercises, find the equation of the line shown in each graph. Write the equation in slope-intercept form.
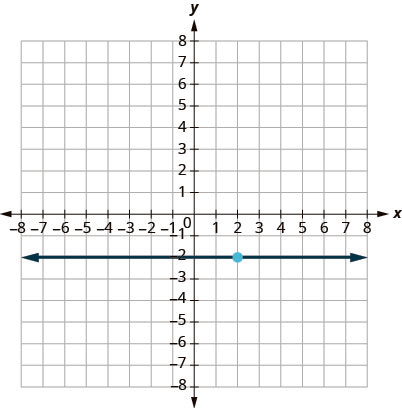

This figure has a graph of a horizontal straight line on the x y-coordinate plane. The x and y-axes run from negative 10 to 10. The line goes through the points (0, negative 2), (1, negative 2), and (2, negative 2).

Answer

y = −2

3.3-171 §3.3 source ↗

Find an Equation of the Line Given the Slope and a Point

In the following exercises, find the equation of a line with given slope and containing the given point. Write the equation in slope-intercept form.

m=58, point (8,3)

Answer

y = 5 8 x − 2

3.3-173 §3.3 source ↗

Find an Equation of the Line Given the Slope and a Point

In the following exercises, find the equation of a line with given slope and containing the given point. Write the equation in slope-intercept form.

m=−35, point (10,−5)

Answer

y = − 3 5 x + 1

3.3-175 §3.3 source ↗

Find an Equation of the Line Given the Slope and a Point

In the following exercises, find the equation of a line with given slope and containing the given point. Write the equation in slope-intercept form.

m=−32, point (−4,−3)

Answer

y = − 3 2 x − 9

3.3-177 §3.3 source ↗

Find an Equation of the Line Given the Slope and a Point

In the following exercises, find the equation of a line with given slope and containing the given point. Write the equation in slope-intercept form.

m=−7, point (−1,−3)

Answer

y = −7 x − 10

3.3-179 §3.3 source ↗

Find an Equation of the Line Given the Slope and a Point

In the following exercises, find the equation of a line with given slope and containing the given point. Write the equation in slope-intercept form.

Horizontal line containing (−2,5)

Answer

y = 5

3.3-181 §3.3 source ↗

Find an Equation of the Line Given the Slope and a Point

In the following exercises, find the equation of a line with given slope and containing the given point. Write the equation in slope-intercept form.

Horizontal line containing (−1,−7)

Answer

y = −7

3.3-183 §3.3 source ↗

Find an Equation of the Line Given Two Points

In the following exercises, find the equation of a line containing the given points. Write the equation in slope-intercept form.

(2,6) and (5,3)

Answer

y = − x + 8

3.3-185 §3.3 source ↗

Find an Equation of the Line Given Two Points

In the following exercises, find the equation of a line containing the given points. Write the equation in slope-intercept form.

(−3,−4) and (5,−2)

Answer

y = 1 4 x − 13 4

3.3-187 §3.3 source ↗

Find an Equation of the Line Given Two Points

In the following exercises, find the equation of a line containing the given points. Write the equation in slope-intercept form.

(−1,3) and (−6,−7)

Answer

y = 2 x + 5

3.3-189 §3.3 source ↗

Find an Equation of the Line Given Two Points

In the following exercises, find the equation of a line containing the given points. Write the equation in slope-intercept form.

(0,4) and (2,−3)

Answer

y = − 7 2 x + 4

3.3-191 §3.3 source ↗

Find an Equation of the Line Given Two Points

In the following exercises, find the equation of a line containing the given points. Write the equation in slope-intercept form.

(7,2) and (7,−2)

Answer

x = 7

3.3-193 §3.3 source ↗

Find an Equation of the Line Given Two Points

In the following exercises, find the equation of a line containing the given points. Write the equation in slope-intercept form.

(3,−4) and (5,−4)

Answer

y = −4

3.3-195 §3.3 source ↗

Find an Equation of a Line Parallel to a Given Line

In the following exercises, find an equation of a line parallel to the given line and contains the given point. Write the equation in slope-intercept form.

line y=4x+2,
point (1,2)

Answer

y = 4 x − 2

3.3-197 §3.3 source ↗

Find an Equation of a Line Parallel to a Given Line

In the following exercises, find an equation of a line parallel to the given line and contains the given point. Write the equation in slope-intercept form.

line 2x−y=6,
point (3,0).

Answer

y = 2 x − 6

3.3-199 §3.3 source ↗

Find an Equation of a Line Parallel to a Given Line

In the following exercises, find an equation of a line parallel to the given line and contains the given point. Write the equation in slope-intercept form.

line x=−4,
point (−3,−5).

Answer

x = −3

3.3-201 §3.3 source ↗

Find an Equation of a Line Parallel to a Given Line

In the following exercises, find an equation of a line parallel to the given line and contains the given point. Write the equation in slope-intercept form.

line y=5,
point (2,−2)

Answer

y = −2

3.3-203 §3.3 source ↗

Find an Equation of a Line Perpendicular to a Given Line

In the following exercises, find an equation of a line perpendicular to the given line and contains the given point. Write the equation in slope-intercept form.

line y=−2x+3,
point (2,2)

Answer

y = 1 2 x + 1

3.3-205 §3.3 source ↗

Find an Equation of a Line Perpendicular to a Given Line

In the following exercises, find an equation of a line perpendicular to the given line and contains the given point. Write the equation in slope-intercept form.

line y=34x−2,
point (−3,4)

Answer

y = − 4 3 x

3.3-207 §3.3 source ↗

Find an Equation of a Line Perpendicular to a Given Line

In the following exercises, find an equation of a line perpendicular to the given line and contains the given point. Write the equation in slope-intercept form.

line 2x−3y=8,
point (4,−1)

Answer

y = − 3 2 x + 5

3.3-209 §3.3 source ↗

Find an Equation of a Line Perpendicular to a Given Line

In the following exercises, find an equation of a line perpendicular to the given line and contains the given point. Write the equation in slope-intercept form.

line 2x+5y=6,
point (0,0)

Answer

y = 5 2 x

3.3-211 §3.3 source ↗

Find an Equation of a Line Perpendicular to a Given Line

In the following exercises, find an equation of a line perpendicular to the given line and contains the given point. Write the equation in slope-intercept form.

line x=3,
point (3,4)

Answer

y = 4

3.3-213 §3.3 source ↗

Find an Equation of a Line Perpendicular to a Given Line

In the following exercises, find an equation of a line perpendicular to the given line and contains the given point. Write the equation in slope-intercept form.

line x=7,
point (−3,−4)

Answer

y = −4

3.3-215 §3.3 source ↗

Find an Equation of a Line Perpendicular to a Given Line

In the following exercises, find an equation of a line perpendicular to the given line and contains the given point. Write the equation in slope-intercept form.

line y−3=0,
point (−2,−4)

Answer

x = −2

3.3-217 §3.3 source ↗

Find an Equation of a Line Perpendicular to a Given Line

In the following exercises, find an equation of a line perpendicular to the given line and contains the given point. Write the equation in slope-intercept form.

line y-axis,
point (3,4)

Answer

y = 4

3.3-219 §3.3 source ↗

Mixed Practice

In the following exercises, find the equation of each line. Write the equation in slope-intercept form.

Containing the points (4,3) and (8,1)

Answer

y = − 1 2 x + 5

3.3-221 §3.3 source ↗

Mixed Practice

In the following exercises, find the equation of each line. Write the equation in slope-intercept form.

m=16, containing point (6,1)

Answer

y = 1 6 x

3.3-223 §3.3 source ↗

Mixed Practice

In the following exercises, find the equation of each line. Write the equation in slope-intercept form.

Parallel to the line 4x+3y=6, containing point (0,−3)

Answer

y = − 4 3 x − 3

3.3-225 §3.3 source ↗

Mixed Practice

In the following exercises, find the equation of each line. Write the equation in slope-intercept form.

m=−34, containing point (8,−5)

Answer

y = − 3 4 x + 1

3.3-227 §3.3 source ↗

Mixed Practice

In the following exercises, find the equation of each line. Write the equation in slope-intercept form.

Perpendicular to the line y−1=0, point (−2,6)

Answer

x = −2

3.3-229 §3.3 source ↗

Mixed Practice

In the following exercises, find the equation of each line. Write the equation in slope-intercept form.

Parallel to the line x=−3, containing point (−2,−1)

Answer

x = −2

3.3-231 §3.3 source ↗

Mixed Practice

In the following exercises, find the equation of each line. Write the equation in slope-intercept form.

Containing the points (−3,−4) and (2,−5)

Answer

y = − 1 5 x − 23 5

3.3-233 §3.3 source ↗

Mixed Practice

In the following exercises, find the equation of each line. Write the equation in slope-intercept form.

Perpendicular to the line x−2y=5, point (−2,2)

Answer

y = −2 x − 2

3.3-235 §3.3 source ↗

Mixed Practice

In the following exercises, find the equation of each line. Write the equation in slope-intercept form.

Why are all horizontal lines parallel?

Answer

Answers will vary.

Be Prepared 3.10 §3.4 source ↗

Graph x>2 on a number line.
If you missed this problem, review Example 2.48.
Example 2.48 in the book ↗

Answer

A number line displays the inequality x greater than 2. It shows an open circle at 2 and a thick arrow extending to the right, indicating all real numbers greater than 2. The number line ranges from -5 to 5.

Be Prepared 3.11 §3.4 source ↗

Solve: 4x+3>23.
If you missed this problem, review Example 2.52.
Example 2.52 in the book ↗

Answer

x > 5

Be Prepared 3.12 §3.4 source ↗

Translate: 8>x>3.
If you missed this problem, review Example 2.56.
Example 2.56 in the book ↗

Answer

x is between 3 and 8, not inclusive

Try It 3.67 §3.4 source ↗

Determine whether each ordered pair is a solution to the inequality y>x−3:

ⓐ (0,0) ⓑ (4,9) ⓒ (−2,1) ⓓ (−5,−3) ⓔ (5,1)

Answer

ⓐ yes ⓑ yes ⓒ yes ⓓ yes ⓔ no

Try It 3.68 §3.4 source ↗

Determine whether each ordered pair is a solution to the inequality y<x+1:

ⓐ (0,0) ⓑ (8,6) ⓒ (−2,−1) ⓓ (3,4) ⓔ (−1,−4)

Answer

ⓐ yes ⓑ yes ⓒ no ⓓ no
ⓔ yes

Try It 3.69 §3.4 source ↗

Write the inequality shown by the graph with the boundary line y=−2x+3.
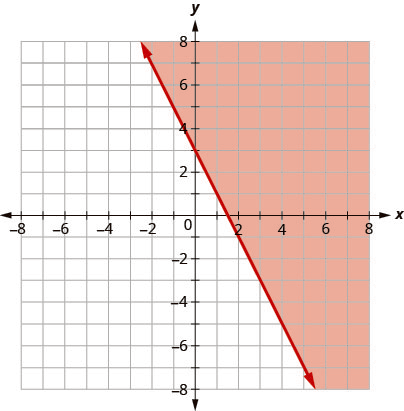
This figure has the graph of a straight line on the x y-coordinate plane. The x and y axes run from negative 8 to 8. A straight line is drawn through the points (0, 3), (1, 1), and (3, negative 3). The line divides the x y-coordinate plane into two halves. The line itself and the top right half are colored red to indicate that this is where the solutions of the inequality are.

Answer

y ≥ −2 x + 3

Try It 3.70 §3.4 source ↗

Write the inequality shown by the graph with the boundary line y=12x−4.
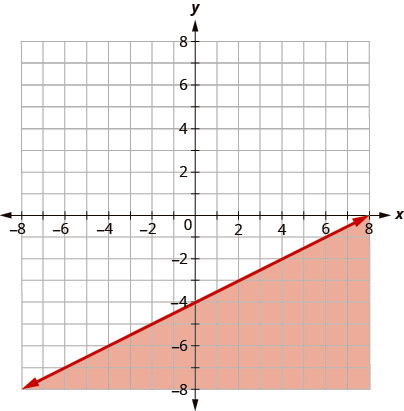
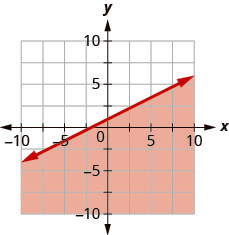
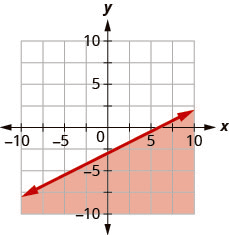
This figure has the graph of a straight line on the x y-coordinate plane. The x and y axes run from negative 8 to 8. A straight line is drawn through the points (0, negative 4), (2, negative 3), and (4, negative 2). The line divides the x y-coordinate plane into two halves. The line itself and the bottom right half are colored red to indicate that this is where the solutions of the inequality are.

Answer

y ≤ 1 2 x − 4

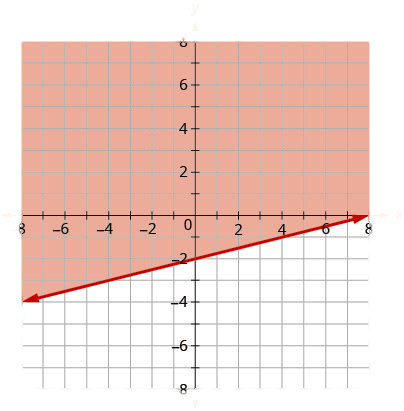
Try It 3.71 §3.4 source ↗

Write the inequality shown by the shaded region in the graph with the boundary line x−4y=8.
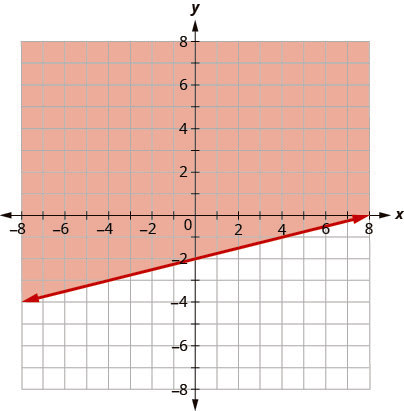
This figure has the graph of a straight line on the x y-coordinate plane. The x and y axes run from negative 8 to 8. A straight line is drawn through the points (0, negative 2), (4, negative 1), and (8, 0). The line divides the x y-coordinate plane into two halves. The line itself and the top left half are colored red to indicate that this is where the solutions of the inequality are.This figure has the graph of a straight line on the x y-coordinate plane. The x and y axes run from negative 8 to 8. A straight line is drawn through the points (0, negative 2), (4, negative 1), and (8, 0). The line divides the x y-coordinate plane into two halves. The line itself and the top left half are colored red to indicate that this is where the solutions of the inequality are.

Answer

x − 4 y ≤ 8

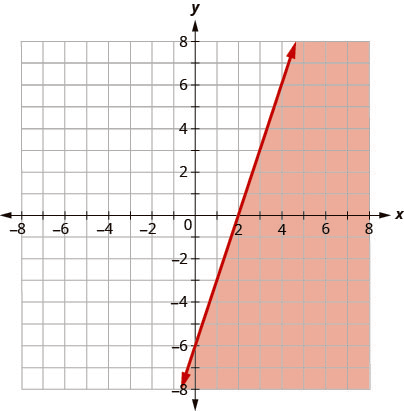
Try It 3.72 §3.4 source ↗

Write the inequality shown by the shaded region in the graph with the boundary line 3x−y=6.
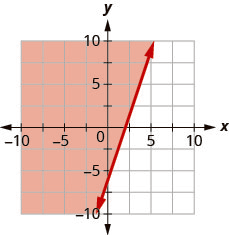
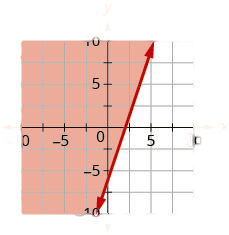
This figure has the graph of a straight line on the x y-coordinate plane. The x and y axes run from negative 8 to 8. A straight line is drawn through the points (0, negative 6), (1, negative 3), and (2, 0). The line divides the x y-coordinate plane into two halves. The line itself and the bottom right half are colored red to indicate that this is where the solutions of the inequality are.

Answer

3 x − y ≥ 6

Try It 3.73 §3.4 source ↗

Graph the linear inequality y≥52x−4.

Answer


This figure has the graph of a straight dashed line on the x y-coordinate plane. The x and y axes run from negative 10 to 10. A straight dashed line is drawn through the points (0, negative 4), (2, 1), and (4, 6). The line divides the x y-coordinate plane into two halves. The top left half is shaded red to indicate that this is where the solutions of the inequality are.


All points in the shaded region and on the boundary line, represent the solutions to y>52x−4.

Try It 3.74 §3.4 source ↗

Graph the linear inequality y<23x−5.

Answer


This figure has the graph of a straight dashed line on the x y-coordinate plane. The x and y axes run from negative 10 to 10. A straight dashed line is drawn through the points (0, negative 5), (3, negative 3), and (5, negative 1). The line divides the x y-coordinate plane into two halves. The top left half is shaded red to indicate that this is where the solutions of the inequality are.


All points in the shaded region, but not those on the boundary line, represent the solutions to y<23x−5.

Try It 3.75 §3.4 source ↗

Graph the linear inequality: 2x−3y<6.

Answer


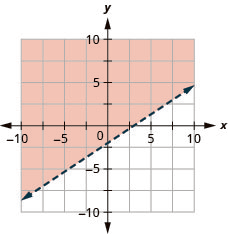
This figure has the graph of a straight dashed line on the x y-coordinate plane. The x and y axes run from negative 10 to 10. A straight dashed line is drawn through the points (0, negative 2), (3, 0), and (6, 2). The line divides the x y-coordinate plane into two halves. The top left half is shaded red to indicate that this is where the solutions of the inequality are.


All points in the shaded region, but not those on the boundary line, represent the solutions to 2x−3y<6.

Try It 3.76 §3.4 source ↗

Graph the linear inequality: 2x−y>3.

Answer


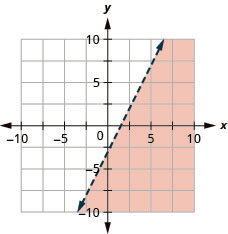
This figure has the graph of a straight dashed line on the x y-coordinate plane. The x and y axes run from negative 10 to 10. A straight dashed line is drawn through the points (0, negative 3), (1, negative 1), and (2, 1). The line divides the x y-coordinate plane into two halves. The bottom right half is shaded red to indicate that this is where the solutions of the inequality are.


All points in the shaded region, but not those on the boundary line, represent the solutions to 2x−y>3.

Try It 3.77 §3.4 source ↗

Graph the linear inequality: y>−3x.

Answer


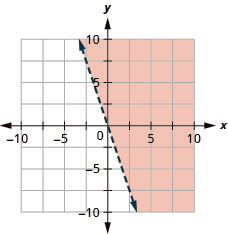
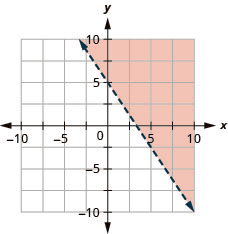
This figure has the graph of a straight dashed line on the x y-coordinate plane. The x and y axes run from negative 10 to 10. A straight dashed line is drawn through the points (negative 1, 3), (0, 0), and (1, negative 3). The line divides the x y-coordinate plane into two halves. The top right half is shaded red to indicate that this is where the solutions of the inequality are.


All points in the shaded region, but not those on the boundary line, represent the solutions to y>−3x.

Try It 3.78 §3.4 source ↗

Graph the linear inequality: y≥−2x.

Answer


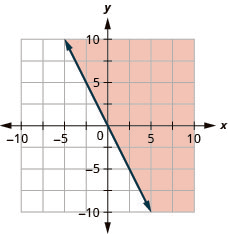
This figure has the graph of a straight dashed line on the x y-coordinate plane. The x and y axes run from negative 10 to 10. A straight dashed line is drawn through the points (negative 1, 2), (0, 0), and (1, negative 2). The line divides the x y-coordinate plane into two halves. The top right half is shaded red to indicate that this is where the solutions of the inequality are.


All points in the shaded region and on the boundary line, represent the solutions to y≥−2x.

Try It 3.79 §3.4 source ↗

Graph the linear inequality: y<5.

Answer


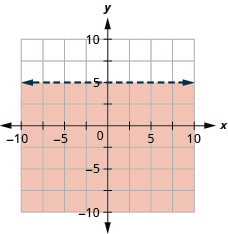
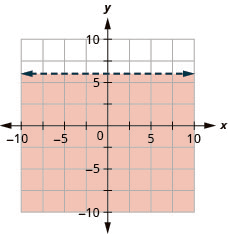
This figure has the graph of a straight horizontal dashed line on the x y-coordinate plane. The x and y axes run from negative 10 to 10. A horizontal dashed line is drawn through the points (negative 1, 5), (0, 5), and (1, 5). The line divides the x y-coordinate plane into two halves. The bottom half is shaded red to indicate that this is where the solutions of the inequality are.This figure has the graph of a straight horizontal dashed line on the x y-coordinate plane. The x and y axes run from negative 10 to 10. A horizontal dashed line is drawn through the points (negative 1, 5), (0, 5), and (1, 5). The line divides the x y-coordinate plane into two halves. The bottom half is shaded red to indicate that this is where the solutions of the inequality are.


All points in the shaded region, but not those on the boundary line, represent the solutions to y<5.

Try It 3.80 §3.4 source ↗

Graph the linear inequality: y≤−1.

Answer


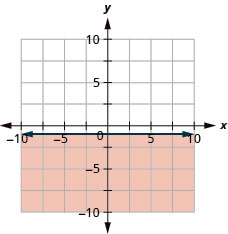
This figure has the graph of a straight horizontal line on the x y-coordinate plane. The x and y axes run from negative 10 to 10. A horizontal line is drawn through the points (negative 1, negative 1), (0, negative 1), and (1, negative 1). The line divides the x y-coordinate plane into two halves. The line and the bottom half are shaded red to indicate that this is where the solutions of the inequality are.


All points in the shaded region and on the boundary line represent the solutions to y≤−1.

Try It 3.81 §3.4 source ↗

Hugh works two part time jobs. One at a grocery store that pays $10 an hour and the other is babysitting for $13 hour. Between the two jobs, Hugh wants to earn at least $260 a week. How many hours does Hugh need to work at each job to earn at least $260?

ⓐ Let x be the number of hours he works at the grocery store and let y be the number of hours he works babysitting. Write an inequality that would model this situation.

ⓑ Graph the inequality.

ⓒ Find three ordered pairs (x, y) that would be solutions to the inequality. Then, explain what that means for Hugh.

Answer

ⓐ 10x+13y≥260
ⓑ

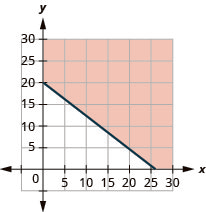
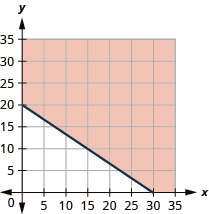
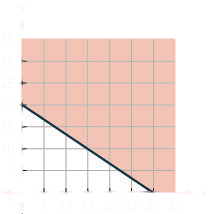
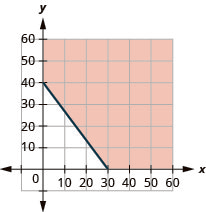
This figure has the graph of a straight line on the x y-coordinate plane. The x and y axes run from 0 to 30. A line is drawn through the points (0, 20), (13, 10), and (26, 0). The line divides the x y-coordinate plane into two halves. The line and the top right half are shaded red to indicate that this is where the solutions of the inequality are.


ⓒ Answers will vary.

Try It 3.82 §3.4 source ↗

Veronica works two part time jobs in order to earn enough money to meet her obligations of at least $280 a week. Her job at the day spa pays $10 an hour and her administrative assistant job on campus pays $17.50 an hour. How many hours does Veronica need to work at each job to earn at least $280?

ⓐ Let x be the number of hours she works at the day spa and let y be the number of hours she works as administrative assistant. Write an inequality that would model this situation.

ⓑ Graph the inequality.

ⓒ Find three ordered pairs (x, y) that would be solutions to the inequality. Then, explain what that means for Veronica

Answer

ⓐ 10x+ 17.5y≥280
ⓑ

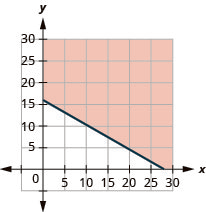
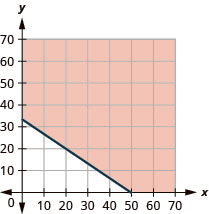
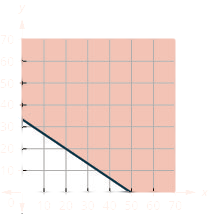
This figure has the graph of a straight line on the x y-coordinate plane. The x and y axes run from 0 to 25. A line is drawn through the points (0, 16) and (28, 0). The line divides the x y-coordinate plane into two halves. The line and the top right half are shaded red to indicate that this is where the solutions of the inequality are.


ⓒ Answers will vary.

3.4-237 §3.4 source ↗

Verify Solutions to an Inequality in Two Variables

In the following exercises, determine whether each ordered pair is a solution to the given inequality.

Determine whether each ordered pair is a solution to the inequality y>x−1:


ⓐ (0,1)
ⓑ (−4,−1)
ⓒ (4,2)
ⓓ (3,0)
ⓔ (−2,−3)

Answer

ⓐ yes ⓑ yes ⓒ no ⓓ no ⓔ no

3.4-239 §3.4 source ↗

Verify Solutions to an Inequality in Two Variables

In the following exercises, determine whether each ordered pair is a solution to the given inequality.

Determine whether each ordered pair is a solution to the inequality y<3x+2:


ⓐ (0,3)
ⓑ (−3,−2)
ⓒ (−2,0)
ⓓ (0,0)
ⓔ (−1,4)

Answer

ⓐ no ⓑ no ⓒ no ⓓ yes ⓔ no

3.4-241 §3.4 source ↗

Verify Solutions to an Inequality in Two Variables

In the following exercises, determine whether each ordered pair is a solution to the given inequality.

Determine whether each ordered pair is a solution to the inequality 3x−4y>4:


ⓐ (5,1)
ⓑ (−2,6)
ⓒ (3,2)
ⓓ (10,−5)
ⓔ (0,0)

Answer

ⓐ yes ⓑ no ⓒ no ⓓ yes ⓔ no

3.4-243 §3.4 source ↗

Recognize the Relation Between the Solutions of an Inequality and its Graph

In the following exercises, write the inequality shown by the shaded region.

Write the inequality shown by the graph with the boundary line y=3x−4.

This figure has the graph of a straight line on the x y-coordinate plane. The x and y axes run from negative 10 to 10. A line is drawn through the points (0, negative 4), (1, negative 1), and (2, 2). The line divides the x y-coordinate plane into two halves. The line and the bottom right half are shaded red to indicate that this is where the solutions of the inequality are.

Answer

y ≤ 3 x − 4

3.4-245 §3.4 source ↗

Recognize the Relation Between the Solutions of an Inequality and its Graph

In the following exercises, write the inequality shown by the shaded region.

Write the inequality shown by the graph with the boundary line y=12x+1.

This figure has the graph of a straight line on the x y-coordinate plane. The x and y axes run from negative 10 to 10. A line is drawn through the points (0, 1), (2, 0), and (4, negative 1). The line divides the x y-coordinate plane into two halves. The line and the bottom right half are shaded red to indicate that this is where the solutions of the inequality are.

Answer

y ≤ 1 2 x + 1

3.4-247 §3.4 source ↗

Recognize the Relation Between the Solutions of an Inequality and its Graph

In the following exercises, write the inequality shown by the shaded region.

Write the inequality shown by the shaded region in the graph with the boundary line x+y=5.
This figure has the graph of a straight line on the x y-coordinate plane. The x and y axes run from negative 10 to 10. A line is drawn through the points (0, 5), (1, 4), and (5, 0). The line divides the x y-coordinate plane into two halves. The line and the top right half are shaded red to indicate that this is where the solutions of the inequality are.

Answer

x + y ≥ 5

3.4-249 §3.4 source ↗

Recognize the Relation Between the Solutions of an Inequality and its Graph

In the following exercises, write the inequality shown by the shaded region.

Write the inequality shown by the shaded region in the graph with the boundary line 3x−y=6.

This figure has the graph of a straight line on the x y-coordinate plane. The x and y axes run from negative 10 to 10. A line is drawn through the points (0, negative 6), (1, negative 3), and (2, 0). The line divides the x y-coordinate plane into two halves. The line and the top left half are shaded red to indicate that this is where the solutions of the inequality are.This figure has the graph of a straight line on the x y-coordinate plane. The x and y axes run from negative 10 to 10. A line is drawn through the points (0, negative 6), (1, negative 3), and (2, 0). The line divides the x y-coordinate plane into two halves. The line and the top left half are shaded red to indicate that this is where the solutions of the inequality are.

Answer

3 x − y ≤ 6

3.4-251 §3.4 source ↗

Graph Linear Inequalities in Two Variables

In the following exercises, graph each linear inequality.

Graph the linear inequality: y>23x−1.

Answer

This figure has the graph of a straight dashed line on the x y-coordinate plane. The x and y axes run from negative 10 to 10. A straight dashed line is drawn through the points (0, negative 1), (3, 1), and (6, 3). The line divides the x y-coordinate plane into two halves. The top left half is shaded red to indicate that this is where the solutions of the inequality are.

3.4-253 §3.4 source ↗

Graph Linear Inequalities in Two Variables

In the following exercises, graph each linear inequality.

Graph the linear inequality: y≤−12x+4.

Answer

This figure has the graph of a straight line on the x y-coordinate plane. The x and y axes run from negative 10 to 10. A line is drawn through the points (0, 4), (2, 3), and (4, 2). The line divides the x y-coordinate plane into two halves. The line and the top right half are shaded red to indicate that this is where the solutions of the inequality are.This figure has the graph of a straight line on the x y-coordinate plane. The x and y axes run from negative 10 to 10. A line is drawn through the points (0, 4), (2, 3), and (4, 2). The line divides the x y-coordinate plane into two halves. The line and the top right half are shaded red to indicate that this is where the solutions of the inequality are.

3.4-255 §3.4 source ↗

Graph Linear Inequalities in Two Variables

In the following exercises, graph each linear inequality.

Graph the linear inequality: x−y≤3.

Answer

This figure has the graph of a straight dashed line on the x y-coordinate plane. The x and y axes run from negative 10 to 10. A straight dashed line is drawn through the points (0, negative 3), (1, negative 2), and (3, 0). The line divides the x y-coordinate plane into two halves. The top left half is shaded red to indicate that this is where the solutions of the inequality are.This figure has the graph of a straight dashed line on the x y-coordinate plane. The x and y axes run from negative 10 to 10. A straight dashed line is drawn through the points (0, negative 3), (1, negative 2), and (3, 0). The line divides the x y-coordinate plane into two halves. The top left half is shaded red to indicate that this is where the solutions of the inequality are.

3.4-257 §3.4 source ↗

Graph Linear Inequalities in Two Variables

In the following exercises, graph each linear inequality.

Graph the linear inequality: 4x+y>−4.

Answer

This figure has the graph of a straight dashed line on the x y-coordinate plane. The x and y axes run from negative 10 to 10. A straight dashed line is drawn through the points (0, negative 4), (negative 1, 0), and (1, negative 8). The line divides the x y-coordinate plane into two halves. The top right half is shaded red to indicate that this is where the solutions of the inequality are.

3.4-259 §3.4 source ↗

Graph Linear Inequalities in Two Variables

In the following exercises, graph each linear inequality.

Graph the linear inequality: 3x+2y≥−6.

Answer

This figure has the graph of a straight dashed line on the x y-coordinate plane. The x and y axes run from negative 10 to 10. A straight dashed line is drawn through the points (0, negative 3), (3, negative 5), and (negative 2, 0). The line divides the x y-coordinate plane into two halves. The top right half is shaded red to indicate that this is where the solutions of the inequality are.This figure has the graph of a straight dashed line on the x y-coordinate plane. The x and y axes run from negative 10 to 10. A straight dashed line is drawn through the points (0, negative 3), (3, negative 5), and (negative 2, 0). The line divides the x y-coordinate plane into two halves. The top right half is shaded red to indicate that this is where the solutions of the inequality are.

3.4-261 §3.4 source ↗

Graph Linear Inequalities in Two Variables

In the following exercises, graph each linear inequality.

Graph the linear inequality: y>4x.

Answer

This figure has the graph of a straight dashed line on the x y-coordinate plane. The x and y axes run from negative 10 to 10. A straight dashed line is drawn through the points (0, 0), (negative 1, negative 4), and (1, 4). The line divides the x y-coordinate plane into two halves. The top left half is shaded red to indicate that this is where the solutions of the inequality are.

3.4-263 §3.4 source ↗

Graph Linear Inequalities in Two Variables

In the following exercises, graph each linear inequality.

Graph the linear inequality: y<−10.

Answer

This figure has the graph of a straight dashed line on the x y-coordinate plane. The x and y axes run from negative 10 to 10. A straight dashed line is drawn through the points (0, 0), (negative 1, 3), and (1, negative 3). The line divides the x y-coordinate plane into two halves. The bottom left half is shaded red to indicate that this is where the solutions of the inequality are.

3.4-265 §3.4 source ↗

Graph Linear Inequalities in Two Variables

In the following exercises, graph each linear inequality.

Graph the linear inequality: x≤5.

Answer

This figure has the graph of a straight vertical dashed line on the x y-coordinate plane. The x and y axes run from negative 10 to 10. A vertical dashed line is drawn through the points (5, negative 1), (5, 0), and (5, 1). The line divides the x y-coordinate plane into two halves. The left half is shaded red to indicate that this is where the solutions of the inequality are.This figure has the graph of a straight vertical dashed line on the x y-coordinate plane. The x and y axes run from negative 10 to 10. A vertical dashed line is drawn through the points (5, negative 1), (5, 0), and (5, 1). The line divides the x y-coordinate plane into two halves. The left half is shaded red to indicate that this is where the solutions of the inequality are.

3.4-267 §3.4 source ↗

Graph Linear Inequalities in Two Variables

In the following exercises, graph each linear inequality.

Graph the linear inequality: x−y<4.

Answer

This figure has the graph of a straight dashed line on the x y-coordinate plane. The x and y axes run from negative 10 to 10. A straight dashed line is drawn through the points (0, negative 4), (1, negative 3), and (4, 0). The line divides the x y-coordinate plane into two halves. The top left half is shaded red to indicate that this is where the solutions of the inequality are.This figure has the graph of a straight dashed line on the x y-coordinate plane. The x and y axes run from negative 10 to 10. A straight dashed line is drawn through the points (0, negative 4), (1, negative 3), and (4, 0). The line divides the x y-coordinate plane into two halves. The top left half is shaded red to indicate that this is where the solutions of the inequality are.

3.4-269 §3.4 source ↗

Graph Linear Inequalities in Two Variables

In the following exercises, graph each linear inequality.

Graph the linear inequality: y≥32x.

Answer

This figure has the graph of a straight dashed line on the x y-coordinate plane. The x and y axes run from negative 10 to 10. A straight dashed line is drawn through the points (0, 0), (2, 3), and (negative 2, negative 3). The line divides the x y-coordinate plane into two halves. The top left half is shaded red to indicate that this is where the solutions of the inequality are.

3.4-271 §3.4 source ↗

Graph Linear Inequalities in Two Variables

In the following exercises, graph each linear inequality.

Graph the linear inequality: y>−2x+1.

Answer

This figure has the graph of a straight dashed line on the x y-coordinate plane. The x and y axes run from negative 10 to 10. A straight dashed line is drawn through the points (0, 1), (1, negative 1), and (2, negative 3). The line divides the x y-coordinate plane into two halves. The top right half is shaded red to indicate that this is where the solutions of the inequality are.

3.4-273 §3.4 source ↗

Graph Linear Inequalities in Two Variables

In the following exercises, graph each linear inequality.

Graph the linear inequality: 2x+y≥−4.

Answer

This figure has the graph of a straight line on the x y-coordinate plane. The x and y axes run from negative 10 to 10. A line is drawn through the points (0, negative 4), (1, negative 6), and (negative 2, 0). The line divides the x y-coordinate plane into two halves. The line and the bottom left half are shaded red to indicate that this is where the solutions of the inequality are.This figure has the graph of a straight line on the x y-coordinate plane. The x and y axes run from negative 10 to 10. A line is drawn through the points (0, negative 4), (1, negative 6), and (negative 2, 0). The line divides the x y-coordinate plane into two halves. The line and the bottom left half are shaded red to indicate that this is where the solutions of the inequality are.

3.4-275 §3.4 source ↗

Graph Linear Inequalities in Two Variables

In the following exercises, graph each linear inequality.

Graph the linear inequality: 2x− 5y> 10.

Answer

This figure has the graph of a straight line on the x y-coordinate plane. The x and y axes run from negative 10 to 10. A line is drawn through the points (0, negative 2), (5, 0), and (negative 5, negative 4). The line divides the x y-coordinate plane into two halves. The line and the bottom right half are shaded red to indicate that this is where the solutions of the inequality are.

3.4-277 §3.4 source ↗

Solve Applications using Linear Inequalities in Two Variables

Harrison works two part time jobs. One at a gas station that pays $11 an hour and the other is IT troubleshooting for $16.50 an hour. Between the two jobs, Harrison wants to earn at least $330 a week. How many hours does Harrison need to work at each job to earn at least $330?

ⓐ Let x be the number of hours he works at the gas station and let y be the number of (hours he works troubleshooting. Write an inequality that would model this situation.

ⓑ Graph the inequality.

ⓒ Find three ordered pairs (x,y) that would be solutions to the inequality. Then, explain what that means for Harrison.

Answer

ⓐ 11x+ 16.5y≥330
ⓑ

This figure has the graph of a straight line on the x y-coordinate plane. The x and y axes run from 0 to 35. A line is drawn through the points (0, 20), (15, 10), and (30, 0). The line divides the x y-coordinate plane into two halves. The line and the top right half are shaded red to indicate that this is where the solutions of the inequality are.This figure has the graph of a straight line on the x y-coordinate plane. The x and y axes run from 0 to 35. A line is drawn through the points (0, 20), (15, 10), and (30, 0). The line divides the x y-coordinate plane into two halves. The line and the top right half are shaded red to indicate that this is where the solutions of the inequality are.


ⓒ Answers will vary.

3.4-279 §3.4 source ↗

Solve Applications using Linear Inequalities in Two Variables

The doctor tells Laura she needs to exercise enough to burn 500 calories each day. She prefers to either run or bike and burns 15 calories per minute while running and 10 calories a minute while biking.

ⓐ If x is the number of minutes that Laura runs and y is the number minutes she bikes, find the inequality that models the situation.

ⓑ Graph the inequality.

ⓒ List three solutions to the inequality. What options do the solutions provide Laura?

Answer

ⓐ 15x+10y≥500
ⓑ

This figure has the graph of a straight line on the x y-coordinate plane. The x and y axes run from 0 to 70. A line is drawn through the points (0, 50) and (34, 0). The line divides the x y-coordinate plane into two halves. The line and the top right half are shaded red to indicate that this is where the solutions of the inequality are.This figure has the graph of a straight line on the x y-coordinate plane. The x and y axes run from 0 to 70. A line is drawn through the points (0, 50) and (34, 0). The line divides the x y-coordinate plane into two halves. The line and the top right half are shaded red to indicate that this is where the solutions of the inequality are.


ⓒ Answers will vary.

3.4-281 §3.4 source ↗

Solve Applications using Linear Inequalities in Two Variables

Lester thinks that the solution of any inequality with a > sign is the region above the line and the solution of any inequality with a < sign is the region below the line. Is Lester correct? Explain why or why not.

Answer

Answers will vary.

Be Prepared 3.13 §3.5 source ↗

Evaluate 3x−5 when x=−2.
If you missed this problem, review Example 1.6.
Example 1.6 in the book ↗

Answer

− 11

Be Prepared 3.14 §3.5 source ↗

Evaluate 2x2−x−3 when x=a.
If you missed this problem, review Example 1.6.
Example 1.6 in the book ↗

Answer

2 a 2 − a − 3

Be Prepared 3.15 §3.5 source ↗

Simplify: 7x−1−4x+5.
If you missed this problem, review Example 1.7.
Example 1.7 in the book ↗

Answer

3 x + 4

Try It 3.83 §3.5 source ↗

For the relation {(1,1),(2,8),(3,27),(4,64),(5,125)}:

ⓐ Find the domain of the relation.

ⓑ Find the range of the relation.

Answer

ⓐ {1,2,3,4,5}
ⓑ {1,8,27,64,125}

Try It 3.84 §3.5 source ↗

For the relation {(1,3),(2,6),(3,9),(4,12),(5,15)}:

ⓐ Find the domain of the relation.

ⓑ Find the range of the relation.

Answer

ⓐ {1,2,3,4,5}
ⓑ {3,6,9,12,15}

Try It 3.85 §3.5 source ↗

Use the mapping of the relation shown to ⓐ list the ordered pairs of the relation ⓑ find the domain of the relation ⓒ find the range of the relation.

This figure shows two table that each have one column. The table on the left has the header “Name” and lists the names “Khanh Nguyen”, “Abigail Brown”, “Sumantha Mishal”, and “Jose Hern and ez”. The table on the right has the header “Student ID #” and lists the codes “a b 56781”, “j h 47983”, “k n 68413”, and “s m 32479”. There is one arrow for each name in the Name table that starts at the name and points toward a code in the student ID table. The first arrow goes from Khanh Nguyen to k n 68413. The second arrow goes from Abigail Brown to a b 56781. The third arrow goes from Sumantha Mishal to s m 32479. The fourth arrow goes from Jose Hern and ez to j h 47983.

Answer

ⓐ (Khanh Nguyen, kn68413), (Abigail Brown, ab56781), (Sumantha Mishal, sm32479), (Jose Hern and ez, jh47983) ⓑ {Khanh Nguyen, Abigail Brown, Sumantha Mishal, Jose Hern and ez} ⓒ {kn68413, ab56781, sm32479, jh47983}

Try It 3.86 §3.5 source ↗

Use the mapping of the relation shown to ⓐ list the ordered pairs of the relation ⓑ find the domain of the relation ⓒ find the range of the relation.

This figure shows two table that each have one column. The table on the left has the header “Name” and lists the names “Maria”, “Arm and o”, “Cynthia”, “Kelly”, and “Rachel”. The table on the right has the header “Birthday” and lists the dates “January 18”, “March 15”, “November 6”, and “December 8”. There is one arrow for each name in the Name table that starts at the name and points toward a date in the Birthday table. The first arrow goes from Maria to November 6. The second arrow goes from Arm and o to a January 18. The third arrow goes from Cynthia to December 8. The fourth arrow goes from Kelly to March 15. The fifth arrow goes from Rachel to November 6.

Answer

ⓐ (Maria, November 6), (Arm and o, January 18), (Cynthia, December 8), (Kelly, March 15), (Rachel, November 6) ⓑ {Maria, Arm and o, Cynthia, Kelly, Rachel} ⓒ {November 6, January 18, December 8, March 15}

Try It 3.87 §3.5 source ↗

Use the graph of the relation to ⓐ list the ordered pairs of the relation ⓑ find the domain of the relation ⓒ find the range of the relation.

The figure shows the graph of some points on the x y-coordinate plane. The x and y-axes run from negative 6 to 6. The points (negative 3, 3), (negative 2, 2), (negative 1, 0), (0, negative 1), (2, negative 2), and (4, negative 4).

Answer

ⓐ (−3,3), (−2,2), (−1,0),
(0,−1), (2,−2), (4,−4)
ⓑ {−3,−2,−1,0,2,4}
ⓒ {3,2,0,−1,−2,−4}

Try It 3.88 §3.5 source ↗

Use the graph of the relation to ⓐ list the ordered pairs of the relation ⓑ find the domain of the relation ⓒ find the range of the relation.

The figure shows the graph of some points on the x y-coordinate plane. The x and y-axes run from negative 6 to 6. The points (negative 3, 5), (negative 3, 0), (negative 3, negative 6), (negative 1, negative 2), (1, 2), and (4, negative 4).

Answer

ⓐ (−3,0), (−3,5), (−3,−6),
(−1,−2), (1,2), (4,−4)
ⓑ {−3,−1,1,4}
ⓒ {−6,0,5,−2,2,−4}

Try It 3.89 §3.5 source ↗

Use the set of ordered pairs to (i) determine whether the relation is a function (ii) find the domain of the relation (iii) find the range of the function.

ⓐ {(−3,−6),(−2,−4),(−1,−2),(0,0),(1,2),(2,4),(3,6)}

ⓑ {(8,−4),(4,−2),(2,−1),(0,0),(2,1),(4,2),(8,4)}

Answer

ⓐ Yes; {−3,−2,−1,0,1,2,3};
{−6,−4,−2,0,2,4,6}
ⓑ No; {0,2,4,8};
{−4,−2,−1,0,1,2,4}

Try It 3.90 §3.5 source ↗

Use the set of ordered pairs to (i) determine whether the relation is a function (ii) find the domain of the relation (iii) find the range of the relation.

ⓐ {(27,−3),(8,−2),(1,−1),(0,0),(1,1),(8,2),(27,3)}

ⓑ {(7,−3),(−5,−4),(8,0),(0,0),(−6,4),(−2,2),(−1,3)}

Answer

ⓐ No; {0,1,8,27};
{−3,−2,−1,0,2,2,3}
ⓑ Yes; {7,−5,8,0,−6,−2,−1};
{−3,−4,0,4,2,3}

Try It 3.91 §3.5 source ↗

Use the mapping to ⓐ determine whether the relation is a function ⓑ find the domain of the relation ⓒ find the range of the relation.

This figure shows two table that each have one column. The table on the left has the header “Network” and lists the television stations “NBC”, “HGTV”, and “HBO”. The table on the right has the header “Program” and lists the television shows “Ellen Degeneres Show”, “Law and Order”, “Tonight Show”, “Property Brothers”, “House Hunters”, “Love it or List it”, “Game of Thrones”, “True Detective”, and “Sesame Street”. There are arrows that start at a network in the first table and point toward a program in the second table. The first arrow goes from NBC to Ellen Degeneres Show. The second arrow goes from NBC to Law and Order. The third arrow goes from NBC to Tonight Show. The fourth arrow goes from HGTV to Property Brothers. The fifth arrow goes from HGTV to House Hunters. The sixth arrow goes from HGTV to Love it or List it. The seventh arrow goes from HBO to Game of Thrones. The eighth arrow goes from HBO to True Detective. The ninth arrow goes from HBO to Sesame Street.

Answer

ⓐ no ⓑ {NBC, HGTV, HBO} ⓒ {Ellen Degeneres Show, Law and Order, Tonight Show, Property Brothers, House Hunters, Love it or List it, Game of Thrones, True Detective, Sesame Street}

Try It 3.92 §3.5 source ↗

Use the mapping to ⓐ determine whether the relation is a function ⓑ find the domain of the relation ⓒ find the range of the relation.

This figure shows two table that each have one column. The table on the left has the header “Name” and lists the names “Neal”, “Krystal”, “Kelvin”, “George”, “Christa”, and “Mike”. The table on the right has the header “Phone number” and lists the numbers “123-567-4389 work”, “231-378-5941 cell”, “753-469-9731 cell”, “567-534-2970 work”, “684-369-7231 cell”, “798-367-8541 cell”, and “639-847-6971 cell”. There are arrows that start at a name and points toward a number in the phone number table. The first arrow goes from Neal to 753-469-9731 cell. The second arrow goes from Krystal to a 684-369-7231 cell. The third arrow goes from Kelvin to 231-378-5941 cell. The fourth arrow goes from George to 123-567-4389 work. The fifth arrow goes from George to 639-847-6971 cell. The sixth arrow goes from Christa to 567-534-2970 work. The seventh arrow goes from Mike to 567-534-2970 work. The eighth arrow goes from Mike to 798-367-8541 cell.

Answer

ⓐ No ⓑ {Neal, Krystal, Kelvin, George, Christa, Mike} ⓒ {123-567-4839 work, 231-378-5941 cell, 743-469-9731 cell, 567-534-2970 work, 684-369-7231 cell, 798-367-8541 cell, 639-847-6971 cell}

Try It 3.93 §3.5 source ↗

Determine whether each equation is a function.

ⓐ 4x+y=−3 ⓑ x+y2=1 ⓒ y−x2=2

Answer

ⓐ yes ⓑ no ⓒ yes

Try It 3.94 §3.5 source ↗

Determine whether each equation is a function.

ⓐ x+y2=4 ⓑ y=x2−7 ⓒ y=5x−4

Answer

ⓐ no ⓑ yes ⓒ yes

Try It 3.95 §3.5 source ↗

For the function f(x)= 3x2− 2x+ 1, evaluate the function.

ⓐ f(3) ⓑ f(−1) ⓒ f(t)

Answer

ⓐ f(3)=22 ⓑ f(−1)=6 ⓒ f(t)= 3t2− 2t+ 1

Try It 3.96 §3.5 source ↗

For the function f(x)= 2x2+ 4x− 3, evaluate the function.

ⓐ f(2) ⓑ f(−3) ⓒ f(h)

Answer

ⓐ (2)=13 ⓑ f(−3)=3
ⓒ f(h)= 2h2+ 4h− 3

Try It 3.97 §3.5 source ↗

For the function g(x)=4x−7, evaluate the function.

ⓐ g(m2) ⓑ g(x−3) ⓒ g(x)−g(3)

Answer

ⓐ 4m2−7 ⓑ 4x−19
ⓒ 4x−12

Try It 3.98 §3.5 source ↗

For the function h(x)=2x+1, evaluate the function.

ⓐ h(k2) ⓑ h(x+1) ⓒ h(x)+h(1)

Answer

ⓐ 2k2+1 ⓑ 2x+3
ⓒ 2x+4

Try It 3.99 §3.5 source ↗

The number of unread emails in Bryan’s account is 100. This number grows by 15 unread emails a day. The function N(t)= 100+ 15t represents the relation between the number of emails, N, and the time, t, measured in days.

ⓐ Determine the independent and dependent variable.

ⓑ Find N(7). Explain what this result means.

Answer

ⓐ t IND; N DEP ⓑ 205; the number of unread emails in Bryan’s account on the seventh day.

Try It 3.100 §3.5 source ↗

The number of unread emails in Anthony’s account is 110. This number grows by 25 unread emails a day. The function N(t)= 110+ 25t represents the relation between the number of emails, N, and the time, t, measured in days.

ⓐ Determine the independent and dependent variable.

ⓑ Find N(14). Explain what this result means.

Answer

ⓐ t IND; N DEP ⓑ 460; the number of unread emails in Anthony’s account on the fourteenth day

3.5-283 §3.5 source ↗

Find the Domain and Range of a Relation

In the following exercises, for each relation ⓐ find the domain of the relation ⓑ find the range of the relation.

{ ( 1 , 4 ) , ( 2 , 8 ) , ( 3 , 12 ) , ( 4 , 16 ) , ( 5 , 20 ) }

Answer

ⓐ {1, 2, 3, 4, 5} ⓑ {4, 8, 12, 16, 20}

3.5-285 §3.5 source ↗

Find the Domain and Range of a Relation

In the following exercises, for each relation ⓐ find the domain of the relation ⓑ find the range of the relation.

{ ( 1 , 7 ) , ( 5 , 3 ) , ( 7 , 9 ) , ( −2 , −3 ) , ( −2 , 8 ) }

Answer

ⓐ {1, 5, 7, −2} ⓑ {7, 3, 9, −3, 8}

3.5-287 §3.5 source ↗

In the following exercises, use the mapping of the relation to ⓐ list the ordered pairs of the relation, ⓑ find the domain of the relation, and ⓒ find the range of the relation.


This figure shows two table that each have one column. The table on the left has the header “Name” and lists the names “Rebecca”, “Jennifer”, “John”, “Hector”, “Luis”, “Ebony”, “Raphael”, “Meredith”, “Karen”, and “Joseph”. The table on the right has the header “Birthday” and lists the dates “January 18”, “February 15”, “April 1”, “April 7”, “June 23”, “July 30”, “August 19”, and “November 6”. There are arrows starting at names in the Name table and pointing towards dates in the Birthday table. The first arrow goes from Rebecca to January 18. The second arrow goes from Jennifer to April 1. The third arrow goes from John to January 18. The fourth arrow goes from Hector to June 23. The fifth arrow goes from Luis to February 15. The sixth arrow goes from Ebony to April 7. The seventh arrow goes from Raphael to November 6. The eighth arrow goes from Meredith to August 19. The ninth arrow goes from Karen to August 19. The tenth arrow goes from Joseph to July 30.

Answer

ⓐ (Rebecca, January 18), (Jennifer, April 1), (John, January 18), (Hector, June 23), (Luis, February 15), (Ebony, April 7), (Raphael, November 6), (Meredith, August 19), (Karen, August 19), (Joseph, July 30)
ⓑ {Rebecca, Jennifer, John, Hector, Luis, Ebony, Raphael, Meredith, Karen, Joseph}
ⓒ {January 18, April 1, June 23, February 15, April 7, November 6, August 19, July 30}

3.5-289 §3.5 source ↗

In the following exercises, use the mapping of the relation to ⓐ list the ordered pairs of the relation, ⓑ find the domain of the relation, and ⓒ find the range of the relation.

For a woman of height 5′4″ the mapping below shows the corresponding Body Mass Index (BMI). The body mass index is a measurement of body fat based on height and weight. A BMI of 18.5–24.9 is considered healthy.

This figure shows two table that each have one column. The table on the left has the header “Weight (lbs)” and lists the numbers plus 100, 110, 120, 130, 140, 150, and 160. The table on the right has the header “BMI” and lists the numbers 18. 9, 22. 3, 17. 2, 24. 0, 25. 7, 20. 6, and 27. 5. There are arrows starting at numbers in the weight table and pointing towards numbers in the BMI table. The first arrow goes from plus 100 to 17. 2. The second arrow goes from 110 to 18. 9. The third arrow goes from 120 to 20. 6. The fourth arrow goes from 130 to 22. 3. The fifth arrow goes from 140 to 24. 0. The sixth arrow goes from 150 to 25. 7. The seventh arrow goes from 160 to 27. 5.

Answer

ⓐ (+100, 17. 2), (110, 18.9), (120, 20.6), (130, 22.3), (140, 24.0), (150, 25.7), (160, 27.5) ⓑ {+100, 110, 120, 130, 140, 150, 160,} ⓒ {17.2, 18.9, 20.6, 22.3, 24.0, 25.7, 27.5}

3.5-291 §3.5 source ↗

In the following exercises, use the graph of the relation to ⓐ list the ordered pairs of the relation ⓑ find the domain of the relation ⓒ find the range of the relation.


The figure shows the graph of some points on the x y-coordinate plane. The x and y-axes run from negative 6 to 6. The points (negative 3, 4), (negative 3, negative 1), (0, negative 3), (2, 3), (4, negative 1), and (4, negative 3).

Answer

ⓐ (2, 3), (4, −3), (−2, −1), (−3, 4), (4, −1), (0, −3) ⓑ {−3, −2, 0, 2, 4}
ⓒ {−3, −1, 3, 4}

3.5-293 §3.5 source ↗

In the following exercises, use the graph of the relation to ⓐ list the ordered pairs of the relation ⓑ find the domain of the relation ⓒ find the range of the relation.


The figure shows the graph of some points on the x y-coordinate plane. The x and y-axes run from negative 6 to 6. The points (negative 1, 4), (negative 1, negative 4), (0, 3), (0, negative 3), (1, 4), and (1, negative 4).

Answer

ⓐ (1, 4), (1, −4), (−1, 4), (−1, −4), (0, 3), (0, −3) ⓑ {−1, 0, 1} ⓒ {−4, −3, 3,4}

3.5-295 §3.5 source ↗

Determine if a Relation is a Function

In the following exercises, use the set of ordered pairs to ⓐ determine whether the relation is a function, ⓑ find the domain of the relation, and ⓒ find the range of the relation.

{ ( −3 , 9 ) , ( −2 , 4 ) , ( −1 , 1 ) ,
(0,0), (1,1), (2,4), (3,9)}

Answer

ⓐ yes ⓑ {−3, −2, −1, 0, 1, 2, 3} ⓒ {9, 4, 1, 0}

3.5-297 §3.5 source ↗

Determine if a Relation is a Function

In the following exercises, use the set of ordered pairs to ⓐ determine whether the relation is a function, ⓑ find the domain of the relation, and ⓒ find the range of the relation.

{ ( −3 , 27 ) , ( −2 , 8 ) , ( −1 , 1 ) ,
(0,0), (1,1), (2,8), (3,27)}

Answer

ⓐ yes ⓑ {−3, −2, −1, 0, 1, 2, 3} ⓒ 0, 1, 8, 27}

3.5-299 §3.5 source ↗

In the following exercises, use the mapping to ⓐ determine whether the relation is a function, ⓑ find the domain of the function, and ⓒ find the range of the function.


This figure shows two table that each have one column. The table on the left has the header “Number” and lists the numbers negative 3, negative 2, negative 1, 0, 1, 2, and 3. The table on the right has the header “Absolute Value” and lists the numbers 0, 1, 2, and 3. There are arrows starting at numbers in the number table and pointing towards numbers in the absolute value table. The first arrow goes from negative 3 to 3. The second arrow goes from negative 2 to 2. The third arrow goes from negative 1 to 1. The fourth arrow goes from 0 to 0. The fifth arrow goes from 1 to 1. The sixth arrow goes from 2 to 2. The seventh arrow goes from 3 to 3.

Answer

ⓐ yes ⓑ {−3, −2, −1, 0, 1, 2, 3} ⓒ {0, 1, 2, 3}

3.5-301 §3.5 source ↗

In the following exercises, use the mapping to ⓐ determine whether the relation is a function, ⓑ find the domain of the function, and ⓒ find the range of the function.


This figure shows two table that each have one column. The table on the left has the header “Name” and lists the names “Jenny”, “R and y”, “Dennis”, “Emily”, and “Raul”. The table on the right has the header “Email” and lists the email addresses RHern and ez@state. edu, JKim@gmail.com, Raul@gmail.com, ESmith@state. edu, DBrown@aol.com, jenny@aol.com, and R and y@gmail.com. There are arrows starting at names in the name table and pointing towards addresses in the email table. The first arrow goes from Jenny to JKim@gmail.com. The second arrow goes from Jenny to jenny@aol.com. The third arrow goes from R and y to R and y@gmail.com. The fourth arrow goes from Dennis to DBrown@aol.com. The fifth arrow goes from Emily to ESmith@state. edu. The sixth arrow goes from Raul to RHern and ez@state. edu. The seventh arrow goes from Raul to Raul@gmail.com.

Answer

ⓐ no ⓑ {Jenny, R and y, Dennis, Emily, Raul} ⓒ {RHern and ez@state.edu, JKim@gmail.com, Raul@gmail.com, ESmith@state.edu, DBroen@aol.com, jenny@aol.cvom, R and y@gmail.com}

3.5-303 §3.5 source ↗

In the following exercises, determine whether each equation is a function.


ⓐ 2x+y=−3
ⓑ y=x2
ⓒ x+y2=−5

Answer

ⓐ yes ⓑ yes ⓒ no

3.5-305 §3.5 source ↗

In the following exercises, determine whether each equation is a function.


ⓐ y−3x3=2
ⓑ x+y2=3
ⓒ 3x−2y=6

Answer

ⓐ yes ⓑ no ⓒ yes

3.5-307 §3.5 source ↗

Find the Value of a Function

In the following exercises, evaluate the function: ⓐ f(2) ⓑ f(−1) ⓒ f(a).

f ( x ) = 5 x − 3

Answer

ⓐ f(2)=7 ⓑ f(−1)=−8 ⓒ f(a)=5a−3

3.5-309 §3.5 source ↗

Find the Value of a Function

In the following exercises, evaluate the function: ⓐ f(2) ⓑ f(−1) ⓒ f(a).

f ( x ) = −4 x + 2

Answer

ⓐ f(2)=−6 ⓑ f(−1)=6 ⓒ f(a)=−4a+2

3.5-311 §3.5 source ↗

Find the Value of a Function

In the following exercises, evaluate the function: ⓐ f(2) ⓑ f(−1) ⓒ f(a).

f ( x ) = x 2 − x + 3

Answer

ⓐ f(2)=5 ⓑ f(−1)=5
ⓒ f(a)=a2−a+3

3.5-313 §3.5 source ↗

Find the Value of a Function

In the following exercises, evaluate the function: ⓐ f(2) ⓑ f(−1) ⓒ f(a).

f(x)= 2 x 2 − x+ 3

Answer

ⓐ f(2)=9 ⓑ f(−1)=6
ⓒ f(a)= 2a2− a+ 3

3.5-315 §3.5 source ↗

In the following exercises, evaluate the function: ⓐ g(h2) ⓑ g(x+2) ⓒ g(x)+g(2).

g ( x ) = 2 x + 1

Answer

ⓐ g(h2)=2h2+1
ⓑ g(x+2)=2x+5
ⓒ g(x)+ g(2)= 2x+ 6

3.5-317 §3.5 source ↗

In the following exercises, evaluate the function: ⓐ g(h2) ⓑ g(x+2) ⓒ g(x)+g(2).

g ( x ) = −3 x − 2

Answer

ⓐ g(h2)= −3h2− 2
ⓑ g(x+2)= −3x− 8
ⓒ g(x)+ g(2)= −3x− 10

3.5-319 §3.5 source ↗

In the following exercises, evaluate the function: ⓐ g(h2) ⓑ g(x+2) ⓒ g(x)+g(2).

g ( x ) = 3 − x

Answer

ⓐ g(h2)=3−h2
ⓑ g(x+2)=1−x
ⓒ g(x)+ g(2)= 4− x

3.5-321 §3.5 source ↗

In the following exercises, evaluate the function.

f(x)= 3x2− 5x; f(2)

Answer

2

3.5-323 §3.5 source ↗

In the following exercises, evaluate the function.

F(x)= 2 x 2 − 3x+ 1;
F ( −1 )

Answer

6

3.5-325 §3.5 source ↗

In the following exercises, evaluate the function.

h(t)= 2|t− 5|+ 4; h(−4)

Answer

22

3.5-327 §3.5 source ↗

In the following exercises, evaluate the function.

f(x)= x+2x−1; f(2)

Answer

4

3.5-329 §3.5 source ↗

In the following exercises, solve.

The number of unwatched shows in Sylvia’s DVR is 85. This number grows by 20 unwatched shows per week. The function N(t)=85+20t represents the relation between the number of unwatched shows, N, and the time, t, measured in weeks.

ⓐ Determine the independent and dependent variable.

ⓑ Find N(4). Explain what this result means

Answer

ⓐ t IND; N DEP
ⓑ N(4)=165 the number of unwatched shows in Sylvia’s DVR at the fourth week.

3.5-331 §3.5 source ↗

In the following exercises, solve.

The daily cost to the printing company to print a book is modeled by the function C(x)= 3.25x+ 1500 where C is the total daily cost in dollars and x is the number of books printed.

ⓐ Determine the independent and dependent variable.

ⓑ Find C(0). Explain what this result means.

ⓒ Find C(1000). Explain what this result means.

Answer

ⓐ x IND; C DEP
ⓑ N(0)=1500 the daily cost if no books are printed
ⓒ N(1000)= 4750 the daily cost of printing 1000 books

Be Prepared 3.16 §3.6 source ↗

Evaluate: ⓐ 23 ⓑ 32.
If you missed this problem, review Example 1.5.
Example 1.5 in the book ↗

Answer

ⓐ 8; ⓑ 9

Be Prepared 3.17 §3.6 source ↗

Evaluate: ⓐ |7| ⓑ |−3|.
If you missed this problem, review Example 1.14.
Example 1.14 in the book ↗

Answer

ⓐ 7; ⓑ 3

Be Prepared 3.18 §3.6 source ↗

Evaluate: ⓐ 4 ⓑ 16.
If you missed this problem, review Example 1.41.
Example 1.41 in the book ↗

Answer

ⓐ 2; ⓑ 4

Try It 3.101 §3.6 source ↗

Determine whether each graph is the graph of a function.

The figure has two graphs. In graph a there is a parabola opening up graphed on the x y-coordinate plane. The x-axis runs from negative 6 to 6. The y-axis runs from negative 2 to 10. The parabola goes through the points (0, negative 1), (negative 1, 0), (1, 0), (negative 2, 3), and (2, 3). In graph b there is a circle graphed on the x y-coordinate plane. The x-axis runs from negative 6 to 6. The y-axis runs from negative 6 to 6. The circle goes through the points (negative 2, 0), (2, 0), (0, negative 2), and (0, 2).

Answer

ⓐ yes ⓑ no

Try It 3.102 §3.6 source ↗

Determine whether each graph is the graph of a function.

The figure has two graphs. In graph a there is an ellipse graphed on the x y-coordinate plane. The x-axis runs from negative 6 to 6. The y-axis runs from negative 6 to 6. The ellipse goes through the points (0, negative 3), (negative 2, 0), (2, 0), and (0, 3). In graph b there is a straight line graphed on the x y-coordinate plane. The x-axis runs from negative 12 to 12. The y-axis runs from negative 12 to 12. The line goes through the points (0, negative 2), (2, 0), and (4, 2).

Answer

ⓐ no ⓑ yes

Try It 3.103 §3.6 source ↗

Graph: f(x)=−3x−1

Answer


The figure has the graph of a linear function on the x y-coordinate plane. The x and y-axes run from negative 6 to 6. The line goes through the points (1, negative 4), (0, negative 1), and (negative 1, 2).

Try It 3.104 §3.6 source ↗

Graph: f(x)=−4x−5

Answer


The figure has the graph of a linear function on the x y-coordinate plane. The x and y-axes run from negative 6 to 6. The line goes through the points (negative 2, 3), (0, negative 5), and (negative 1, negative 1).

Try It 3.105 §3.6 source ↗

Graph: f(x)=−2.

Answer


The figure has the graph of a constant function on the x y-coordinate plane. The x-axis runs from negative 12 to 12. The y-axis runs from negative 12 to 12. The line goes through the points (0, negative 2), (1, negative 2), and (2, negative 2).

Try It 3.106 §3.6 source ↗

Graph: f(x)=3.

Answer


The figure has the graph of a constant function on the x y-coordinate plane. The x-axis runs from negative 12 to 12. The y-axis runs from negative 12 to 12. The line goes through the points (0, 3), (1, 3), and (2, 3).

Try It 3.107 §3.6 source ↗

Graph: f(x)=x2.

Answer


This figure has a graph next to a table. In the graph there is a parabola opening up graphed on the x y-coordinate plane. The x-axis runs from negative 6 to 6. The y-axis runs from negative 4 to 8. The parabola goes through the points (negative 2, 4), (negative 1, 1), (0, 0), (1, 1), and (2, 4).

Try It 3.108 §3.6 source ↗

f(x)=−x2

Answer


This figure has a graph next to a table. In the graph there is a parabola opening up graphed on the x y-coordinate plane. The x-axis runs from negative 6 to 6. The y-axis runs from negative 4 to 8. The parabola goes through the points (negative 2, negative 4), (negative 1, negative 1), (0, 0), (1, negative 1), and (2, negative 4).

Try It 3.109 §3.6 source ↗

Graph: f(x)=x3.

Answer


This figure has a curved line graphed on the x y-coordinate plane. The x-axis runs from negative 6 to 6. The y-axis runs from negative 6 to 6. The curved line goes through the points (negative 2, negative 8), (negative 1, negative 1), (0, 0), (1, 1), and (2, 8).

Try It 3.110 §3.6 source ↗

Graph: f(x)=−x3.

Answer


This figure has a curved line graphed on the x y-coordinate plane. The x-axis runs from negative 6 to 6. The y-axis runs from negative 6 to 6. The curved line goes through the points (negative 2, 8), (negative 1, 1), (0, 0), (1, negative 1), and (2, negative 8).

Try It 3.111 §3.6 source ↗

Graph: f(x)=x.

Answer


This figure has a curved half-line graphed on the x y-coordinate plane. The x-axis runs from 0 to 10. The y-axis runs from 0 to 10. The curved half-line starts at the point (0, 0) and then goes up and to the right. The curved half line goes through the points (1, 1), (4, 2), and (9, 3).

Try It 3.112 §3.6 source ↗

Graph: f(x)=−x.

Answer


This figure has a curved half-line graphed on the x y-coordinate plane. The x-axis runs from 0 to 10. The y-axis runs from negative 10 to 0. The curved half-line starts at the point (0, 0) and then goes down and to the right. The curved half line goes through the points (1, negative 1), (4, negative 2), and (9, negative 3).

Try It 3.113 §3.6 source ↗

Graph: f(x)=|x|.

Answer


This figure has a v-shaped line graphed on the x y-coordinate plane. The x-axis runs from negative 6 to 6. The y-axis runs from negative 2 to 10. The v-shaped line goes through the points (negative 3, 3), (negative 2, 2), (negative 1, 1), (0, 0), (1, 1), (2, 2), and (3, 3).

Try It 3.114 §3.6 source ↗

Graph: f(x)=−|x|.

Answer


This figure has a v-shaped line graphed on the x y-coordinate plane. The x-axis runs from negative 6 to 6. The y-axis runs from negative 8 to 4. The v-shaped line goes through the points (negative 3, negative 3), (negative 2, negative 2), (negative 1, negative 1), (0, 0), (1, negative 1), (2, negative 2), and (3, negative 3).

Try It 3.115 §3.6 source ↗

Use the graph of the function to find its domain and range. Write the domain and range in interval notation.

This figure has a curved line segment graphed on the x y-coordinate plane. The x-axis runs from negative 6 to 6. The y-axis runs from negative 6 to 6. The curved line segment goes through the points (negative 5, negative 4), (0, negative 3), and (1, 2). The interval [negative 5, 1] is marked on the horizontal axis. The interval [negative 4, 2] is marked on the vertical axis.

Answer

The domain is [−5,1]. The range is [−4,2].

Try It 3.116 §3.6 source ↗

Use the graph of the function to find its domain and range. Write the domain and range in interval notation.

This figure has a curved line segment graphed on the x y-coordinate plane. The x-axis runs from negative 4 to 5. The y-axis runs from negative 6 to 4. The curved line segment goes through the points (negative 2, 1), (0, 3), and (4, negative 5). The interval [negative 2, 4] is marked on the horizontal axis. The interval [negative 5, 3] is marked on the vertical axis.

Answer

The domain is [−2,4]. The range is [−5,3].

Try It 3.117 §3.6 source ↗

Use the graph of the function to find the indicated values.

This figure has a wavy curved line graphed on the x y-coordinate plane. The x-axis runs from negative 2 times pi to 2 times pi. The y-axis runs from negative 6 to 6. The curved line segment goes through the points (negative 2 times pi, 0), (negative 3 divided by 2 times pi, 2), (negative pi, 0), (negative 1 divided by 2 times pi, negative 2), (0, 0), (1 divided by 2 times pi, 2), (pi, 0), (3 divided by 2 times pi, negative 2), and (2 times pi, 0). The points (negative 3 divided by 2 times pi, 2) and (1 divided by 2 times pi, 2) are the highest points on the graph. The points (negative 1 divided by 2 times pi, negative 2) and (3 divided by 2 times pi, negative 2) are the lowest points on the graph. The line extends infinitely to the left and right.

ⓐ Find: f(0).
ⓑ Find: f(12π).
ⓒ Find: f(−32π).
ⓓ Find the values for x in [-2π,2π] when f(x)=0.
ⓔ Find the x-intercepts.
ⓕ Find the y-intercepts.
ⓖ Find the domain. Write it in interval notation.
ⓗ Find the range. Write it in interval notation.

Answer

ⓐ f(0)=0 ⓑ f=(π2)=2 ⓒ f=(−3π2)=2 ⓓ f(x)=0 for x= −2π, −π, 0, π, 2π ⓔ (−2π,0), (−π,0), (0,0), (π,0), (2π,0) ⓕ (0,0) ⓖ (−∞,∞) ⓗ [−2,2]

Try It 3.118 §3.6 source ↗

Use the graph of the function to find the indicated values.

This figure has a wavy curved line graphed on the x y-coordinate plane. The x-axis runs from negative 2 times pi to 2 times pi. The y-axis runs from negative 6 to 6. The curved line segment goes through the points (negative 2 times pi, 1), (negative 3 divided by 2 times pi, 0), (negative pi, negative 1), (negative 1 divided by 2 times pi, 0), (0, 1), (1 divided by 2 times pi, 0), (pi, negative 1), (3 divided by 2 times pi, 0), and (2 times pi, 1). The points (negative 2 times pi, 1), (0, 1), and (2 times pi, 1) are the highest points on the graph. The points (negative pi, negative 1) and (pi, negative 1) are the lowest points on the graph. The pattern extends infinitely to the left and right.

ⓐ Find: f(0).
ⓑ Find: f(π).
ⓒ Find: f(−π).
ⓓ Find the values for x in [-2π,2π] when f(x)=0.
ⓔ Find the x-intercepts.
ⓕ Find the y-intercepts.
ⓖ Find the domain. Write it in interval notation.
ⓗ Find the range. Write it in interval notation.

Answer

ⓐ f(0)=1 ⓑ f(π)=−1 ⓒ f(−π)=−1 ⓓ f(x)=0 for x= − 3π2, − π2, π2, 3π2 ⓔ (−3π2,0), (−π2,0), (π2,0), (3π2,0) ⓕ (0,1) ⓖ (−∞,∞) ⓗ [−1,1]

3.6-337 §3.6 source ↗

Use the Vertical Line Test

In the following exercises, determine whether each graph is the graph of a function.

ⓐ

The figure has a circle graphed on the x y-coordinate plane. The x-axis runs from negative 6 to 6. The y-axis runs from negative 6 to 6. The circle goes through the points (negative 3, 0), (3, 0), (0, negative 3), and (0, 3).


ⓑ

The figure has a parabola opening up graphed on the x y-coordinate plane. The x-axis runs from negative 6 to 6. The y-axis runs from negative 4 to 8. The parabola goes through the points (negative 2, 6), (1, 3), (0, 2), (1, 3), and (2, 6).

Answer

ⓐ no ⓑ yes

3.6-339 §3.6 source ↗

Use the Vertical Line Test

In the following exercises, determine whether each graph is the graph of a function.

ⓐ

The figure has a parabola opening right graphed on the x y-coordinate plane. The x-axis runs from negative 6 to 6. The y-axis runs from negative 6 to 6. The parabola goes through the points (negative 2, 0), (negative 1, 1), (negative 1, negative 1), (negative 2, 2), and (2, 2).


ⓑ

The figure has a cube function graphed on the x y-coordinate plane. The x-axis runs from negative 6 to 6. The y-axis runs from negative 6 to 6. The curved line goes through the points (negative 1, negative 1), (0, 0), and (1, 1).

Answer

ⓐ no ⓑ yes

3.6-341 §3.6 source ↗

Identify Graphs of Basic Functions

In the following exercises, ⓐ graph each function ⓑ state its domain and range. Write the domain and range in interval notation.

f ( x ) = 3 x + 4

Answer

ⓐ

The figure has a linear function graphed on the x y-coordinate plane. The x-axis runs from negative 6 to 6. The y-axis runs from negative 6 to 6. The line goes through the points (negative 2, negative 2), (negative 1, 1), and (0, 4).


ⓑ D:(-∞,∞), R:(-∞,∞)

3.6-343 §3.6 source ↗

Identify Graphs of Basic Functions

In the following exercises, ⓐ graph each function ⓑ state its domain and range. Write the domain and range in interval notation.

f ( x ) = − x − 2

Answer

ⓐ

The figure has a linear function graphed on the x y-coordinate plane. The x-axis runs from negative 6 to 6. The y-axis runs from negative 6 to 6. The line goes through the points (negative 2, 0), (0, negative 2), and (2, negative 4).


ⓑ D:(-∞,∞), R:(-∞,∞)

3.6-345 §3.6 source ↗

Identify Graphs of Basic Functions

In the following exercises, ⓐ graph each function ⓑ state its domain and range. Write the domain and range in interval notation.

f ( x ) = −2 x + 2

Answer

ⓐ

The figure has a linear function graphed on the x y-coordinate plane. The x-axis runs from negative 6 to 6. The y-axis runs from negative 6 to 6. The line goes through the points (negative 2, 2), (negative 1, 0), and (0, negative 2).


ⓑ D:(-∞,∞), R:(-∞,∞)

3.6-347 §3.6 source ↗

Identify Graphs of Basic Functions

In the following exercises, ⓐ graph each function ⓑ state its domain and range. Write the domain and range in interval notation.

f ( x ) = 1 2 x + 1

Answer

ⓐ

The figure has a linear function graphed on the x y-coordinate plane. The x-axis runs from negative 6 to 6. The y-axis runs from negative 6 to 6. The line goes through the points (negative 2, 0), (0, 1), and (2, 2).


ⓑ D:(-∞,∞), R:(-∞,∞)

3.6-349 §3.6 source ↗

Identify Graphs of Basic Functions

In the following exercises, ⓐ graph each function ⓑ state its domain and range. Write the domain and range in interval notation.

f ( x ) = 5

Answer

ⓐ

The figure has a constant function graphed on the x y-coordinate plane. The x-axis runs from negative 8 to 8. The y-axis runs from negative 8 to 8. The line goes through the points (negative 2, 5), (negative 1, 5), and (0, 5).


ⓑ D:(-∞,∞), R:{5}

3.6-351 §3.6 source ↗

Identify Graphs of Basic Functions

In the following exercises, ⓐ graph each function ⓑ state its domain and range. Write the domain and range in interval notation.

f ( x ) = −3

Answer

ⓐ

The figure has a constant function graphed on the x y-coordinate plane. The x-axis runs from negative 6 to 6. The y-axis runs from negative 6 to 6. The line goes through the points (0, negative 3), (1, negative 3), and (2, negative 3).


ⓑ D:(-∞,∞), R: {−3}

3.6-353 §3.6 source ↗

Identify Graphs of Basic Functions

In the following exercises, ⓐ graph each function ⓑ state its domain and range. Write the domain and range in interval notation.

f ( x ) = 2 x

Answer

ⓐ

The figure has a linear function graphed on the x y-coordinate plane. The x-axis runs from negative 8 to 8. The y-axis runs from negative 8 to 8. The line goes through the points (0, 0), (2, 4), and (negative 2, negative 4).


ⓑ D:(-∞,∞), R:(-∞,∞)

3.6-355 §3.6 source ↗

Identify Graphs of Basic Functions

In the following exercises, ⓐ graph each function ⓑ state its domain and range. Write the domain and range in interval notation.

f ( x ) = −2 x

Answer

ⓐ

The figure has a linear function graphed on the x y-coordinate plane. The x-axis runs from negative 12 to 12. The y-axis runs from negative 12 to 12. The line goes through the points (0, 0), (1, negative 2), and (negative 1, 2).


ⓑ D:(-∞,∞), R:(-∞,∞)

3.6-357 §3.6 source ↗

Identify Graphs of Basic Functions

In the following exercises, ⓐ graph each function ⓑ state its domain and range. Write the domain and range in interval notation.

f ( x ) = 3 x 2

Answer

ⓐ

The figure has a square function graphed on the x y-coordinate plane. The x-axis runs from negative 6 to 6. The y-axis runs from negative 2 to 10. The parabola goes through the points (negative 1, 3), (0, 0), and (1, 3). The lowest point on the graph is (0, 0).


ⓑ D:(-∞,∞), R:[0,∞)

3.6-359 §3.6 source ↗

Identify Graphs of Basic Functions

In the following exercises, ⓐ graph each function ⓑ state its domain and range. Write the domain and range in interval notation.

f ( x ) = −3 x 2

Answer

ⓐ

The figure has a square function graphed on the x y-coordinate plane. The x-axis runs from negative 6 to 6. The y-axis runs from negative 10 to 2. The parabola goes through the points (negative 1, negative 3), (0, 0), and (1, negative 3). The highest point on the graph is (0, 0).


ⓑ (-∞,∞), R:(-∞,0]

3.6-361 §3.6 source ↗

Identify Graphs of Basic Functions

In the following exercises, ⓐ graph each function ⓑ state its domain and range. Write the domain and range in interval notation.

f ( x ) = 1 2 x 2

Answer

ⓐ

The figure has a square function graphed on the x y-coordinate plane. The x-axis runs from negative 6 to 6. The y-axis runs from negative 2 to 10. The parabola goes through the points (negative 4, 8), (negative 2, 2), (0, 0), (2, 2), and (4, 8). The lowest point on the graph is (0, 0).


ⓑ (-∞,∞), R:[0,∞)

3.6-363 §3.6 source ↗

Identify Graphs of Basic Functions

In the following exercises, ⓐ graph each function ⓑ state its domain and range. Write the domain and range in interval notation.

f ( x ) = x 2 − 1

Answer

ⓐ

The figure has a square function graphed on the x y-coordinate plane. The x-axis runs from negative 6 to 6. The y-axis runs from negative 2 to 10. The parabola goes through the points (negative 2, 3), (negative 1, 0), (0, negative 1), (1, 0), and (2, 3). The lowest point on the graph is (0, negative 1).


ⓑ (-∞,∞), R:[−1, ∞)

3.6-365 §3.6 source ↗

Identify Graphs of Basic Functions

In the following exercises, ⓐ graph each function ⓑ state its domain and range. Write the domain and range in interval notation.

f ( x ) = −2 x 3

Answer

ⓐ

The figure has a cube function graphed on the x y-coordinate plane. The x-axis runs from negative 6 to 6. The y-axis runs from negative 6 to 6. The curved line goes through the points (negative 1, 2), (0, 0), and (1, negative 2).


ⓑ D:(-∞,∞), R:(-∞,∞)

3.6-367 §3.6 source ↗

Identify Graphs of Basic Functions

In the following exercises, ⓐ graph each function ⓑ state its domain and range. Write the domain and range in interval notation.

f ( x ) = x 3 + 2

Answer

ⓐ

The figure has a cube function graphed on the x y-coordinate plane. The x-axis runs from negative 6 to 6. The y-axis runs from negative 6 to 6. The curved line goes through the points (negative 1, 1), (0, 2), and (1, 3).


ⓑ D:(-∞,∞), R:(-∞,∞)

3.6-369 §3.6 source ↗

Identify Graphs of Basic Functions

In the following exercises, ⓐ graph each function ⓑ state its domain and range. Write the domain and range in interval notation.

f ( x ) = 2 x

Answer

ⓐ

The figure has a square root function graphed on the x y-coordinate plane. The x-axis runs from 0 to 10. The y-axis runs from 0 to 10. The half-line starts at the point (0, 0) and goes through the points (1, 2) and (4, 4).


ⓑ D:[0,∞), R:[0,∞)

3.6-371 §3.6 source ↗

Identify Graphs of Basic Functions

In the following exercises, ⓐ graph each function ⓑ state its domain and range. Write the domain and range in interval notation.

f ( x ) = x − 1

Answer

ⓐ

The figure has a square root function graphed on the x y-coordinate plane. The x-axis runs from 0 to 10. The y-axis runs from 0 to 10. The half-line starts at the point (1, 0) and goes through the points (2, 1) and (5, 2).


ⓑ D:[1,∞), R:[0,∞)

3.6-373 §3.6 source ↗

Identify Graphs of Basic Functions

In the following exercises, ⓐ graph each function ⓑ state its domain and range. Write the domain and range in interval notation.

f ( x ) = 3 | x |

Answer

ⓐ

The figure has an absolute value function graphed on the x y-coordinate plane. The x-axis runs from negative 6 to 6. The y-axis runs from negative 2 to 10. The vertex is at the point (0, 0). The line goes through the points (negative 1, 3) and (1, 3).


ⓑ D:−∞,∞, R:[0,∞)

3.6-375 §3.6 source ↗

Identify Graphs of Basic Functions

In the following exercises, ⓐ graph each function ⓑ state its domain and range. Write the domain and range in interval notation.

f ( x ) = | x | + 1

Answer

ⓐ

The figure has an absolute value function graphed on the x y-coordinate plane. The x-axis runs from negative 6 to 6. The y-axis runs from negative 2 to 10. The vertex is at the point (0, 1). The line goes through the points (negative 1, 2) and (1, 2).


ⓑ D:(-∞,∞), R:[1,∞)

3.6-377 §3.6 source ↗

Read Information from a Graph of a Function

In the following exercises, use the graph of the function to find its domain and range. Write the domain and range in interval notation.

The figure has a square root function graphed on the x y-coordinate plane. The x-axis runs from negative 2 to 8. The y-axis runs from negative 2 to 8. The half-line starts at the point (2, 0) and goes through the points (3, 1) and (6, 2).

Answer

D: [2,∞), R: [0,∞)

3.6-379 §3.6 source ↗

Read Information from a Graph of a Function

In the following exercises, use the graph of the function to find its domain and range. Write the domain and range in interval notation.

The figure has an absolute value function graphed on the x y-coordinate plane. The x-axis runs from negative 6 to 6. The y-axis runs from 0 to 12. The vertex is at the point (0, 4). The line goes through the points (negative 2, 6) and (2, 6).

Answer

D: (-∞,∞), R: [4,∞)

3.6-381 §3.6 source ↗

Read Information from a Graph of a Function

In the following exercises, use the graph of the function to find its domain and range. Write the domain and range in interval notation.

The figure has a half-circle graphed on the x y-coordinate plane. The x-axis runs from negative 6 to 6. The y-axis runs from negative 6 to 6. The curved line segment starts at the point (negative 2, 0). The line goes through the point (0, 2) and ends at the point (2, 0).

Answer

D: [−2,2], R: [0, 2]

3.6-383 §3.6 source ↗

In the following exercises, use the graph of the function to find the indicated values.

This figure has a wavy curved line graphed on the x y-coordinate plane. The x-axis runs from negative 2 times pi to 2 times pi. The y-axis runs from negative 6 to 6. The curved line segment goes through the points (negative 2 times pi, 0), (negative 3 divided by 2 times pi, negative 1), (negative pi, 0), (negative 1 divided by 2 times pi, 1), (0, 0), (1 divided by 2 times pi, negative 1), (pi, 0), (3 divided by 2 times pi, 1), and (2 times pi, 0). The points (negative 3 divided by 2 times pi, negative 1) and (1 divided by 2 times pi, negative 1) are the lowest points on the graph. The points (negative 1 divided by 2 times pi, 1) and (3 divided by 2 times pi, 1) are the highest points on the graph. The pattern extends infinitely to the left and right.

ⓐ Find: f(0).
ⓑ Find: f(12π).
ⓒ Find: f(−32π).
ⓓ Find the values for x when f(x)=0.
ⓔ Find the x-intercepts.
ⓕ Find the y-intercepts.
ⓖ Find the domain. Write it in interval notation.
ⓗ Find the range. Write it in interval notation.

Answer

ⓐ f(0)=0 ⓑ fπ2=−1
ⓒ f−3π2=−1 ⓓ f(x)=0 for x= −2π, −π, 0, π, 2π
ⓔ (−2π,0), (−π,0), (0,0), (π,0), (2π,0)
ⓕ 0,0 ⓖ (−∞,∞)
ⓗ [−1,1]

3.6-385 §3.6 source ↗

In the following exercises, use the graph of the function to find the indicated values.

The figure has the top half of a circle graphed on the x y-coordinate plane. The x-axis runs from negative 6 to 6. The y-axis runs from negative 4 to 8. The curved line segment starts at the point (negative 3, 2). The line goes through the point (0, 5) and ends at the point (3, 2). The point (0, 5) is the highest point on the graph. The points (negative 3, 2) and (3, 2) are the lowest points on the graph.

ⓐ Find: f(0).
ⓑ Find: f(−3).
ⓒ Find: f(3).
ⓓ Find the values for x when f(x)=0.
ⓔ Find the x-intercepts.
ⓕ Find the y-intercepts.
ⓖ Find the domain. Write it in interval notation.
ⓗ Find the range. Write it in interval notation.

Answer

ⓐ 5 ⓑ 2 ⓒ 2 ⓓ f(x)=0 for no x ⓔ none ⓕ 0,5 ⓖ [−3,3]
ⓗ [2,5]

3.R-391 §3.R source ↗

Plot Points in a Rectangular Coordinate System

In the following exercises, plot each point in a rectangular coordinate system.


ⓐ (−1,−5)
ⓑ (−3,4)
ⓒ (2,−3)
ⓓ (1,52)

Answer

This figure shows points plotted on the x y-coordinate plane. The x and y axes run from negative 5 to 5. The point labeled a is 1 units to the left of the origin and 5 units below the origin and is located in quadrant III. The point labeled b is 3 units to the left of the origin and 4 units above the origin and is located in quadrant II. The point labeled c is 2 units to the right of the origin and 3 units below the origin and is located in quadrant IV. The point labeled d is 1 unit to the right of the origin and 2.5 units above the origin and is located in quadrant I.

3.R-393 §3.R source ↗

In the following exercises, determine which ordered pairs are solutions to the given equations.

5x+y=10;
ⓐ (5,1)
ⓑ (2,0)
ⓒ (4,−10)

Answer

ⓑ , ⓒ

3.R-395 §3.R source ↗

Graph a Linear Equation by Plotting Points

In the following exercises, graph by plotting points.

y = 4 x − 3

Answer

This figure shows a straight line graphed on the x y-coordinate plane. The x and y-axes run from negative 8 to 8. The line goes through the points (negative 1, negative 7), (0, negative 3), (1, negative 1), and (2, 3).

3.R-397 §3.R source ↗

Graph a Linear Equation by Plotting Points

In the following exercises, graph by plotting points.

y = 1 2 x + 3

Answer

This figure shows a straight line graphed on the x y-coordinate plane. The x and y-axes run from negative 8 to 8. The line goes through the points (negative 6, 0), (0, 3), (2, 4), and (4, 5).

3.R-399 §3.R source ↗

Graph a Linear Equation by Plotting Points

In the following exercises, graph by plotting points.

x − y = 6

Answer

This figure shows a straight line graphed on the x y-coordinate plane. The x and y-axes run from negative 8 to 8. The line goes through the points (negative 1, negative 7), (0, negative 6), (3, negative 3), and (6, 0).

3.R-401 §3.R source ↗

Graph a Linear Equation by Plotting Points

In the following exercises, graph by plotting points.

3 x − 2 y = 6

Answer

This figure shows a straight line graphed on the x y-coordinate plane. The x and y-axes run from negative 8 to 8. The line goes through the points (negative 2, negative 6), (0, negative 3), (2, 0), and (4, 3).

3.R-403 §3.R source ↗

Graph Vertical and Horizontal lines

In the following exercises, graph each equation.

x = 3

Answer

This figure shows a vertical straight line graphed on the x y-coordinate plane. The x and y-axes run from negative 8 to 8. The line goes through the points (3, negative 1), (3, 0), and (3, 1).

3.R-405 §3.R source ↗

In the following exercises, graph each pair of equations in the same rectangular coordinate system.

y=43x and y=43

Answer

The figure shows the graphs of a straight horizontal line and a straight slanted line on the same x y-coordinate plane. The x and y axes run from negative 5 to 5. The horizontal line goes through the points (0, 4 divided by 3), (1, 4 divided by 3), and (2, 4 divided by 3). The slanted line goes through the points (0, 0), (1, 4 divided by 3), and (2, 8 divided by 3).

3.R-407 §3.R source ↗

Find x- and y-Intercepts

In the following exercises, find the x- and y-intercepts.

The figure shows a straight line graphed on the x y-coordinate plane. The x and y axes run from negative 8 to 8. The line goes through the points (negative 2, 5), (negative 1, 4), (0, 3), (3, 0), and (6, negative 3).

Answer

( 0 , 3 ) ( 3 , 0 )

3.R-409 §3.R source ↗

In the following exercises, find the intercepts of each equation.

x + 2 y = 6

Answer

( 6 , 0 ) , ( 0 , 3 )

3.R-411 §3.R source ↗

In the following exercises, find the intercepts of each equation.

y = 3 4 x − 12

Answer

(16,0), (0,−12)

3.R-413 §3.R source ↗

Graph a Line Using the Intercepts

In the following exercises, graph using the intercepts.

− x + 3 y = 3

Answer

The figure shows a straight line graphed on the x y-coordinate plane. The x and y axes run from negative 8 to 8. The line goes through the points (negative 3, 0), (0, 1), (3, 2), and (6, 3).

3.R-415 §3.R source ↗

Graph a Line Using the Intercepts

In the following exercises, graph using the intercepts.

2 x − y = 5

Answer

The figure shows a straight line graphed on the x y-coordinate plane. The x and y axes run from negative 8 to 8. The line goes through the points (0, negative 5), (1, negative 3), (2, negative 1), and (3, 1).

3.R-417 §3.R source ↗

Graph a Line Using the Intercepts

In the following exercises, graph using the intercepts.

y = 4 x

Answer

The figure shows a straight line graphed on the x y-coordinate plane. The x and y axes run from negative 8 to 8. The line goes through the points (negative 1, 4), (0, 0), and (1, negative 4).

3.R-419 §3.R source ↗

Find the Slope of a Line

In the following exercises, find the slope of each line shown.

This figure shows the graph of a straight line on the x y-coordinate plane. The x-axis runs from negative 6 to 6. The y-axis runs from negative 6 to 6. The line goes through the points (negative 4, 0) and (0, 4).

Answer

1

3.R-421 §3.R source ↗

Find the Slope of a Line

In the following exercises, find the slope of each line shown.

This figure shows the graph of a straight line on the x y-coordinate plane. The x-axis runs from negative 6 to 6. The y-axis runs from negative 6 to 6. The line goes through the points (1, 4) and (5, 2).

Answer

− 1 2

3.R-423 §3.R source ↗

In the following exercises, find the slope of each line.

x = 5

Answer

undefined

3.R-425 §3.R source ↗

In the following exercises, find the slope of each line.

y = −1

Answer

0

3.R-427 §3.R source ↗

Use the Slope Formula to find the Slope of a Line between Two Points

In the following exercises, use the slope formula to find the slope of the line between each pair of points.

(3,5), (4,−1)

Answer

−6

3.R-429 §3.R source ↗

Use the Slope Formula to find the Slope of a Line between Two Points

In the following exercises, use the slope formula to find the slope of the line between each pair of points.

( 2 , 1 ) , ( 4 , 6 )

Answer

5 2

3.R-431 §3.R source ↗

Graph a Line Given a Point and the Slope

In the following exercises, graph each line with the given point and slope.

(−3,4); m=−13

Answer

This figure shows the graph of a straight line on the x y-coordinate plane. The x-axis runs from negative 8 to 8. The y-axis runs from negative 8 to 8. The line goes through the points (negative 3, 4) and (0, 3).

3.R-433 §3.R source ↗

Graph a Line Given a Point and the Slope

In the following exercises, graph each line with the given point and slope.

y-intercept 1; m=−34

Answer

This figure shows the graph of a straight line on the x y-coordinate plane. The x-axis runs from negative 8 to 8. The y-axis runs from negative 8 to 8. The line goes through the points (0, 1) and (4, negative 2).

3.R-435 §3.R source ↗

Graph a Line Using Its Slope and Intercept

In the following exercises, identify the slope and y-intercept of each line.

y = 5 3 x − 6

Answer

m = 5 3 ; ( 0 , −6 )

3.R-437 §3.R source ↗

Graph a Line Using Its Slope and Intercept

In the following exercises, identify the slope and y-intercept of each line.

4 x − 5 y = 8

Answer

m= 4 5 ; (0,− 8 5 )

3.R-439 §3.R source ↗

In the following exercises, graph the line of each equation using its slope and y-intercept.

y = − x − 1

Answer

This figure shows the graph of a straight line on the x y-coordinate plane. The x-axis runs from negative 10 to 10. The y-axis runs from negative 10 to 10. The line goes through the points (0, negative 1) and (1, negative 2).

3.R-441 §3.R source ↗

In the following exercises, graph the line of each equation using its slope and y-intercept.

4 x − 3 y = 12

Answer

This figure shows the graph of a straight line on the x y-coordinate plane. The x-axis runs from negative 10 to 10. The y-axis runs from negative 10 to 10. The line goes through the points (0, negative 4) and (3, 0).

3.R-443 §3.R source ↗

In the following exercises, determine the most convenient method to graph each line.

y = −3

Answer

horizontal line

3.R-445 §3.R source ↗

In the following exercises, determine the most convenient method to graph each line.

x − y = 2

Answer

intercepts

3.R-447 §3.R source ↗

In the following exercises, determine the most convenient method to graph each line.

y = 3 4 x − 1

Answer

plotting points

3.R-449 §3.R source ↗

Graph and Interpret Applications of Slope-Intercept

Marjorie teaches piano. The equation P=35s−250 models the relation between her weekly profit, P, in dollars and the number of student lessons, s, that she teaches.

ⓐ Find Marjorie’s profit for a week when she teaches no student lessons.
ⓑ Find the profit for a week when she teaches 20 student lessons.
ⓒ Interpret the slope and P-intercept of the equation.
ⓓ Graph the equation.

Answer

ⓐ −$250
ⓑ $450
ⓒ The slope, 35, means that Marjorie’s weekly profit, P, increases by $35 for each additional student lesson she teaches.
The P-intercept means that when the number of lessons is 0, Marjorie loses $250.
ⓓ

This figure shows the graph of a straight line on the x y-coordinate plane. The x-axis runs from negative 4 to 28. The y-axis runs from negative 250 to 450. The line goes through the points (0, negative 250) and (20, 450).

3.R-451 §3.R source ↗

Use Slopes to Identify Parallel and Perpendicular Lines

In the following exercises, use slopes and y-intercepts to determine if the lines are parallel, perpendicular, or neither.

y= 5x− 1; 10x+ 2y= 0

Answer

neither

3.R-453 §3.R source ↗

Use Slopes to Identify Parallel and Perpendicular Lines

In the following exercises, use slopes and y-intercepts to determine if the lines are parallel, perpendicular, or neither.

2x− y= 8; x− 2y= 4

Answer

neither

3.R-455 §3.R source ↗

Find an Equation of the Line Given the Slope and y-Intercept

In the following exercises, find the equation of a line with given slope and y-intercept. Write the equation in slope–intercept form.

slope −5 and y-intercept (0,−3)

Answer

y = −5 x − 3

3.R-457 §3.R source ↗

Find an Equation of the Line Given the Slope and y-Intercept

In the following exercises, find the equation of a line with given slope and y-intercept. Write the equation in slope–intercept form.

slope −2 and y-intercept (0,0)

Answer

y = −2 x

3.R-459 §3.R source ↗

In the following exercises, find the equation of the line shown in each graph. Write the equation in slope–intercept form.

This figure has a graph of a straight line on the x y-coordinate plane. The x and y-axes run from negative 10 to 10. The line goes through the points (0, 5), (1, 2), and (2, negative 1).

Answer

y = −3 x + 5

3.R-461 §3.R source ↗

In the following exercises, find the equation of the line shown in each graph. Write the equation in slope–intercept form.

This figure has a graph of a horizontal straight line on the x y-coordinate plane. The x and y-axes run from negative 10 to 10. The line goes through the points (0, negative 4), (1, negative 4), and (2, negative 4).

Answer

y = −4

3.R-463 §3.R source ↗

Find an Equation of the Line Given the Slope and a Point

In the following exercises, find the equation of a line with given slope and containing the given point. Write the equation in slope–intercept form.

m=35, point (10,6)

Answer

y = 3 5 x

3.R-465 §3.R source ↗

Find an Equation of the Line Given the Slope and a Point

In the following exercises, find the equation of a line with given slope and containing the given point. Write the equation in slope–intercept form.

m=−2, point (−1,−3)

Answer

y = −2 x − 5

3.R-467 §3.R source ↗

Find an Equation of the Line Given Two Points

In the following exercises, find the equation of a line containing the given points. Write the equation in slope–intercept form.

(7,1) and (5,0)

Answer

y = 1 2 x − 5 2

3.R-469 §3.R source ↗

Find an Equation of the Line Given Two Points

In the following exercises, find the equation of a line containing the given points. Write the equation in slope–intercept form.

(5,2) and (−1,2)

Answer

y = 2

3.R-471 §3.R source ↗

Find an Equation of a Line Parallel to a Given Line

In the following exercises, find an equation of a line parallel to the given line and contains the given point. Write the equation in slope–intercept form.

line 2x+5y=−10, point (10,4)

Answer

y = − 2 5 x + 8

3.R-473 §3.R source ↗

Find an Equation of a Line Parallel to a Given Line

In the following exercises, find an equation of a line parallel to the given line and contains the given point. Write the equation in slope–intercept form.

line y=−5, point (−4,3)

Answer

y = 3

3.R-475 §3.R source ↗

Find an Equation of a Line Perpendicular to a Given Line

In the following exercises, find an equation of a line perpendicular to the given line and contains the given point. Write the equation in slope–intercept form.

line 2x−3y=9, point (−4,0)

Answer

y = − 3 2 x − 6

3.R-477 §3.R source ↗

Find an Equation of a Line Perpendicular to a Given Line

In the following exercises, find an equation of a line perpendicular to the given line and contains the given point. Write the equation in slope–intercept form.

line x=−5 point (2,1)

Answer

y = 1

3.R-479 §3.R source ↗

Verify Solutions to an Inequality in Two Variables

In the following exercises, determine whether each ordered pair is a solution to the given inequality.

Determine whether each ordered pair is a solution to the inequality x+y>4:

ⓐ (6,1) ⓑ (−3,6) ⓒ (3,2) ⓓ (−5,10) ⓔ (0,0)

Answer

ⓐ yes ⓑ no ⓒ yes ⓓ yes; ⓔ no

3.R-481 §3.R source ↗

Recognize the Relation Between the Solutions of an Inequality and its Graph

In the following exercises, write the inequality shown by the shaded region.

Write the inequality shown by the graph with the boundary line y=23x−3.
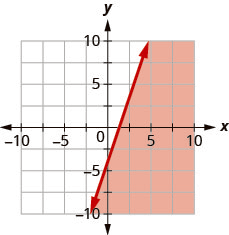
This figure has the graph of a straight line on the x y-coordinate plane. The x and y axes run from negative 10 to 10. A line is drawn through the points (0, negative 3), (3, negative 1), and (6, 1). The line divides the x y-coordinate plane into two halves. The line and the top left half are shaded red to indicate that this is where the solutions of the inequality are.This figure has the graph of a straight line on the x y-coordinate plane. The x and y axes run from negative 10 to 10. A line is drawn through the points (0, negative 3), (3, negative 1), and (6, 1). The line divides the x y-coordinate plane into two halves. The line and the top left half are shaded red to indicate that this is where the solutions of the inequality are.

Answer

y ≥ 2 3 x − 3

3.R-483 §3.R source ↗

Recognize the Relation Between the Solutions of an Inequality and its Graph

In the following exercises, write the inequality shown by the shaded region.

Write the inequality shown by the shaded region in the graph with the boundary line x−2y=6.
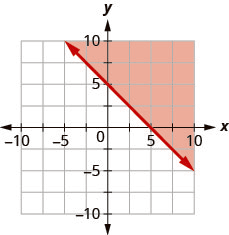
This figure has the graph of a straight line on the x y-coordinate plane. The x and y axes run from negative 10 to 10. A line is drawn through the points (0, negative 3), (2, negative 2), and (6, 0). The line divides the x y-coordinate plane into two halves. The line and the bottom right half are shaded red to indicate that this is where the solutions of the inequality are.

Answer

x − 2 y ≥ 6

3.R-485 §3.R source ↗

Graph Linear Inequalities in Two Variables

In the following exercises, graph each linear inequality.

Graph the linear inequality y≤−14x+3.

Answer

This figure has the graph of a straight dashed line on the x y-coordinate plane. The x and y axes run from negative 10 to 10. A straight dashed line is drawn through the points (0, 3), (4, 2), and (8, 1). The line divides the x y-coordinate plane into two halves. The bottom left half is shaded red to indicate that this is where the solutions of the inequality are.This figure has the graph of a straight dashed line on the x y-coordinate plane. The x and y axes run from negative 10 to 10. A straight dashed line is drawn through the points (0, 3), (4, 2), and (8, 1). The line divides the x y-coordinate plane into two halves. The bottom left half is shaded red to indicate that this is where the solutions of the inequality are.

3.R-487 §3.R source ↗

Graph Linear Inequalities in Two Variables

In the following exercises, graph each linear inequality.

Graph the linear inequality 3x+ 2y> 10.

Answer

This figure has the graph of a straight dashed line on the x y-coordinate plane. The x and y axes run from negative 10 to 10. A straight dashed line is drawn through the points (0, 5), (2, 2), and (4, negative 1). The line divides the x y-coordinate plane into two halves. The top right half is shaded red to indicate that this is where the solutions of the inequality are.

3.R-489 §3.R source ↗

Graph Linear Inequalities in Two Variables

In the following exercises, graph each linear inequality.

Graph the linear inequality y<6.

Answer

This figure has the graph of a straight horizontal dashed line on the x y-coordinate plane. The x and y axes run from negative 10 to 10. A straight dashed line is drawn through the points (0, 6), (1, 6), and (2, 6). The line divides the x y-coordinate plane into two halves. The bottom half is shaded red to indicate that this is where the solutions of the inequality are.This figure has the graph of a straight horizontal dashed line on the x y-coordinate plane. The x and y axes run from negative 10 to 10. A straight dashed line is drawn through the points (0, 6), (1, 6), and (2, 6). The line divides the x y-coordinate plane into two halves. The bottom half is shaded red to indicate that this is where the solutions of the inequality are.

3.R-491 §3.R source ↗

Solve Applications using Linear Inequalities in Two Variables

Atsushi he needs to exercise enough to burn 600 calories each day. He prefers to either run or bike and burns 20 calories per minute while running and 15 calories a minute while biking.

ⓐ If x is the number of minutes that Atsushi runs and y is the number minutes he bikes, find the inequality that models the situation.
ⓑ Graph the inequality.
ⓒ List three solutions to the inequality. What options do the solutions provide Atsushi?

Answer

ⓐ 20x+15y≥600
ⓑ

The figure has a straight line graphed on the x y-coordinate plane. The x-axis runs from 0 to 50. The y-axis runs from 0 to 50. The line goes through the points (0, 40) and (30, 0). The line divides the coordinate plane into two halves. The top right half and the line are colored red to indicate that this is the solution set.The figure has a straight line graphed on the x y-coordinate plane. The x-axis runs from 0 to 50. The y-axis runs from 0 to 50. The line goes through the points (0, 40) and (30, 0). The line divides the coordinate plane into two halves. The top right half and the line are colored red to indicate that this is the solution set.


ⓒ Answers will vary.

3.R-493 §3.R source ↗

Find the Domain and Range of a Relation

In the following exercises, for each relation, ⓐ find the domain of the relation ⓑ find the range of the relation.

{ ( −3 , 7 ) , ( −2 , 3 ) , ( −1 , 9 ) ,
(0,−3), (−1,8)}

Answer

ⓐ D: {−3, −2, −1, 0}
ⓑ R: {7, 3, 9, −3, 8}

3.R-495 §3.R source ↗

In the following exercise, use the graph of the relation to ⓐ list the ordered pairs of the relation ⓑ find the domain of the relation ⓒ find the range of the relation.
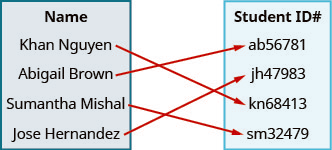
The figure shows the graph of some points on the x y-coordinate plane. The x and y-axes run from negative 6 to 6. The points (negative 3, 1), (negative 2, negative 1), (negative 2, negative 3), (0, negative 1), (0, 4), and (4, 3).

Answer

ⓐ (4, 3), (−2, −3), (−2, −1), (−3, 1), (0, −1), (0, 4),
ⓑ D: {−3, −2, 0, 4}
ⓒ R: {−3, −1, 1, 3, 4}

3.R-497 §3.R source ↗

Determine if a Relation is a Function

In the following exercises, use the set of ordered pairs to ⓐ determine whether the relation is a function ⓑ find the domain of the relation ⓒ find the range of the relation.
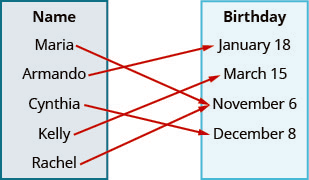
{ ( −3 , 27 ) , ( −2 , 8 ) , ( −1 , 1 ) ,
(0,0), (1,1), (2,8), (3,27)}

Answer

ⓐ yes ⓑ {−3, −2, −1, 0, 1, 2, 3}
ⓒ {0, 1, 8, 27}

3.R-499 §3.R source ↗

In the following exercises, use the mapping to ⓐ determine whether the relation is a function ⓑ find the domain of the function ⓒ find the range of the function.

This figure shows two table that each have one column. The table on the left has the header “x” and lists the numbers negative 3, negative 2, negative 1, 0, 1, 2, and 3. The table on the right has the header “x to the fifth power” and lists the numbers 0, 1, 32, 243, negative 1, negative 32, and negative 243. There are arrows starting at numbers in the x table and pointing towards numbers in the x to the fifth power table. The first arrow goes from negative 3 to negative 243. The second arrow goes from negative 2 to negative 32. The third arrow goes from negative 1 to 1. The fourth arrow goes from 0 to 0. The fifth arrow goes from 1 to 1. The sixth arrow goes from 2 to 32. The seventh arrow goes from 3 to 243.

Answer

ⓐ yes
ⓑ {−3, −2, −1, 0, 1, 2, 3}
ⓒ {−243, −32, −1, 0, 1, 32, 243}

3.R-501 §3.R source ↗

In the following exercises, determine whether each equation is a function.

y = x 2

Answer

yes

3.R-503 §3.R source ↗

In the following exercises, determine whether each equation is a function.

y = x 3

Answer

yes

3.R-505 §3.R source ↗

Find the Value of a Function

In the following exercises, evaluate the function:

ⓐ f(−2) ⓑ f(3) ⓒ f(a).

f ( x ) = 3 x − 4

Answer

ⓐ f(−2)=−10 ⓑ f(3)=5 ⓒ f(a)=3a−4

3.R-507 §3.R source ↗

Find the Value of a Function

In the following exercises, evaluate the function:

ⓐ f(−2) ⓑ f(3) ⓒ f(a).

f(x)= x 2 − 5x+ 6

Answer

ⓐ f(−2)=20 ⓑ f(3)=0 ⓒ f(a)= a2− 5a+ 6

3.R-509 §3.R source ↗

In the following exercises, evaluate the function.

g(x)= 3x2− 5x; g(2)

Answer

2

3.R-511 §3.R source ↗

In the following exercises, evaluate the function.

h(t)= 4|t− 1|+ 2; h(−3)

Answer

18

3.R-513 §3.R source ↗

Use the Vertical line Test

In the following exercises, determine whether each graph is the graph of a function.

The figure has a square function graphed on the x y-coordinate plane. The x-axis runs from negative 6 to 6. The y-axis runs from negative 2 to 10. The parabola goes through the points (negative 2, 5), (negative 1, 2), (0, 1), (1, 2), and (2, 5). The lowest point on the graph is (0, 1).

Answer

yes

3.R-515 §3.R source ↗

Use the Vertical line Test

In the following exercises, determine whether each graph is the graph of a function.

The figure has a circle graphed on the x y-coordinate plane. The x-axis runs from negative 6 to 6. The y-axis runs from negative 6 to 6. The circle goes through the points (negative 5, 0), (5, 0), (0, negative 5), and (0, 5).

Answer

no

3.R-517 §3.R source ↗

Use the Vertical line Test

In the following exercises, determine whether each graph is the graph of a function.

The figure has a cube function graphed on the x y-coordinate plane. The x-axis runs from negative 6 to 6. The y-axis runs from negative 6 to 6. The curved line goes through the points (negative 1, negative 1), (0, 0), and (1, 1).

Answer

yes

3.R-519 §3.R source ↗

Use the Vertical line Test

In the following exercises, determine whether each graph is the graph of a function.

The figure has a sideways absolute value function graphed on the x y-coordinate plane. The x-axis runs from negative 6 to 6. The y-axis runs from negative 6 to 6. The line bends at the point (0, negative 1) and goes to the right. The line goes through the points (1, 0), (1, negative 2), (2, 1), and (2, negative 3).

Answer

no

3.R-521 §3.R source ↗

Identify Graphs of Basic Functions

In the following exercises, ⓐ graph each function ⓑ state its domain and range. Write the domain and range in interval notation.

f ( x ) = −4 x − 2

Answer

ⓐ

The figure has a linear function graphed on the x y-coordinate plane. The x-axis runs from negative 6 to 6. The y-axis runs from negative 6 to 6. The line goes through the points (negative 2, 6), (negative 1, 2), and (0, negative 2).


ⓑ D: (-∞,∞), R: (-∞,∞)

3.R-523 §3.R source ↗

Identify Graphs of Basic Functions

In the following exercises, ⓐ graph each function ⓑ state its domain and range. Write the domain and range in interval notation.

f ( x ) = −6

Answer

ⓐ

The figure has a constant function graphed on the x y-coordinate plane. The x-axis runs from negative 6 to 6. The y-axis runs from negative 8 to 4. The line goes through the points (0, negative 6), (1, negative 6), and (2, negative 6).


ⓑ D: (-∞,∞), R: (6)

3.R-525 §3.R source ↗

Identify Graphs of Basic Functions

In the following exercises, ⓐ graph each function ⓑ state its domain and range. Write the domain and range in interval notation.

f ( x ) = 3 x 2

Answer

ⓐ

The figure has a square function graphed on the x y-coordinate plane. The x-axis runs from negative 6 to 6. The y-axis runs from negative 2 to 10. The parabola goes through the points (negative 1, 3), (0, 0), and (1, 3). The lowest point on the graph is (0, 0).


ⓑ D: (-∞,∞), R: [0,∞)

3.R-527 §3.R source ↗

Identify Graphs of Basic Functions

In the following exercises, ⓐ graph each function ⓑ state its domain and range. Write the domain and range in interval notation.

f ( x ) = x 2 + 2

Answer

ⓐ

The figure has a square function graphed on the x y-coordinate plane. The x-axis runs from negative 6 to 6. The y-axis runs from negative 4 to 8. The parabola goes through the points (negative 2, 6), (negative 1, 3), (0, 2), (1, 3), and (2, 6). The lowest point on the graph is (0, 2).


ⓑ D: (-∞,∞), R: [2,∞)

3.R-529 §3.R source ↗

Identify Graphs of Basic Functions

In the following exercises, ⓐ graph each function ⓑ state its domain and range. Write the domain and range in interval notation.

f ( x ) = x + 2

Answer

ⓐ

The figure has a square root function graphed on the x y-coordinate plane. The x-axis runs from negative 4 to 8. The y-axis runs from negative 2 to 10. The half-line starts at the point (negative 2, 0) and goes through the points (negative 1, 1) and (2, 2).


ⓑ D: [−2, ∞), R: [0,∞)

3.R-531 §3.R source ↗

Identify Graphs of Basic Functions

In the following exercises, ⓐ graph each function ⓑ state its domain and range. Write the domain and range in interval notation.

f ( x ) = | x | + 1

Answer

ⓐ

The figure has an absolute value function graphed on the x y-coordinate plane. The x-axis runs from negative 6 to 6. The y-axis runs from negative 2 to 10. The vertex is at the point (0, 1). The line goes through the points (negative 1, 2) and (1, 2).


ⓑ D: (-∞,∞), R: [1,∞)

3.R-533 §3.R source ↗

Read Information from a Graph of a Function

In the following exercises, use the graph of the function to find its domain and range. Write the domain and range in interval notation

The figure has an absolute value function graphed on the x y-coordinate plane. The x-axis runs from negative 6 to 6. The y-axis runs from negative 2 to 10. The vertex is at the point (0, 2). The line goes through the points (negative 1, 3) and (1, 3).

Answer

D: (-∞,∞), R: [2,∞)

3.R-535 §3.R source ↗

In the following exercises, use the graph of the function to find the indicated values.

This figure has a wavy curved line graphed on the x y-coordinate plane. The x-axis runs from negative 2 times pi to 2 times pi. The y-axis runs from negative 6 to 6. The curved line segment goes through the points (negative 2 times pi, 0), (negative 3 divided by 2 times pi, 1), (negative pi, 0), (negative 1 divided by 2 times pi, negative 1), (0, 0), (1 divided by 2 times pi, 1), (pi, 0), (3 divided by 2 times pi, negative 1), and (2 times pi, 0). The points (negative 3 divided by 2 times pi, 1) and (1 divided by 2 times pi, 1) are the highest points on the graph. The points (negative 1 divided by 2 times pi, negative 1) and (3 divided by 2 times pi, negative 1) are the lowest points on the graph. The pattern extends infinitely to the left and right.

ⓐ Find f(0).
ⓑ Find f(12π).
ⓒ Find f(−32π).
ⓓ Find the values for x when f(x)=0.
ⓔ Find the x-intercepts.
ⓕ Find the y-intercepts.
ⓖ Find the domain. Write it in interval notation.
ⓗ Find the range. Write it in interval notation.

Answer

ⓐ f(x)=0 ⓑ fπ2=1
ⓒ f−3π2=1 ⓓ f(x)=0 for x= −2π, −π, 0, π, 2π
ⓔ (−2π,0), (−π,0), (0,0), (π,0), (2π,0) ⓕ 0,0
ⓖ −∞,∞ ⓗ [−1,1]

3.T-537 §3.T source ↗

Plot each point in a rectangular coordinate system.

ⓐ (2,5)
ⓑ (−1,−3)
ⓒ (0,2)
ⓓ (−4,32)
ⓔ (5,0)

Answer

This figure shows points plotted on the x y-coordinate plane. The x and y axes run from negative 10 to 10. The point labeled a is 2 units to the right of the origin and 5 units above the origin and is located in quadrant I. The point labeled b is 1 unit to the left of the origin and 3 units below the origin and is located in quadrant III. The point labeled c is 2 units above the origin and is located on the y-axis. The point labeled d is 4 units to the left of the origin and 1.5 units above the origin and is located in quadrant II. The point labeled e is 5 units to the right of the origin and is located on the x-axis.

3.T-539 §3.T source ↗

Find the slope of each line shown.

ⓐ

The figure has a straight line graphed on the x y-coordinate plane. The x-axis runs from negative 10 to 10. The y-axis runs from negative 10 to 10. The line goes through the points (negative 5, 2) (0, negative 1), and (5, negative 4).


ⓑ

The figure has a straight vertical line graphed on the x y-coordinate plane. The x-axis runs from negative 10 to 10. The y-axis runs from negative 10 to 10. The line goes through the points (2, 0) (2, negative 1), and (2, 1).

Answer

ⓐ −35 ⓑ undefined

3.T-541 §3.T source ↗

Find the slope of each line shown.

Graph the line with slope 12 containing the point (−3,−4).

Answer

The figure has a straight line graphed on the x y-coordinate plane. The x-axis runs from negative 10 to 10. The y-axis runs from negative 10 to 10. The line goes through the points (negative 3, negative 4) (negative 1, negative 3), and (1, negative 2).

3.T-543 §3.T source ↗

Graph the line for each of the following equations.

y = 5 3 x − 1

Answer

The figure has a straight line graphed on the x y-coordinate plane. The x-axis runs from negative 10 to 10. The y-axis runs from negative 10 to 10. The line goes through the points (negative 3, negative 6) (0, negative 1), and (3, 4).

3.T-545 §3.T source ↗

Graph the line for each of the following equations.

y = 2

Answer

The figure has a straight horizontal line graphed on the x y-coordinate plane. The x-axis runs from negative 10 to 10. The y-axis runs from negative 10 to 10. The line goes through the points (negative 1, 2) (0, 2), and (1, 2).

3.T-547 §3.T source ↗

Find the equation of each line. Write the equation in slope-intercept form.

m=2, point (−3,−1)

Answer

y = 2 x + 5

3.T-549 §3.T source ↗

Find the equation of each line. Write the equation in slope-intercept form.

perpendicular to the line y=54x+2, containing the point (−10,3)

Answer

y = − 4 5 x − 5

3.T-551 §3.T source ↗

Graph each linear inequality.

y > 3 2 x + 5

Answer

The figure has a straight dashed line graphed on the x y-coordinate plane. The x-axis runs from negative 10 to 10. The y-axis runs from negative 10 to 10. The line goes through the points (negative 2, 2), (0, 5), and (2, 8). The line divides the coordinate plane into two halves. The top left half is colored red to indicate that this is the solution set.

3.T-553 §3.T source ↗

Graph each linear inequality.

y ≤ −5 x

Answer

The figure has a straight line graphed on the x y-coordinate plane. The x-axis runs from negative 8 to 8. The y-axis runs from negative 8 to 8. The line goes through the points (negative 1, 5), (0, 0), and (1, negative 5). The line divides the coordinate plane into two halves. The bottom left half and the line are colored red to indicate that this is the solution set.

3.T-555 §3.T source ↗

Graph each linear inequality.

Use the set of ordered pairs to ⓐ determine whether the relation is a function, ⓑ find the domain of the relation, and ⓒ find the range of the relation.
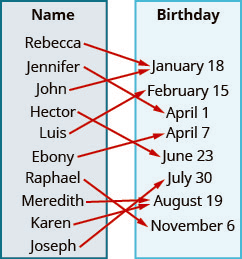
{ ( −3 , 27 ) , ( −2 , 8 ) , ( −1 , 1 ) , ( 0 , 0 ) ,
(1,1), (2,8), (3,27)}

Answer

ⓐ yes ⓑ {−3,−2,−1,0,1,2,3} ⓒ {0, 1, 8, 27}

3.T-557 §3.T source ↗

Graph each linear inequality.

For h(y)= 3|y− 1|− 3, evaluate h(−4).

Answer

12

3.T-559 §3.T source ↗

In the following exercises, ⓐ graph each function ⓑ state its domain and range.
Write the domain and range in interval notation.
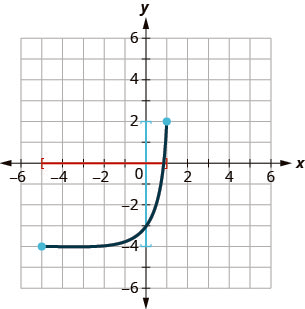
f ( x ) = x 2 + 1

Answer

ⓐ

The figure has a square function graphed on the x y-coordinate plane. The x-axis runs from negative 6 to 6. The y-axis runs from negative 2 to 10. The parabola goes through the points (negative 2, 5), (negative 1, 2), (0, 1), (1, 2), and (2, 5). The lowest point on the graph is (0, 1).


ⓑ D: (-∞,∞), R: [1,∞)

3.T-561 §3.T source ↗

In the following exercises, ⓐ graph each function ⓑ state its domain and range.
Write the domain and range in interval notation.
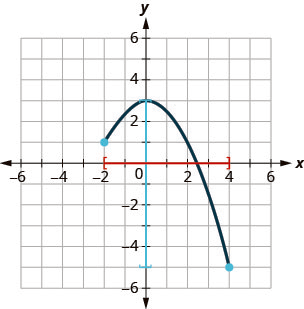
The figure has a square function graphed on the x y-coordinate plane. The x-axis runs from negative 6 to 6. The y-axis runs from negative 6 to 6. The parabola goes through the points (negative 2, 0), (negative 1, negative 3), (0, negative 4), (1, negative 3), and (2, 0). The lowest point on the graph is (0, negative 4).

ⓐ Find the x-intercepts.
ⓑ Find the y-intercepts.
ⓒ Find f(−1).
ⓓ Find f(1).
ⓔ Find the domain. Write it in interval notation.
ⓕ Find the range. Write it in interval notation.

Answer

ⓐ x=−2,2 ⓑ y=−4
ⓒ f(−1)=−3 ⓓ f(1)=−3
ⓔ D: (-∞,∞) ⓕ R: [−4, ∞)

Loading chapter 4…

Problems and answers are adapted from Intermediate Algebra 2e by Lynn Marecek and Andrea Honeycutt Mathis, OpenStax, and are used under the CC BY-NC-SA 4.0 licence. Access for free at https://openstax.org/books/intermediate-algebra-2e/pages/1-introduction. Illustrations: Copyright Rice University, OpenStax, under CC BY-NC-SA 4.0 license. This adaptation is released under the same licence, is non-commercial, and is neither affiliated with nor endorsed by OpenStax or Rice University.