Every problem in the chapter beside the book’s answer, a chapter at a time as you scroll.
Chapter 3: Two-Dimensional Kinematics
34 problems · 10 figures3-1 §3.2 source ↗
Use graphical methods to solve these problems. You may assume data taken from graphs is accurate to three digits.
Find the following for path A in Figure 3.49: (a) the total distance traveled, and (b) the magnitude and direction of the displacement from start to finish.
Answer
(a)
(b) , east of north
3-3 §3.2 source ↗
Use graphical methods to solve these problems. You may assume data taken from graphs is accurate to three digits.
Find the north and east components of the displacement for the hikers shown in Figure 3.47.
Answer
3-5 §3.2 source ↗
Use graphical methods to solve these problems. You may assume data taken from graphs is accurate to three digits.
Suppose you first walk 12.0 m in a direction west of north and then 20.0 m in a direction south of west. How far are you from your starting point, and what is the compass direction of a line connecting your starting point to your final position? (If you represent the two legs of the walk as vector displacements and , as in Figure 3.51, then this problem finds their sum .)
Answer
3-7 §3.2 source ↗
Use graphical methods to solve these problems. You may assume data taken from graphs is accurate to three digits.
(a) Repeat the problem two problems prior, but for the second leg you walk 20.0 m in a direction north of east, (which is equivalent to subtracting from —that is, finding ). (b) Repeat the problem two problems prior, but now you first walk 20.0 m in a direction east of south (which is equivalent to subtracting from —that is, to finding ). Show that this is the case.
Answer
(a) , north of east
(b) , south of west
3-9 §3.2 source ↗
Use graphical methods to solve these problems. You may assume data taken from graphs is accurate to three digits.
Show that the sum of the vectors discussed in Example 3.2 gives the result shown in Figure 3.23.
Answer
3-11 §3.2 source ↗
Use graphical methods to solve these problems. You may assume data taken from graphs is accurate to three digits.
Find the components of along the x- and y-axes in Figure 3.52.
Answer
x-component 4.41 m/s
y-component 5.07 m/s
3-13 §3.3 source ↗
Answer
(a) 1.56 km
(b) 120 m east
3-15 §3.3 source ↗
Answer
3-17 §3.3 source ↗
Answer
3-19 §3.3 source ↗
Answer
(a) , south of west
(b) , north of east
3-21 §3.3 source ↗
Answer
3-23 §3.3 source ↗
Answer
3-25 §3.4 source ↗
Answer
3-27 §3.4 source ↗
Answer
(a) 3.50 s
(b) 28.6 m/s (c) 34.3 m/s
(d) 44.7 m/s, below horizontal
3-29 §3.4 source ↗
Answer
(a)
(b) The arrow will go over the branch.
3-31 §3.4 source ↗
Answer
for ; for ; for .
3-33 §3.4 source ↗
Answer
(a) 560 m/s
(b)
(c) 80.0 m. This error is not significant because it is only 1% of the answer in part (b).
3-35 §3.4 source ↗
Answer
3-37 §3.4 source ↗
Answer
yes, the ball lands at 5.3 m from the net
3-39 §3.4 source ↗
Answer
(a) −0.486 m
(b) The larger the muzzle velocity, the smaller the deviation in the vertical direction, because the time of flight would be smaller. Air resistance would have the effect of decreasing the time of flight, therefore increasing the vertical deviation.
3-41 §3.4 source ↗
Answer
3-43 §3.4 source ↗
Answer
3-45 §3.4 source ↗
Answer
3-47 §3.4 source ↗
Answer
(a) 24.2 m/s
(b) The ball travels a total of 57.4 m with the brief gust of wind.
3-49 §3.4 source ↗
Answer
,
so that
and substituting for gives:
since the range is:
.
3-52 §3.5 source ↗
Answer
(a) , south of east
(b) , south of east
(c) , south of east
3-54 §3.5 source ↗
Answer
(a) 0.70 m/s faster
(b) Second runner wins
(c) 4.17 m
3-56 §3.5 source ↗
Answer
3-58 §3.5 source ↗
Answer
(a) , south of west
(b) The wind should make the plane travel slower and more to the south, which is what was calculated.
3-60 §3.5 source ↗
Answer
(a) 63.5 m/s
(b) 29.6 m/s
3-62 §3.5 source ↗
Answer
3-64 §3.5 source ↗
(a) Use the distance and velocity data in Figure 3.59 to find the rate of expansion as a function of distance.
(b) If you extrapolate back in time, how long ago would all of the galaxies have been at approximately the same position? The two parts of this problem give you some idea of how the Hubble constant for universal expansion and the time back to the Big Bang are determined, respectively.
Answer
(a)
(b) 20.2 billion years
3-66 §3.5 source ↗
Answer
3-71 §3.5 source ↗
Answer
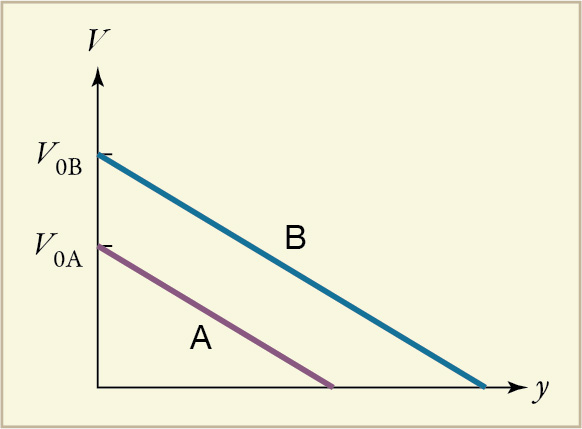
(a) Since , then B reaches the greatest height.
(b) i. Yes, it is consistent because . ii. No, it does not make sense because y is proportional to .
(c)
Loading chapter 4…
Problems and answers are adapted from College Physics 2e by Paul Peter Urone, Roger Hinrichs, Kim Dirks and Manjula Sharma, OpenStax, and are used under the CC BY-NC-SA 4.0 licence. Access for free at https://openstax.org/books/college-physics-2e/pages/1-introduction-to-science-and-the-realm-of-physics-physical-quantities-and-units. Illustrations: Copyright Rice University, OpenStax, under CC BY-NC-SA 4.0 license. This adaptation is released under the same licence, is non-commercial, and is neither affiliated with nor endorsed by OpenStax or Rice University.