Every problem in the chapter beside the book’s answer, a chapter at a time as you scroll.

Chapter 21: Unemployment

7 problems · 1 figure

21-1 §21.1 source ↗

Suppose the adult population over the age of 16 is 237.8 million and the labor force is 153.9 million (of whom 139.1 million are employed). How many people are “not in the labor force?” What are the proportions of employed, unemployed and not in the labor force in the population? Hint: Proportions are percentages.

Answer

The population is divided into those “in the labor force” and those “not in the labor force.” Thus, the number of adults not in the labor force is 237.8 – 153.9 = 83.9 million. Since the labor force is divided into employed persons and unemployed persons, the number of unemployed persons is 153.9 – 139.1 = 14.8 million. Thus, the adult population has the following proportions:

• 139.1/237.8 = 58.5% employed persons

• 14.8/237.8 = 6.2% unemployed persons

• 83.9/237.8 = 35.3% persons out of the labor force

21-2 §21.1 source ↗

Using the above data, what is the unemployment rate? These data are U.S. statistics from 2010. How does it compare to the February 2015 unemployment rate computed earlier?

Answer

The unemployment rate is defined as the number of unemployed persons as a percentage of the labor force or 14.8/153.9 = 9.6%. This is higher than the February 2015 unemployment rate, computed earlier, of 5.5%.

21-3 §21.2 source ↗

Over the long term, has the U.S. unemployment rate generally trended up, trended down, or remained at basically the same level?

Answer

Over the long term, the U.S. unemployment rate has remained basically the same level.

21-4 §21.2 source ↗

Whose unemployment rates are commonly higher in the U.S. economy:

a. White or non-White people?

b. The young or the middle-aged?

c. College graduates or high school graduates?

Answer

a. Non-White people

b. The young

c. High school graduates

21-5 §21.3 source ↗

Beginning in the 1970s and continuing for three decades, women entered the U.S. labor force in a big way. If we assume that wages are sticky in a downward direction, but that around 1970 the demand for labor equaled the supply of labor at the current wage rate, what do you imagine happened to the wage rate, employment, and unemployment as a result of increased labor force participation?

Answer

Because of the influx of women into the labor market, the supply of labor shifts to the right. Since wages are sticky downward, the increased supply of labor causes an increase in people looking for jobs (Qs), but no change in the number of jobs available (Qe). As a result, unemployment increases by the amount of the increase in the labor supply. This can be seen in the following figure.

Over time, as labor demand grows, the unemployment will decline and eventually wages will begin to increase again. But this increase in labor demand goes beyond the scope of this problem.
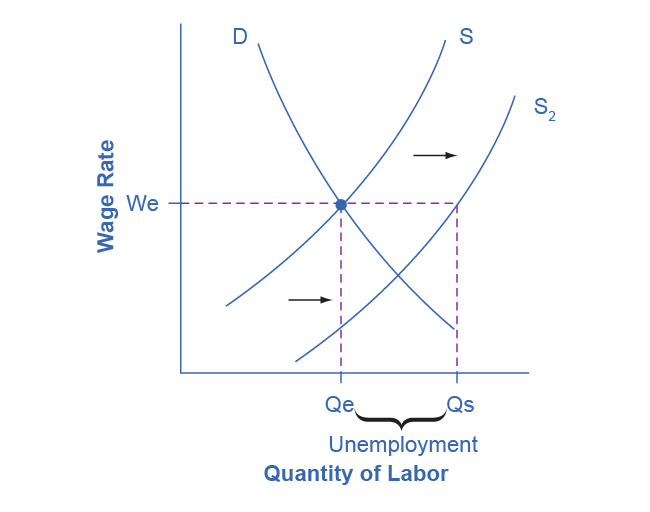
This graph represents the initial scenario outlined by the question. There is one downward sloping demand curve and two upward sloping supply curves. Line We intersects with line Qe at the same point where the demand curve intersects with supply curve S sub 1.

21-6 §21.4 source ↗

Is the increase in labor force participation rates among women better thought of as causing an increase in cyclical unemployment or an increase in the natural rate of unemployment? Why?

Answer

The increase in labor supply was a social demographic trend—it was not caused by the economy falling into a recession. Therefore, the influx of women into the work force increased the natural rate of unemployment.

21-7 §21.4 source ↗

Many college students graduate from college before they have found a job. When graduates begin to look for a job, they are counted as what category of unemployed?

Answer

New entrants to the labor force, whether from college or otherwise, are counted as frictionally unemployed until they find a job.

Loading chapter 22…

Problems and answers are adapted from Principles of Economics 3e by Steven A. Greenlaw, David Shapiro and Daniel MacDonald, OpenStax, and are used under the CC BY-NC-SA 4.0 licence. Access for free at https://openstax.org/books/principles-economics-3e/pages/1-introduction. Illustrations: Copyright Rice University, OpenStax, under CC BY-NC-SA 4.0 license. This adaptation is released under the same licence, is non-commercial, and is neither affiliated with nor endorsed by OpenStax or Rice University.