Every problem in the chapter beside the book’s answer, a chapter at a time as you scroll.

Chapter 5: Algebra

241 problems · 80 figures

Your Turn 5.1 §5.1 source ↗

Translate the following algebraic expressions from algebra into words.

18 + 11

Answer

18 plus 11 OR the sum of 18 and 11

Your Turn 5.1 (b) §5.1 source ↗

Translate the following algebraic expressions from algebra into words.

( 27 ) ( 9 )

Answer

27 times 9 OR the product of 27 and 9

Your Turn 5.1 (c) §5.1 source ↗

Translate the following algebraic expressions from algebra into words.

84 ÷ 7

Answer

84 divided by 7 OR the quotient of 84 and 7

Your Turn 5.1 (d) §5.1 source ↗

Translate the following algebraic expressions from algebra into words.

p − q

Answer

p minus q OR the difference of p and q

Your Turn 5.2 §5.1 source ↗

Translate the following phrases from words into algebraic expressions.

43 plus 67

Answer

43 + 67

Your Turn 5.2 (b) §5.1 source ↗

Translate the following phrases from words into algebraic expressions.

The product of 45 and 3

Answer

( 45 ) ( 3 )

Alternate answer option:

45 ⋅ 3

The cross symbol is not usually used in algebra.

( 45 ) ( 3 )

Your Turn 5.2 (c) §5.1 source ↗

Translate the following phrases from words into algebraic expressions.

The quotient of 45 and 3

Answer

45 ÷ 3

Alternate answer options:

45 3

45 / 3

45 ÷ 3

Your Turn 5.2 (d) §5.1 source ↗

Translate the following phrases from words into algebraic expressions.

89 minus 42

Answer

89 − 42

Your Turn 5.3 §5.1 source ↗

Translate the following phrases from words into algebraic expressions.

Twenty less than a number n . (Hint: you have a number n and you want 20 less than it.)

Answer

n − 20

Your Turn 5.3 (b) §5.1 source ↗

Translate the following phrases from words into algebraic expressions.

Add two to a number n , then multiply it by six.

Answer

( n + 2 ) ⋅ 6 OR 6 ( n + 2 )

6 ( n + 2 )

Alternate answer options:

( n + 2 ) ⋅ 6

6 ⋅ ( n + 2 )

The cross symbol is not usually used in algebra.

Your Turn 5.3 (c) §5.1 source ↗

Translate the following phrases from words into algebraic expressions.

A number n to the third power minus five.

Answer

n 3 − 5
n 3 First, cube your variable.
n 3 − 5 Then, subtract 5.

Your Turn 5.3 (d) §5.1 source ↗

Translate the following phrases from words into algebraic expressions.

A plumber charges $60 per hour h , plus a $40 flat fee for every job.

Answer

60 h + 40
60h First, multiply your variable times 60:
60h + 40 Then, add 40:

Your Turn 5.4 §5.1 source ↗

Translate the following sentences from words into algebraic equations.

Five times y is 50.

Answer

5 y = 50

Break your sentence into components.

Five times y is 50
5y = 50

5 y = 50

Your Turn 5.4 (b) §5.1 source ↗

Translate the following sentences from words into algebraic equations.

Half of a number n is 30.

Answer

1 2 n = 30

Break your sentence into components.

Half of a number n is 30
1 2 n = 30

1 2 n = 30

Alternate answer option:

n 2 = 30

Your Turn 5.4 (c) §5.1 source ↗

Translate the following sentences from words into algebraic equations.

The difference of three times a number n and 7 is 2.

Answer

3 n − 7 = 2

Break your sentence into components.

The difference of three times a number and 7 is 2
3n – 7 = 2

3n – 7 = 2

Your Turn 5.4 (d) §5.1 source ↗

Translate the following sentences from words into algebraic equations.

Two times x plus 7 is 21.

Answer

2 x + 7 = 21

Break your sentence into components.

Two times x plus 7 is 21
2x + 7 = 21

2 x + 7 = 21

Your Turn 5.5 §5.1 source ↗

Use parentheses and the order of operations to make each equation true.

24 − 17 − 6 = 13

Answer

24 − ( 17 − 6 ) = 13

Use PEMDAS to verify.

24 − ( 17 − 6 ) = 24 − 11 = 13

Your Turn 5.5 (b) §5.1 source ↗

Use parentheses and the order of operations to make each equation true.

3 ⋅ 6 + 13 = 31

Answer

( 3 ⋅ 6 ) + 13 = 31

Use PEMDAS to verify.

( 3 ⋅ 6 ) + 13 = 18 + 13 = 31

Your Turn 5.5 (c) §5.1 source ↗

Use parentheses and the order of operations to make each equation true.

12 − 6 ÷ 5 − 3 = 3

Answer

( 12 − 6 ) ÷ ( 5 − 3 ) = 3

Use PEMDAS to verify.

( 12 − 6 ) ÷ ( 5 − 3 ) = 6 ÷ 2 = 3

Your Turn 5.5 (d) §5.1 source ↗

Use parentheses and the order of operations to make each equation true.

5 ⋅ 3 2 + 5 = 70

Answer

5 ⋅ ( 3 2 + 5 ) = 70

Use PEMDAS to verify.

5 ⋅ ( 3 2 + 5 ) = 5 ⋅ ( 9 + 5 ) = 5 ⋅ 14 = 70

Your Turn 5.6 §5.1 source ↗

Evaluate 5 x − 6 when x = 3 .

Answer

5 x − 6 = 5 ( 3 ) − 6 Substitute.
15 − 6 Simplify.

9

9

Your Turn 5.6 (b) §5.1 source ↗

Evaluate x 2 − 6 x + 3 when x = 3 .

Answer

x 2 − 6 x + 3 = 3 2 − 6 ( 3 ) + 3 Substitute.
9 − 18 + 3 Simplify.

–6

− 6

Your Turn 5.7 §5.1 source ↗

Add ( 2 x 2 − 4 x + 5 ) + ( 3 x 2 + x − 12 ) .

Answer

( 2 x 2 − 4 x + 5 ) + ( 3 x 2 + x − 12 )

Like terms are constants or have the same variable and exponent. Group the like terms.

( 2 x 2 + 3 x 2 ) + ( − 4 x + x ) + ( 5 + ( − 12 ) )

Add the coefficients and keep the same variable.

5 x 2 − 3 x − 7

5 x 2 − 3 x − 7

Your Turn 5.8 §5.1 source ↗

Subtract ( x 2 − 4 x + 8 ) − ( x 2 + 5 x + 12 ) .

Answer

( x 2 − 4 x + 8 ) − ( x 2 + 5 x + 12 )

x 2 − 4 x + 8 − x 2 − 5 x − 12 Distribute the subtraction.

Like terms are constants or have the same variable and exponent. Group the like terms.

( x 2 − x 2 ) + ( − 4 x − 5 x ) + ( 8 − 12 )

Add the coefficients and keep the same variable.

− 9 x − 4

− 9 x – 4

Your Turn 5.9 §5.1 source ↗

Simplify each expression.

2 ( y + 5 )

Answer

2 y + 10
2 ( y + 5 ) Use the distributive property.
2 y + 2 ( 5 )
2 y + 10

Your Turn 5.9 (b) §5.1 source ↗

Simplify each expression.

( − 2 ) ( a + b − 4 )

Answer

− 2 a − 2 b + 8
( − 2 ) ( a + b − 4 ) Use the distributive property.
( − 2 ) a + ( − 2 ) b + ( − 2 ) ( − 4 )
− 2 a − 2 b + 8

Your Turn 5.9 (c) §5.1 source ↗

Simplify each expression.

4 2 ( 47 − 40 + x )

Answer

112 + 16 x
4 2 ( 47 − 40 + x ) Simplify. Subtract inside the parentheses.
4 2 ( 7 + x ) Evaluate the exponent.
16 ( 7 + x ) Use the distributive property.
16 ( 7 ) + 16 ( x )
112 + 16 x

Your Turn 5.9 (d) §5.1 source ↗

Simplify each expression.

( 18 ÷ 3 ) ( x + 7 − 4 )

Answer

6 x + 18
( 18 ÷ 3 ) ( x + 7 − 4 ) Simplify. Divide in the first parentheses.
( 6 ) ( x + 7 − 4 ) Subtract in the second parentheses.
( 6 ) ( x + 3 ) Use the distributive property.
6 x + 6 ( 3 )
6 x + 18

Your Turn 5.9 (e) §5.1 source ↗

Simplify each expression.

2 ( 3 a + 5 ) + ( − 3 ) ( a + 2 )

Answer

2 ( 3 a + 5 ) + ( − 3 ) ( a + 2 ) Use the distributive property.
2 ( 3 a ) + 2 ( 5 ) + ( − 3 ) ( a ) + ( − 3 ) ( 2 )
6 a + 10 − 3 a − 6

Like terms are constants or have the same variable and exponent. Group the like terms.

( 6 a − 3 a ) + ( 10 − 6 )

Add the coefficients and keep the same variable.

3 a + 4

3 a + 4

Your Turn 5.10 §5.1 source ↗

Multiply ( x − 4 ) ( 2 x − 3 ) .

Answer

( x − 4 ) ( 2 x − 3 )

Use the distributive property.

x ( 2 x − 3 ) − 4 ( 2 x − 3 )

Use the distributive property again.

x ( 2 x ) − x ( 3 ) − 4 ( 2 x ) − 4 ( − 3 )

Simplify.

2 x 2 − 3 x − 8 x + 12

Like terms are constants or have the same variable and exponent. Add the coefficients and keep the same variable.

2 x 2 − 11 x + 12

2 x 2 − 11 x + 12

Your Turn 5.11 §5.1 source ↗

Divide ( 16 x 2 + 4 x − 8 ) ÷ ( 4 ) .

Answer

4 x 2 + x − 2

( 16 x 2 + 4 x − 8 ) ÷ ( 4 ) Divide each term by 4.
( 16 x 2 ÷ 4 ) + ( 4 x ÷ 4 ) + ( − 8 ÷ 4 ) Simplify.
4 x 2 + x − 2

Check Your Understanding 5.1.1 §5.1 source ↗

Juliette is 2 inches taller than her friend Vivian. Which algebraic equations represent their height? Use J for Juliette’s height and V for Vivian’s height.
J = V + 2
V = J − 2
J + 2 = V
J = V − 2

Answer

Juliette is 2 inches taller than Vivian.

You can test these with sample numbers. If Vivian is 50 inches tall, then Juliette is 52 inches tall.

J = V + 2
52 = 50 + 2 This works, so J = V + 2 works.
V = J − 2
50 = 52 − 2 This works, so V = J − 2 works.
J + 2 = V
52 + 2 = 50 This is false, so this does not work.
J = V − 2
52 = 50 − 2 This is false, so this does not work.
J = V + 2 , V = J − 2

Check Your Understanding 5.1.2 §5.1 source ↗

Which options represent algebraic expressions?
2 x 2 + 3 x − 1 = 0
5 x + 8
2 n + 3 m
5 x − 7 = 3 x + 1

Answer

Expressions relate numbers and variables to each other without involving an equal sign. Equations tell you that two quantities are equal. Look for the equal sign to tell you the difference. These are expressions:

5 x + 8

2 n + 3 m

5 x + 8 , 2 n + 3 m

Check Your Understanding 5.1.3 §5.1 source ↗

Which expression equals 10 x ?
( 8 x + 12 x ) ÷ 4 x − 2 x
8 x + ( 12 x ÷ 4 x ) − 2 x
8 x + 12 x ÷ ( 4 x − 2 x )
( 8 x + 12 x ) ÷ ( 4 x − 2 x )

Answer

( 8 x + 12 ) ÷ 4 x − 2 x Divide the first two terms by 4x.
( 8 x ÷ 4 x ) + ( 12 ÷ 4 x ) − 2 x Simplify.
2 + 3 x − 2 x

Like terms are constants or have the same variable and exponent. Add the coefficients and keep the same variable.

2 + x This is not equal to 10x. Try again.
8 x + ( 12 ÷ 4 x ) − 2 x Divide 12 by 4x.
8 x + ( 3 x ) − 2 x Combine the like terms.
9 x This is not equal to 10. Try again.
8 x + 12 x ÷ ( 4 x − 2 x ) Subtract inside the parentheses.
8 x + 12 x ÷ ( 2 x ) Divide by 2x.
8 x + 6 This is not equal to 10. Try again.
( 8 x + 12 x ) ÷ ( 4 x − 2 x ) Do the operations inside the parentheses.
( 20 x ) ÷ ( 2 x ) Divide.
10 This is equal to 10.

The expression ( 8 x + 12 x ) ÷ ( 4 x − 2 x ) equals 10.

( 8 x + 12 x ) ÷ ( 4 x − 2 x )

Check Your Understanding 5.1.4 §5.1 source ↗

Using the expression 3 x 2 − 7 x + 2 , when a certain number is put in for x , the result is 50. What is the value of x ?
− 2
− 3
2
3

Answer

3 x 2 − 7 x + 2 Try each of the given numbers to see which results in 50.
3 ( − 2 ) 2 − 7 ( − 2 ) + 2
3 ( 4 ) + 14 + 2 = 12 + 14 + 2 = 28 That is not 50. Try again.
3 ( − 3 ) 2 − 7 ( − 3 ) + 2
3 ( 9 ) + 21 + 2 = 27 + 23 = 50 This worked.

The value of x that makes the result 50 is –3.

− 3

Check Your Understanding 5.1.5 §5.1 source ↗

Which expression equals ( x − y ) ( x − y ) ? Hint: Use the Distributive Property.
x 2 − y 2
x 2 + y 2
x 2 − 2 x y − y 2
x 2 − 2 x y + y 2

Answer

( x − y ) ( x − y ) Use the distributive property.
x ( x − y ) − y ( x − y ) Use the distributive property again.
x ( x ) − x ( y ) − y ( x ) − y ( − y ) Simplify.
x 2 − x y − x y + y 2
x 2 − 2 x y + y 2

Two of the answers only have two terms, which is clearly wrong.

One of the answers forgot that when you multiply a negative by a negative, the answer is a positive. It has the wrong sign on the squared y term.

The correct answer is x 2 − 2 x y + y 2 .

x 2 − 2 x y + y 2

Check Your Understanding 5.1.6 §5.1 source ↗

Given the expression 9 x 3 + 3 x 2 − 6 x , the Distributive Property allows it to be rewritten as:
3 x ( 3 x 2 + x − 2 )
3 x 2 + x − 2
27 x 5 − 54 x 4
27 x 6 − 54 x 3

Answer

3 x ( 3 x 2 + x − 2 )

Using the distributive property “in reverse” you can factor out 3x.

9 x 3 + 3 x 2 − 6 x = 3 x ( 3 x 2 + x − 2 )

Check Your Understanding 5.1.7 §5.1 source ↗

Given the two algebraic expressions ( x + 2 ) and ( x + y − 5 ) , the solution is x 2 + x y − 3 x + 2 y − 10 . What mathematical operation was performed on the two algebraic expressions?

Answer

You can tell because you need multiplication to be able to generate an x 2 term by multiplication.

multiplication

Check Your Understanding 5.1.8 §5.1 source ↗

Given the two algebraic expressions 8 x 2 − 9 x + 6 and 6 x , the solution is 3 x − 1.5 + 1 x . What mathematical operation was performed on the two algebraic expressions?

Answer

You can tell because you need division to be able to generate a 1 x term.

division

Your Turn 5.12 §5.2 source ↗

Solve 2 ( x + 1 ) − 3 = 5

Answer

2 ( x + 1 ) − 3 = 5

Step 1: Simplify each side as much as possible.

2 x + 2 − 3 = 5

2 x + 2 − 3 = 5

2 x − 1 = 5

Step 2: Collect the variable terms on one side.

2 x − 1 = 5

There is nothing to do here.

Step 3: Collect the constant terms on the other side.

2 x − 1 + 1 = 5 + 1

2 x = 6

Step 4: Make the coefficient of the variable term equal to 1.

2 x 3 = 6 3

x = 3

Step 5: Checking is left to you.

x = 3

Your Turn 5.13 §5.2 source ↗

Solve 6 ( y − 2 ) − 5 y = 4 ( y + 3 ) − 4 ( y − 1 ) .

Answer

6 ( y − 2 ) − 5 y = 4 ( y + 3 ) − 4 ( y − 1 )

Step 1: Simplify each side as much as possible.

6 y − 12 − 5 y = 4 y + 12 − 4 y + 4

y − 12 = 16

Step 2: Collect the variable terms on one side.

y − 12 = 16

There is nothing to do here.

Step 3: Collect the constant terms on the other side.

y − 12 + 12 = 16 + 12

y = 28

Step 4: Make the coefficient of the variable term equal to 1.

y = 28

You are already done. This is the solution.

Step 5: Checking is left to you.

y = 28

Your Turn 5.14 §5.2 source ↗

Sam and Henry are roommates. Together, they have 68 books. Sam has 26 books. How many books does Henry have?

Answer

Let S = Sam’s books and H = Henry’s books.

Together they have 68 books, so S + H = 68

Sam has 26 books, so substitute 26 for S.

26 + H = 68

Solve for H.

Step 1: Simplify each side as much as possible.

26 + H = 68

Step 2: Collect the variable terms on one side.

26 + H = 68

This is already done.

Step 3: Collect the constant terms on the other side.

26 + H – 26 = 68 – 26

H = 42

Step 4: Make the coefficient of the variable term equal to 1.

H = 42

You are already done. This is the solution.

Step 5: Checking is left to you.

Henry has 42 books.

Henry has 42 books.

Your Turn 5.15 §5.2 source ↗

On June 7, 2021, the national average price for regular gasoline was $3.053 per gallon. If Aiko fills up his car with 16 gallons, how much is the total cost? Round to the nearest cent.

Answer

The average price is $3.053 per gallon. Aiko fills up his car with 16 gallons.

Total cost = 16   g a l l o n s ( 3.053   d o l l a r s 1   g a l l o n ) ≈ 48.85   d o l l a r s

The total cost is $48.85.

Total cost is $48.85

Your Turn 5.16 §5.2 source ↗

Write an application that can be solved using the equation 25 x + 75 = 200 . Then solve your application.

Answer

The application you write will vary.

Then, solve the algebraic equation: 25 x + 75 = 200

Step 1: Simplify each side as much as possible.

This is already done.

25 x + 75 = 200

Step 2: Collect the variable terms on one side.

This is already done.

25 x + 75 = 200

Step 3: Collect the constant terms on the other side.

25 x + 75 − 75 = 200 − 75

25 x = 125

Step 4: Make the coefficient of the variable term equal to 1.

25 x 25 = 125 25

x = 5

Write a sentence that uses the 5 regarding your application.

Step 5: Checking is left to you.

Answers will vary. For example: You can rent a paddleboard for $25 per hour with a water shoe purchase of $75. If you spent $200, how many hours did you rent the paddle board for?
You rented the paddle board for 5 hours.

Your Turn 5.17 §5.2 source ↗

Solve 2 ( x + 6 ) = 3 x + 4 − ( x + 5 ) .

Answer

2 ( x + 6 ) = 3 x + 4 − ( x + 5 )

Step 1: Simplify each side as much as possible.

2 x + 12 = 3 x + 4 − x − 5

2 x + 12 = 2 x − 1

Step 2: Collect the variable terms on one side.

2 x + 12 − 2 x = 2 x − 1 − 2 x

12 = − 1

This is a false statement, so this equation has no solution.

12 = − 1 , which is false; therefore, this is a false statement, and the equation has no solution.

Your Turn 5.18 §5.2 source ↗

Solve 3 x − 7 − ( x + 5 ) = 2 ( x − 6 ) .

Answer

3 x − 7 − ( x + 5 ) = 2 ( x − 6 )

Step 1: Simplify each side as much as possible.

3 x − 7 − x − 5 = 2 x − 12

2 x − 12 = 2 x − 12

Step 2: Collect the variable terms on one side.

2 x − 12 − 2 x = 2 x − 12 − 2 x

− 12 = − 12

This statement is always true. The variable does not matter at all, so there are infinitely many solutions.

− 12 = − 12 , which is true; therefore, this is a true statement, and there are infinitely many solutions.

Your Turn 5.19 §5.2 source ↗

Solve the formula I = P r t for t . This formula is used to calculate simple interest I , for a principal P , invested at a rate r , for t years.

Answer

Solve I = P r t for t. Treat t as the variable and everything else as “constants.”

You can skip to Step 4: Make the coefficient of the variable term equal to 1.

I P r = P r t P r

I P r = t

Alternate answer option: t = I P r

Step 5: Checking is left to you.

t = I P r

Your Turn 5.20 §5.2 source ↗

Solve the formula V = 1 3 π r 2 h for h . This formula is used to calculate the volume V of a right circular cone with radius r and height h .

Answer

V = 1 3 π r 2 h

Treat h as the variable and everything else as “constants.”

You can skip to Step 4: Make the coefficient of the variable term equal to 1.

3 V = 1 3 π r 2 h ( 3 )

3 V = π r 2 h

3 V π r 2 = π r 2 h π r 2

3 V π r 2 = h

Alternate answer option: h = 3 V π r 2

h = 3 V π r 2

Check Your Understanding 5.2.9 §5.2 source ↗

Is the solution strategy used in solving the linear equation correct? If it is correct, show the final step (check the solution). If it is not correct, explain why.
8 ( x − 2 ) = 6 ( x + 10 ) 8 x − 16 = 6 x + 60 8 x − 16 − 6 x = 6 x + 60 − 6 x 2 x − 16 + 16 = 60 + 16 2 x = 76 x = 38

Answer

It is a correct solution strategy.
Let
x = 38 8 ( 38 − 2 ) = ? 6 ( 38 + 10 ) 8 ( 36 ) = ? 6 ( 48 ) 288 = 288 ✓

Check Your Understanding 5.2.10 §5.2 source ↗

Is the solution strategy used in solving the linear equation correct? If it is correct, show the final step (check the solution). If it is not correct, explain why.
7 + 4 ( 2 + 5 x ) = 3 ( 6 x + 7 ) − ( 13 x + 36 ) 7 + 8 + 20 x = 18 x + 21 − 13 x − 36 15 + 20 x = 5 x − 15 15 + 20 x − 5 x = 5 x − 15 − 5 x 15 + 15 x − 15 = − 15 − 15 15 x = − 30 x = − 2

Answer

It is a correct solution strategy.
Let
x = − 2 7 + 4 ( 2 + 5 ( − 2 ) ) = ? 3 ( 6 ( − 2 ) + 7 ) − ( 13 ( − 2 ) + 36 ) 7 + 4 ( 2 − 10 ) = ? 3 ( − 12 + 7 ) − ( − 26 + 36 ) 7 + 4 ( − 8 ) = ? 3 ( − 5 ) − ( 10 ) 7 − 32 = ? − 15 − 10 − 25 = − 25 ✓

Check Your Understanding 5.2.11 §5.2 source ↗

Is the solution strategy used in solving the linear equation correct? If it is correct, show the final step (check the solution). If it is not correct, explain why.
8 x + 7 − ( 2 x − 9 ) = 22 − ( 4 x − 4 ) 8 x + 7 − 2 x − 9 = 22 − 4 x − 4 6 x − 2 = 18 − 4 x 6 x − 2 + 4 x = 18 − 4 x + 4 x 10 x − 2 + 2 = 18 + 2 10 x = 20 x = 2

Answer

This is not a correct solution strategy. The negative sign is not distributed correctly in the second line of the solution strategy. The second line should read 8 x + 7 − 2 x + 9 = 22 − 4 x + 4 .

Check Your Understanding 5.2.12 §5.2 source ↗

For the following exercises, use this scenario: The Nice Cab Company charges a flat rate of $3.00 for each fare, plus $1.70 per mile. A competing taxi service, the Enjoyable Cab Company, charges a flat rate of $5.00 for each fare, plus $1.60 per mile.

Using the variable x for number of miles, write the equation that would allow you to find the total fare ( T ) using the Nice Cab Company.

Answer

Break your words into components.

The total fare is a flat fee of $3.00 plus $1.70 per mile
T = 3 + 1.7x

T = 3 + 1.7 x

Alternate answer option: T = 1.7 x + 3

T = 1.7 x + 3

Check Your Understanding 5.2.13 §5.2 source ↗

For the following exercises, use this scenario: The Nice Cab Company charges a flat rate of $3.00 for each fare, plus $1.70 per mile. A competing taxi service, the Enjoyable Cab Company, charges a flat rate of $5.00 for each fare, plus $1.60 per mile.

It is 22 miles from the airport to your hotel. What would be your total fare using the Nice Cab Company?

Answer

Substitute 22 for x in the equation T = 3 + 1.7 x .

T = 3 + 1.7 ( 22 ) = 3 + 37.4 = 40.4

The ride from the airport to the hotel costs $40.40.

$40.40

Check Your Understanding 5.2.14 §5.2 source ↗

For the following exercises, use this scenario: The Nice Cab Company charges a flat rate of $3.00 for each fare, plus $1.70 per mile. A competing taxi service, the Enjoyable Cab Company, charges a flat rate of $5.00 for each fare, plus $1.60 per mile.

Using the variable y for number of miles, write the equation that would allow you to find the total fare ( T ) using the Enjoyable Cab Company.

Answer

Break your words into components.

The total fare is a flat fee of $5.00 plus $1.60 per mile
T = 5 + 1.6y

T = 5 + 1.6 y

Alternate answer option: T = 1.6 y + 5

T = 1.6 y + 5

Check Your Understanding 5.2.15 §5.2 source ↗

For the following exercises, use this scenario: The Nice Cab Company charges a flat rate of $3.00 for each fare, plus $1.70 per mile. A competing taxi service, the Enjoyable Cab Company, charges a flat rate of $5.00 for each fare, plus $1.60 per mile.

Using the same 22-mile trip from the airport to the hotel, how much would the total fare be for using the Enjoyable Cab Company?

Answer

Substitute 22 for y in the equation T = 5 + 1.6 y .

T = 5 + 1.6 ( 22 ) = 5 + 35.2 = 40.2

The ride from the airport to the hotel costs $40.20.

$40.20

Check Your Understanding 5.2.16 §5.2 source ↗

For the following exercises, use this scenario: The Nice Cab Company charges a flat rate of $3.00 for each fare, plus $1.70 per mile. A competing taxi service, the Enjoyable Cab Company, charges a flat rate of $5.00 for each fare, plus $1.60 per mile.

Based on the cost of each cab ride, which cab company should you use for the trip from the airport to the hotel? Why?

Answer

The Enjoyable Cab Company costs $40.20, while the Nice Cab Company costs 20 cents more at $40.40. You should use the Enjoyable Cab Company.

40.40 – 40.20 = 0.20

The Enjoyable Cab Company, because the cab fare will be $ 0.20 less than what it would cost to take a taxi from the Nice Cab Company.

Check Your Understanding 5.2.17 §5.2 source ↗

After solving the linear equation 3 ( 2 x − 3 ) = 12 ( x − 3 ) − 3 ( 2 x − 9 ) , Nancy says there is no solution. Luis believes there are infinitely many solutions. Who is right?

Answer

3 ( 2 x − 3 ) = 12 ( x − 3 ) − 3 ( 2 x − 9 )

Step 1: Simplify each side as much as possible.

6 x − 9 = 12 x − 36 − 6 x + 27

6 x − 9 = 6 x − 9

Step 2: Collect the variable terms on one side.

6 x − 9 − 6 x = 6 x − 9 − 6 x

− 9 = − 9

This statement is always true. The variable does not matter at all, so there are infinitely many solutions.

Luis is right.

Luis is; there are infinitely many solutions. If this is solved using the general strategy, it simplifies to 0 = 0 . This is a true statement, so there are infinitely many solutions.

Check Your Understanding 5.2.18 §5.2 source ↗

The conversion formula between the Fahrenheit temperature scale and the Celsius temperature scale is given by this formula: C = 5 9 ( F − 32 ) , where C is the temperature in degrees Celsius and F is the temperature in degrees Fahrenheit. What is the correct formula when solved for F ?
  1. a.
    F = 5 9 C − 32
  2. b.
    F = 9 5 C − 32
  3. c.
    F = 5 9 C + 32
  4. d.
    F = 9 5 C + 32

Answer

D. F = 9 5 C + 32
d F = 9 5 C + 32
C = 5 9 ( F − 32 ) Treat F as the variable and everything else as “constants.”
( 9 5 ) C = ( 9 5 ) 5 9 ( F − 32 ) Multiply both sides by ( 9 5 ) .
( 9 5 ) C = F − 32
( 9 5 ) C + 32 = F − 32 + 32 Add 32 to both sides.
9 5 C + 32 = F Switch sides to make it look like the answer options.
F = 9 5 C + 32 This is option (d).

Check Your Understanding 5.2.19 §5.2 source ↗

To find a temperature on the Kelvin temperature scale, add 273 degrees to the temperature in Celsius. Which formula illustrates this?
  1. a.
    C = K + 273
  2. b.
    K = C + 273
  3. c.
    K = C − 273
  4. d.
    C = K − 273

Answer

B. K = C + 273
b

Break your words into components.

A temperature in Kelvin is the Celsius temperature plus 273 degrees
K = C + 273

K = C + 273

K = C + 273 , although d C = K – 273 is an equivalent formula.

Check Your Understanding 5.2.20 §5.2 source ↗

Using the information from exercise 18 and exercise 19, which conversion formula would you use to find degrees Kelvin when given degrees Fahrenheit?
  1. a.
    K = 5 9 ( F − 32 ) + 273
  2. b.
    K = 5 9 F + 241
  3. c.
    K = 9 5 ( F − 32 ) + 273
  4. d.
    K = 9 5 F + 241

Answer

A. K = 5 9 ( F − 32 ) + 273
a

Use C = 5 9 ( F − 32 ) and K = C + 273 to find a Kelvin temperature given degrees Fahrenheit.

K = C + 273

K = 5 9 ( F − 32 ) + 273 Substitute the right side of the Fahrenheit to Celsius formula.
K = 5 9 ( F − 32 ) + 273

Check Your Understanding 5.2.21 §5.2 source ↗

There is a fourth temperature scale, although it is not used much today. The Rankin temperature scale varies from the Fahrenheit scale by about 460 degrees. So given a temperature in Fahrenheit, add 460 degrees to get the temperature in Rankin. Which formula represents a formula to find degrees Rankin when given degrees Celsius?
  1. a.
    R = 5 9 C − 492
  2. b.
    R = 9 5 C + 492
  3. c.
    R = C + 492
  4. d.
    R = 5 9 ( C − 492 )

Answer

B. R = 9 5 C + 492
b

Break your words into components.

A temperature in Rankin is the Fahrenheit temperature plus 460 degrees
R = F + 460

Use F = 9 5 C + 32 and R = F + 460 to find a Rankin temperature given degrees Celsius.

R = F + 460
R = 9 5 C + 32 + 460 Substitute the right side of the Fahrenheit to Celsius formula.
R = 9 5 C + 492
R = 9 5 C + 492

Your Turn 5.21 §5.3 source ↗

Graph the inequality x < 2.5 and write the solution in interval notation.

Answer

For the graph, shade to the left of 2.5 to show the solution includes all numbers left of 2.5, then put a parenthesis at 2.5 to show that 2.5 is not included.

Write in interval notation with a parenthesis and negative infinity on the left to show that the solution includes all numbers less than 2.5. After a comma, write 2.5 with a parenthesis to show that 2.5 is not included in the solution.

(–∞, 2.5)
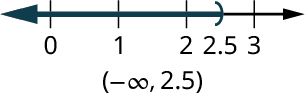
A number line ranges from 0 to negative 3, in increments of 1. A close parenthesis is marked at 2.5. The region to the left of the parenthesis is shaded on the number line. Text reads, (negative infinity, 2.5)

Your Turn 5.22 §5.3 source ↗

Graph the inequality x ≥ 0 and x ≤ 2.5 and write the solution in interval notation.

Answer

Graph x ≥ 0 and x ≤ 2.5 . The area where they overlap is the solution.

Graphically: Place a bracket at 0 facing to the right and a bracket at 2.5 facing to the left. Shade in between the two brackets.

Interval notation: [0,2.5]

0 ≤ x ≤ 2.5
Graph:
A number line ranges from negative 1 to 3.5, in increments of 0.5. An open square bracket is marked at 0.0 and a close parenthesis is marked at 2.5. The region within the parentheses is shaded on the number line. Text reads, (0, 2.5)

Your Turn 5.23 §5.3 source ↗

Solve − 13 m ≥ 65 , graph the solution on the number line, and write the solution in interval notation.

Answer

First solve the inequality.

− 13 m ≥ 65 Divide by –13.
− 13 m − 13 ≤ 65 − 13 Switch the sign to ≤ since you divided by a negative number.
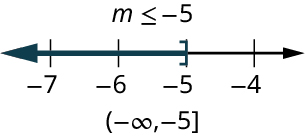
m ≤ − 5

For the graph, shade to the left of − 5 to show all numbers left of − 5 are included, then put a bracket at − 5 to show that the solution includes − 5 .

Write in interval notation with a parentheses and negative infinity on the left to show that the solution includes all numbers less than − 5 . After a comma, write − 5 with a bracket to show that − 5 is included in the solution.

(–∞, –5]

A number line ranges from negative 7 to negative 4, in increments of 1. A close square bracket is marked at negative 5. The region to the left of the square bracket is shaded on the number line. Text reads, m is less than or equal to negative 5, (negative infinity, negative 5)

Your Turn 5.24 §5.3 source ↗

Solve the inequality 8 p + 3 ( p − 12 ) ≥ 7 p − 28 , graph the solution on the number line, and write the solution in interval notation.

Answer

8 p + 3 ( p − 12 ) ≥ 7 p − 28

First solve the inequality.

8 p + 3 ( p − 12 ) ≥ 7 p − 28 Distribute.
8 p + 3 p − 36 ≥ 7 p − 28 Simplify.
11 p − 36 ≥ 7 p − 28 .
11 p − 36 − 7 p ≥ 7 p − 28 − 7 p Collect variable terms on the left.
4 p − 36 ≥ − 28
4 p − 36 + 36 ≥ − 28 + 36 Collect constants on the right.
4 p ≥ 8
4 p 4 ≥ 8 4 Divide by 4.
p ≥ 2

For the graph, place a bracket at 2 to show that the solution includes 2. Shade to the right of 2 to show all numbers right of 2 are included.

Write in interval notation with a bracket at 2 to show that 2 is included. Then shade to the right to show that all numbers greater than 2 are part of the solution.
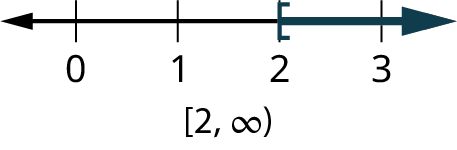
 
p ≥ 2 A number line ranges from 0 to 3, in increments of 1. An open square bracket is marked at 2. The region to the right of the square bracket is shaded on the number line. Text reads, (2, infinity).

Your Turn 5.25 §5.3 source ↗

Taleisha’s phone plan costs her $28.80 per month plus $0.20 per text message. How many text messages can she send/receive and keep her monthly phone bill no more than $50?

Answer

Break the words into components.

The bill is no more than $28.80 flat fee plus $0.20 per message
B ≥ 28.80 + 0.20m

Keep the bill to no more than $50.

Keep 28.80 + 0.2 m ≤ 50 .

Solve the inequality 28.80 + 0.2 m ≤ 50 .

28.80 + 0.2 m ≤ 50 − 28.80 Collect the constants on one side.
0.2 m ≤ 21.2
0.2 m 0.2 ≤ 21.2 0.2 Divide both sides by 0.2.
m ≤ 106

Taleisha can send no more than 106 text messages per month.

Taleisha can send/receive 106 or fewer text messages and keep her monthly bill no more than $50.

Your Turn 5.26 §5.3 source ↗

You are awarded a $500 scholarship! In addition to the $1,500 you have saved for tuition, you now have an additional $500 to spend on credit hours for fall semester. Now, how many credit hours could you take this fall semester? Assume the cost is still $113 per credit hour.

Answer

Break the words into components.

The number of credit hours you can take is no more than $1,500 saved plus $500 scholarship divided by $113 cost of one credit hour
H ≤ (1,500 + 500) / 113

You can spend no more than the money you saved plus your scholarship.

Solve H ≤ 1 , 500 + 500 113

H ≤ 2 , 000 113

H ≤ 17.699....

Since you can only take a whole number of credit hours, you can take at most 17 credit hours.

You could take up to 17 credit hours and stay under $2,000.

Your Turn 5.27 §5.3 source ↗

Malik is planning a 6-day summer vacation trip. He has $840 in savings, and he earns $45 per hour for tutoring. The trip will cost him $525 for airfare, $780 for food and sightseeing, and $95 per night for the hotel. How many hours must he tutor to have enough money to pay for the trip?

Answer

Malik must tutor at least 23 hours.

Malik plans a 6-day vacation.

$840 in savings.

Earns $45 per hour.

Static Costs: $525, $780

Daily costs: $95 per night for 6 nights = $570

Savings – Costs: 840 − ( 525 + 780 + 570 ) = 840 − 1 , 875 = − 1 , 035

Malik still needs to earn $1,035.

Break the words into components.

1,035 is no less than 45 times hours worked
1,035 ≤ 45 ∙ h

Solve the inequality 1 , 035 ≤ 45 h

1 , 035 ≤ 45 h Divide both sides by 45.
1 , 035 45 ≤ 45 h 45
23 ≤ h

Malik needs to tutor at least 23 hours.

Check Your Understanding 5.3.22 §5.3 source ↗

For the following exercises, choose the correct interval notation for the graph.
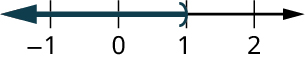
A number line ranges from negative 1 to 2, in increments of 1. A close parenthesis is marked at 1. The region to the left of the parenthesis is shaded on the number line.

a. [ − 1 , ∞ )

b. ( − 1 , 1 )

c. ( ∞ , 1 )

d. ( − ∞ , 1 )

e. ( − ∞ , − 1 )

Answer

The parenthesis indicates that 1 is not included in the solution. The region shaded is to the left of 1, so that means the solution includes numbers less than 1. In interval notation, this looks like ( − ∞ , − 1 ) .

Notice that the interval notation version is in the same order as the graph. Negative infinity is on the left and 1 is on the right.

d ( − ∞ , − 1 )

Check Your Understanding 5.3.23 §5.3 source ↗

For the following exercises, choose the correct interval notation for the graph.
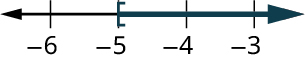
A number line ranges from negative 6 to negative 3, in increments of 1. An open square bracket is marked at negative 5. The region to the right of the square bracket is shaded on the number line.

a. ( − 5 , ∞ )

b. [ − 5 , ∞ )

c. [ − 5 , ∞ )

d. [ − 5 , − 3 )

e. [ − 5 , − 3 ]

Answer

The bracket indicates that 5 is included in the solution. The region shaded is to right of 5, so that means the solution includes numbers greater than 5. In interval notation, this looks like [ 5 , ∞ ) .

Notice that the interval notation version is in the same order as the graph. The number 5 is on the left and positive infinity is on the right.

b [ − 5 , ∞ )

Check Your Understanding 5.3.24 §5.3 source ↗

For the following exercises, choose the correct interval notation for the graph.
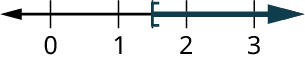
A number line ranges from 0 to 3, in increments of 1. An open square bracket is marked at 1.5. The region to the right of the square bracket is shaded on the number line.

a. ( 1 , ∞ )

b. [ 1 , ∞ )

c. [ 3 2 , ∞ )

d. ( 3 2 , ∞ )

e. ( ∞ , 3 2 )

Answer

The bracket indicates that 3 2 is included in the solution. The region shaded is to right of 3 2 , so that means the solution includes numbers greater than 3 2 . In interval notation, this looks like [ 3 2 , ∞ ) .

Notice that the interval notation version is in the same order as the graph. The number 3 2 is on the left and positive infinity is on the right.

c [ 3 2 , ∞ )

Check Your Understanding 5.3.25 §5.3 source ↗

For the following exercises, choose the correct interval notation for the graph.

A number line ranges from negative 5 to 4, in increments of 1. An open parenthesis is marked at negative 4 and a close parenthesis is marked at 3. The region within the parentheses is shaded on the number line.

a. ( − 4 , 3 )

b. ( 3 , − 4 )

c. [ − ∞ , ∞ )

d. [ − 4 , 3 ]

e. [ 3 , − 4 ]

Answer

The solution is shaded between parentheses at –4 and 3. This corresponds in interval notation to those numbers between parentheses with a comma in between.

( − 4 , 3 )

a ( − 4 , 3 )

Check Your Understanding 5.3.26 §5.3 source ↗

[ 4 , ∞ ) is the solution for which inequality?
  1. a.
    4 x ≥ 0
  2. b.
    4 x ≤ 0
  3. c.
    6 x < 24
  4. d.
    6 x > 24
  5. e.
    6 x ≥ 24

Answer

E. 6 x ≥ 24
e
6 x ≥ 24 This is the correct answer.
6 x 6 ≥ 24 6 Divide by 6.
x ≥ 4
[ 4 , ∞ ) This is interval notation.
6 x ≥ 24

Check Your Understanding 5.3.27 §5.3 source ↗

( − ∞ , − 3 ) is the solution for which inequality?
  1. a.
    − 6 x < 18
  2. b.
    − 6 x > 18
  3. c.
    − 6 x ≤ 18
  4. d.
    − 6 x ≥ 18
  5. e.
    − 6 x ≤ − 18

Answer

B. − 6 x > 18
b
− 6 x ≥ 18 This is the correct answer.
− 6 x − 6 ≤ 18 − 6 Divide by –6 and switch the sign because you divided by a negative number.
x ≤ − 3
( − ∞ , − 3 ) This is interval notation.
− 6 x > 18

Check Your Understanding 5.3.28 §5.3 source ↗

( − 2 , ∞ ) is the solution for which inequality?
  1. a.
    − 4 x > − 8
  2. b.
    4 x + 3 > − 11
  3. c.
    4 x − 3 > − 11
  4. d.
    − 4 x ≤ − 8
  5. e.
    − 4 x + 3 ≤ 5

Answer

C. 4 x − 3 > − 11
c
4 x − 3 > − 11 This is the correct answer.
4 x − 3 + 3 > − 11 + 3 Add 3.
4 x > − 8
4 x 4 > − 8 4 Divide by 4.
x > − 2
( − 2 , ∞ ) This is interval notation.
4 x − 3 > − 11

Check Your Understanding 5.3.29 §5.3 source ↗

( − ∞ , 9 ) is the solution for which inequality?
  1. a.
    9 x < 0
  2. b.
    − 3 x ≥ 27
  3. c.
    − 3 x + 14 > − 13
  4. d.
    − 3 x − 14 > − 13
  5. e.
    − 3 x ≥ 27

Answer

C. − 3 x + 14 > − 13
c
− 3 x + 14 > − 13 This is the correct answer.
− 3 x + 14 − 14 > − 13 − 14 Subtract 14
− 3 x > − 27
− 3 x − 3 < − 27 − 3 Divide by –3 and switch the sign since you divided by a negative number.
x < 9
( − ∞ , 9 ) This is interval notation.
− 3 x + 14 > − 13

Check Your Understanding 5.3.30 §5.3 source ↗

For the following exercises, choose the equation that best models the situation.

Renaldo is hauling boxes of lawn chairs. Each box is the same size, 8 cubic feet. Renaldo’s truck has a capacity of 764 cubic feet. How many boxes of lawn chairs can Renaldo put in his truck?
  1. a.
    8 < 764 x
  2. b.
    8 x < 764
  3. c.
    8 > 764 x
  4. d.
    8 x > 764
  5. e.
    None of these

Answer

B. 8 x < 764
b

Break your words into components.

Let x = the number of lawn chairs.

8 cubic feet = size of one box.

764 cubic feet = capacity of truck.

Break the words into components.

764 is the maximum for 8 times number of boxes
764 < 8 ∙ x

Solve the inequality 764 > 8 x

764 > 8 x Reverse to match one of the options.
8 x < 764 This is correct. You do not need to solve further for this exercise.
8 x < 764

Check Your Understanding 5.3.31 §5.3 source ↗

For the following exercises, choose the equation that best models the situation.

Bernadette babysits the neighbor’s kids, making on average $50 a night. How many nights will she have to babysit in order to earn enough money to buy a used car, whose cost is $8,120?
  1. a.
    50 < 8,120x
  2. b.
    50 x < 8,120
  3. c.
    50 < 8,120x
  4. d.
    50 x > 8,120
  5. e.
    None of these

Answer

D. 50 x > 8,120
d

Break your words into components.

Let x = the number of nights to babysit.

$50 = the average amount earned per night babysitting.

$8,120 = the amount needed to buy a car.

Break the words into components.

$8,120 is the minimum needed 50 times number of nights babysitting
8,120 < 50 ∙ x

Solve the inequality 8 , 120 ≥ 50 x

8 , 120 < 50 x Reverse to match one of the options.
50 x > 8 , 120 This is correct. You do not need to solve further for this exercise.
50 x > 8,120

Your Turn 5.28 §5.4 source ↗

On June 9, 2021, 1 U.S. dollar was worth 1.21 Canadian dollars. Write this comparison as a ratio.

Answer

There are three ways to write ratios: a to b, a:b, or a/b, which can be written with fraction notation ( a b ) .

If a = 1 U.S. dollar, and b = 1.21 Canadian dollars, the ratio can be written in one of three ways.

1 to 1.21

1:1.21

1 1.21

a = 1 U.S. dollar, and b = 1.21 Canadian dollars, the ratio is 1 to 1.21; or 1:1.21; or 1 1.21 .

Your Turn 5.29 §5.4 source ↗

A person who weighs 170 pounds on Earth would weigh 64 pounds on Mars. Write this comparison as a ratio.

Answer

There are three ways to write ratios: a to b, a:b, or a/b, which can be written with fraction notation ( a b ) .

If a = 170 pounds, and b = 64 pounds, the ratio can be written in one of three ways.

170 to 64

170:64

170 64

With a = 170 pounds on Earth, and b = 64 pounds on Mars, the ratio is 170 to 64; or 170:64; or 170 64 .

Your Turn 5.30 §5.4 source ↗

After your trip to France, you have 180 Euros remaining. You wish to convert them back into U.S. dollars. Assuming the exchange rate is the same ( $ 1 = 0.82 € ) , how many dollars should you receive? Round to the nearest cent if necessary.

Answer

Set up the two ratios as proportions.

Let x = the number of dollars you should receive.

Create ratios with U.S. dollars in the numerator and Euros in the denominator. It helps many students to create a table to help set up their ratios.

  Exchange What I have or want
U.S. Dollars 1 x
Euros 0.82 180

Set up your proportion.

1 0.82 = x 180
1 ( 180 ) = 0.82 x Cross multiply.
180 0.82 = 0.82 x 0.82 Divide. Approximate to two decimal places since this is money.
219.51 ≈ x

You should receive $219.51.

$219.51

Your Turn 5.31 §5.4 source ↗

A person who weighs 200 pounds on Earth would weigh only 33 pounds on the moon. A 2021 Toyota Prius weighs 3,040 pounds on Earth; how much would it weigh on the moon? Round to the nearest tenth if necessary.

Answer

Set up the two ratios as proportions.

Let x = weight on the moon.

It helps many students to create a table to help set up their ratios.

  Conversion What I have or want
Weight on Earth 200 3,040
Weight on the moon 33 x

Set up your proportion.

200 33 = 3 , 040 x
200 x = ( 33 ) ( 3 , 040 ) Cross multiply.
200 x = 100 , 320
200 x 200 = 100 , 320 200 Divide.
x = 501.6

The weight of the car on Mars is exactly 501.6 pounds.

501.6 pounds

Your Turn 5.32 §5.4 source ↗

You are going to bake cookies, using the same recipe as above. You find out that you have 27 cups of flour in your pantry. Assuming you have all the other ingredients necessary, how many cookies can you make with 27 cups of flour?

Answer

Set up the two ratios as proportions.

Let x = the number of cookies you can make.

It helps many students to create a table to help set up their ratios.

  Recipe What I have or want
Cups of flour 2.25 27
Cookies 60 x

Set up your proportion.

2.25 60 = 27 x
2.25 x = ( 60 ) ( 27 ) Cross multiply.200x
2.25 x = 1 , 620
2.25 x 2.25 = 1 , 620 2.25 Divide.
x = 720

You can make 720 cookies.

720 cookies

Your Turn 5.33 §5.4 source ↗

The following table contains the lengths of four objects in both inches and centimeters. What is the constant of proportionality (centimeters divided by inches)? What does the constant of proportionality tell you in this situation?
Object floor tile book table pencil
Length (in.) 24 13 60 7.5
Length (cm) 60.96 33.02 152.4 19.05

Answer

Set up a table to make the comparisons.

  Floor tile book table pencil
Length (inches) 24 13 60 7.5
Length (cm) 60.96 33.02 152.4 19.05
Ratio c m i n 60.96 24 33.02 13 152.4 60 19.05 7.5
Constant

Divide to find the constant.

2.54 2.54 2.54 2.54

The constant of proportionality is 2.54. It tells you that 2.54cm is approximately 1 inch.

The constant of proportionality (centimeters divided by inches) is 2.54. This tells you that there are 2.54 centimeters in one inch.

Your Turn 5.34 §5.4 source ↗

One week, Zac ran a total of 122 miles. How much time did he spend running in that week?

Answer

Zac runs at a constant speed of 4 miles per hour.

Set up the two ratios as proportions to answer this question.

Let x = the time spent running.

It helps many students to create a table to help set up their ratios.

  Exchange What I have or want
miles 4 122
hours 1 x

Set up your proportion.

4 1 = 122 x
4 x = ( 1 ) ( 122 ) Cross multiply
4 x 4 = 122 4 Divide.
x = 30.5

Zac ran 30.5 hours.

Alternate answer: Zac ran for 30 hours and 30 minutes.

30.5 hours (or 30½ hours, or 30 hours and 30 minutes)

Your Turn 5.35 §5.4 source ↗

Suppose one day Joe filled 83 buckets; how much money would he make on that day?

Answer

Joe is paid $2.50 for each bucket.

Joe filled 83 buckets.

Set up the two ratios as proportions to answer this question.

Let x = the amount of money earned.

It helps many students to create a table to help set up their ratios.

  Conversion What I have or want
buckets 1 83
dollars $2.50 x

Set up your proportion.

1 2.50 = 83 x
x = ( 2.50 ) ( 83 ) Cross multiply.
x = 207.50

Joe earned $207.50.

$207.50

Your Turn 5.36 §5.4 source ↗

Later in her trip, Mabel decides to drive to the capital of Canada, Ottawa. As she left Montreal, she saw a road sign that read that Ottawa is 203 kilometers away. About how many miles is that? Round your answer to the nearest tenth.

Answer

0.62 miles is approximately 1 kilometer.

Montreal is 203 kilometers away.

Let x = the distance to Montreal in miles.

It helps many students to create a table to help set up their ratios.

  Conversion What I have or want
kilometers 1 203
miles 0.62 x

Set up your proportion.

1 0.62 = 203 x
x = ( 0.62 ) ( 203 ) Cross multiply.
x ≈ 125.9 m i l e s

The distance to Montreal is approximately 125.9 miles.

125.9 miles

Your Turn 5.37 §5.4 source ↗

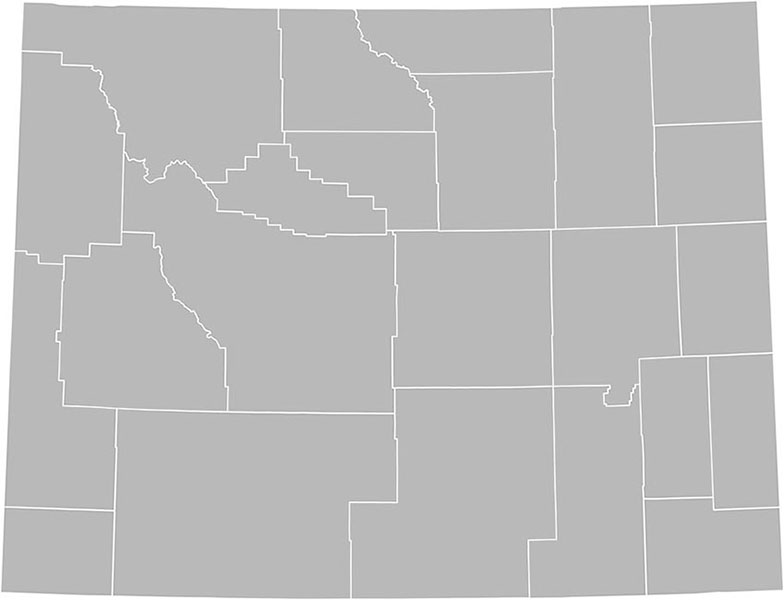
An outline map of Wyoming's counties.An outline map of Wyoming's counties. Outline Map of Wyoming (credit: "Blank map of Wyoming showing counties" by David Benbennick/Wikimedia Commons, Public Domain) Consider the outline map of the state of Wyoming and its counties. If the distance of the southern border is 365 miles, determine the scale (i.e., 1  inch = how many miles). Then use that scale to determine the approximate lengths of the other borders of the state of Wyoming.

Answer

The scale will vary for each student, depending on the screen they are using to view the map. These calculations will assume the borders of your map are as follows:

The map’s southern border is 4 inches.

The map’s northern border is also 4 inches.

The map’s eastern and western borders are both 3 inches.

The real southern border is 365 miles.

Let x = the scale factor (how many real miles are equal one inch on the map).

It helps many students to create a table to help set up their ratios.

  Conversion What I have or want
map inches 4 1
miles 365 x

Set up your proportion.

4 365 = 1 x
4 x = ( 365 ) ( 1 ) Cross multiply.
4 x 4 = 365 4 Divide.
x = 91.25   m i l e s

The scale factor is one map inch equals 91.25 real miles.

Now use the scale to find the length of the eastern and western borders.

Let b = the length of the western border.

  Scale Western Border
map inches 1 3
miles 91.25 b
1 91.25 = 3 b
b = ( 91.25 ) ( 3 ) Cross multiply.
b = 273.75 m i l e s

The western and southern borders are 273.75 miles long. The northern and southern borders are 365 miles long. The scale is one inch = 91.25 miles.

The scale is 1  inch = 91.25  miles . The other borders would calculate as: eastern and western borders are 273.75 miles, and northern border is 365 miles.

Your Turn 5.38 §5.4 source ↗

A toy Jeep is built on a 1 : 16 scale. The website for the toy Jeep says the toy is 11.5 inches long. Based on this, how long is the real Jeep?

Answer

Let x = the length of the real Jeep.

  Scale What I know or want to know
toy Jeep 1 11.5 inches
real Jeep 16 x
1 16 = 11.5 x
x = ( 16 ) ( 11.5 ) Cross multiply.

x = 184   i n c h e s = 15   f e e t   4   i n c h e s

The real Jeep is 184 inches long. You can also express your answer as 15 feet 4 inches or as 15’ 4”.

184 inches, or 15 feet, 4 inches.

Check Your Understanding 5.4.32 §5.4 source ↗

If a : b = c : d , then b : a = d : c for all non-zero whole numbers a , b , c , and d .
  1. a.
    True
  2. b.
    False

Answer

A. True
a This is true, because the second proportions are the reciprocals of the first set of ratios. The qualification that all the numbers are nonzero prevents the problem of dividing by zero. True

Check Your Understanding 5.4.33 §5.4 source ↗

If the ratio of wolves to rabbits in a national park is 3 : 5 , then the ratio of rabbits to (wolves and rabbits) is 5 : 8 .
  1. a.
    True
  2. b.
    False

Answer

A. True
a

w o l v e s r a b b i t s = 3 5

r a b b i t s w o l v e s + r a b b i t s = 5 3 + 5 = 5 8

True

Check Your Understanding 5.4.34 §5.4 source ↗

All fractions are ratios but not all ratios are fractions.
  1. a.
    True
  2. b.
    False

Answer

A. True
a Ratios make part to part, part to whole, and whole to part comparisons. Fractions make part to whole comparisons only. True

Check Your Understanding 5.4.35 §5.4 source ↗

In the following equation, x 46  = 20 90 + 4 , cross multiplication can be used as the first step towards solving for x .
  1. a.
    True
  2. b.
    False

Answer

B. False
b Cross multiplication cannot be used as the first step in this equation. You can only have a single rational expression on each side when you cross multiply. You would need to add the expressions on the right side so you had a single rational expression on the right. False

Check Your Understanding 5.4.36 §5.4 source ↗

All fractions are ratios but not all ratios are fractions.
  1. a.
    True
  2. b.
    False

Answer

A. True
a Ratios make part to part, part to whole, and whole to part comparisons. Fractions make part to whole comparisons only. True

Check Your Understanding 5.4.37 §5.4 source ↗

There are 16 math majors and 12 non-math majors in Ms. Kraft’s class. What is not a correct way to express the ratio of math majors to non-math majors?

16 : 12 12 : 16 4 : 3

Answer

Since the words “math majors” come before the words “non-math majors,” the number of math majors needs to come before the number of non-math majors. The ratio 12:16 has the numbers reversed, with the non-math majors first. 12 : 16

Check Your Understanding 5.4.38 §5.4 source ↗

There are 16 math majors and 12 non-math majors in Ms. Kraft’s class. What shows the ratio of math majors to all the students in Ms. Kraft’s class?

16 : 12 12 : 16 16 : 28 28 : 12 None of these

Answer

There are 16 math majors and 12 non-math majors.

There are 12 + 16 = 28 total students.

The ratio of math majors to all students is 16 to 28 or 16:28.

16 : 28

Check Your Understanding 5.4.39 §5.4 source ↗

One U.S. dollar is worth 0.72 British pounds. Damon is traveling to Great Britain and wishes to exchange $450 U.S. dollars for British pounds. How many British pounds should Damon get in return?

625 6,250 3,456 345.6 None of these

Answer

Set up the two ratios as proportions.

Let x = the number of British pounds.

It helps many students to create a table to help set up their ratios.

  Exchange What I know or want to know
U.S. Dollars 1 $450
British pounds 0.72 x

Set up your proportion.

1 0.72 = 450 x
x = ( 0.72 ) ( 450 ) Cross multiply.
x = 324

Damon will get 324 British pounds in return, which is “None of these” in terms of the available answer options.

324.00 British pounds (None of these.)

Check Your Understanding 5.4.40 §5.4 source ↗

The HO scale for model trains is the most common size of model trains. This scale is 1 : 87 . If a real locomotive is 73 feet long, how long should the model locomotive be (in inches)? Round your answer to the nearest inch.

Answer

10 inches

Set up the two ratios as proportions.

Let x = the length of the model locomotive, in inches

It helps many students to create a table to help set up their ratios.

  Scale What I know or want to know
Model train 1 x
Real train 87 73 feet = 876 inches

Set up your proportion.

1 87 = x 876
87 x = ( 1 ) ( 876 ) Cross multiply.
87 x 87 = 876 87 Divide.
x ≈ 10   i n c h e s

The model locomotive is approximately 10 inches long.

Check Your Understanding 5.4.41 §5.4 source ↗

Albert’s Honda Civic gets 37 miles per gallon of gasoline. The gas tank on the Civic can hold 13.5 gallons of gas. Albert is driving from Tucson, Arizona to Los Angeles, California, a distance of 485 miles. Albert thinks he can make it on one full tank of gasoline. Can he? Explain.

Answer

Set up the two ratios as proportions.

Let x = the distance Albert can go on one tank of gas.

It helps many students to create a table to help set up their ratios.

  Milage of Car On one tank of gas
Miles 37 x
Gallon 1 13.5

Set up your proportion.

37 1 = x 13.5
x = ( 37 ) ( 13.5 ) Cross multiply.
x = 499.5 m i l e s
Yes he can, but barely. At 37 miles per gallon, Albert can drive 499.5 miles. While in theory he can make it, he probably should fill up with gasoline somewhere along the way!

Check Your Understanding 5.4.42 §5.4 source ↗

The average price of a gallon of regular gasoline in the California on July 1, 2021 was $ 4.28 per gallon. Albert stops at a gas station in California and puts 9.5 gallons of gasoline into his Civic. How much did he pay for the gas?

Answer

Set up the two ratios as proportions.

Let x = the amount paid for the gas.

It helps many students to create a table to help set up their ratios.

  Cost of one gallon The large transaction
Price $4.28 x
Gallons 1 9.5

Set up your proportion.

4.28 1 = x 9.5
x = ( 4.28 ) ( 9.5 ) Cross multiply.
x = $ 40.66

Albert paid $40.66 for the 9.5 gallons of gas.

$ 40.66

Your Turn 5.39 §5.5 source ↗

Plot the following points in the rectangular coordinate system and identify the quadrant in which the point is located:

a. ( − 4 , 2 )

b. ( – 1 , – 2 )

c. ( 3 , – 5 )

d. ( – 3 , 0 )

e. ( 5 3 , 2 )

Answer

( – 4 , 2 ) : For the graph, move 4 units left and 2 units up to plot the point. The point is in quadrant II.

( – 1 , – 2 ) : For the graph, move 1 unit left and 2 units down to plot the point. The point is in quadrant III.

( 3 , – 5 ) : For the graph, move 3 units right and 5 units down to plot the point. The point is in quadrant IV.

( – 3 , 0 ) : For the graph, move 3 units left and plot the point on the negative x-axis.

( 5 3 , 2 ) : For the graph, move 5 3 units right and 2 units up to plot the point. The point is in quadrant I.
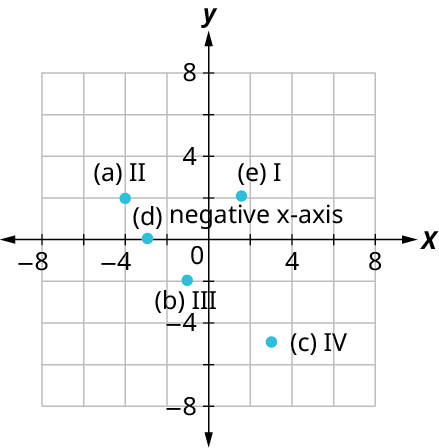
Five points are marked on an x y coordinate plane. The x and y axes range from negative 8 to 8, in increments of 2. The first, second, third, and fourth quadrants are labeled. The points are plotted at the following coordinates: a (negative 4, 2), b (negative 1, negative 2), c (3, negative 5), d (negative 3, 0), and e (negative 1.5, 2). Note: all values are approximate.

Your Turn 5.40 §5.5 source ↗

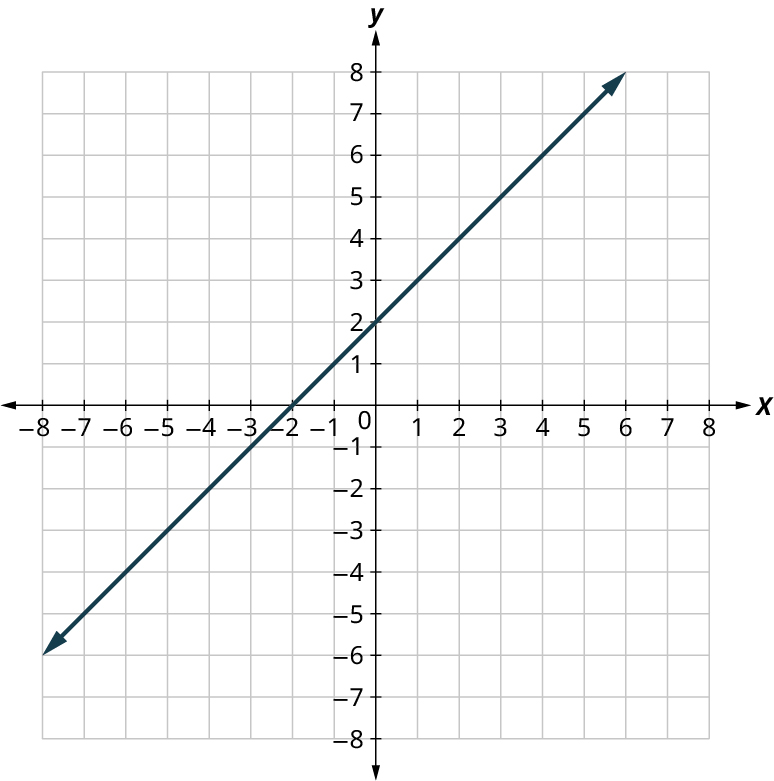
The given figure is the graph of y = x + 2 .
A line is plotted on an x y coordinate plane. The x and y axes range from negative 8 to 8, in increments of 1. The line passes through the following points, (negative 7, negative 5), (negative 2, 0), (0, 2), and (5, 7). Graph of y = x + 2 For each ordered pair below, decide:

I. Is the ordered pair a solution to the equation?

II. Is the point on the line?

( 0 , 2 )

Answer

y = x + 2

( 0 , 2 )

Is the ordered pair a solution to the equation?

Substitute the pair into the equation.

2 = 0 + 2

This is true, so the ordered pair is a solution.

Is the point on the line?

Yes. If the ordered pair is a solution to the equation, then the ordered pair is a point on the line.


I. Yes

II. Yes

Your Turn 5.40 (b) §5.5 source ↗

The given figure is the graph of y = x + 2 .
A line is plotted on an x y coordinate plane. The x and y axes range from negative 8 to 8, in increments of 1. The line passes through the following points, (negative 7, negative 5), (negative 2, 0), (0, 2), and (5, 7). Graph of y = x + 2 For each ordered pair below, decide:

I. Is the ordered pair a solution to the equation?

II. Is the point on the line?

( 1 , 2 )

Answer

( 1 , 2 )

Is the ordered pair a solution to the equation? Substitute the pair into the equation.

2 = 1 + 2

This is not true, so the ordered pair is not a solution.

Is the point on the line?

No. If the ordered pair is not a solution to the equation, then the ordered pair is not a point on the line.


I. No

II. No

Your Turn 5.40 (c) §5.5 source ↗

The given figure is the graph of y = x + 2 .
A line is plotted on an x y coordinate plane. The x and y axes range from negative 8 to 8, in increments of 1. The line passes through the following points, (negative 7, negative 5), (negative 2, 0), (0, 2), and (5, 7). Graph of y = x + 2 For each ordered pair below, decide:

I. Is the ordered pair a solution to the equation?

II. Is the point on the line?

( − 1 , 1 )

Answer

( – 1 , 1 )

Is the ordered pair a solution to the equation? Substitute the pair into the equation.

1 = – 1 + 2

This is true, so the ordered pair is a solution.

Is the point on the line?

Yes. If the ordered pair is a solution to the equation, then the ordered pair is a point on the line.


I. Yes

II. Yes

Your Turn 5.40 (d) §5.5 source ↗

The given figure is the graph of y = x + 2 .
A line is plotted on an x y coordinate plane. The x and y axes range from negative 8 to 8, in increments of 1. The line passes through the following points, (negative 7, negative 5), (negative 2, 0), (0, 2), and (5, 7). Graph of y = x + 2 For each ordered pair below, decide:

I. Is the ordered pair a solution to the equation?

II. Is the point on the line?

( – 3 , – 1 )

Answer

( – 3 , – 1 )

Is the ordered pair a solution to the equation? Substitute the pair into the equation.

– 1 = – 3 + 2

This is true, so the ordered pair is a solution.

Is the point on the line?

Yes. If the ordered pair is a solution to the equation, then the ordered pair is a point on the line.


I. Yes

II. Yes

Your Turn 5.41 §5.5 source ↗

Graph the equation y = 3 x − 1 by plotting points.

Answer

y = 3 x − 1

Find three points that are solutions to the equation. Choose three values for x.

x y
–1  
0  
1  

Substitute into the equation to find the values for y.

x y y = 3 x – 1
–1 –4 3 ( – 1 ) – 1 = – 3 – 1 = – 4
0 –1 3 ( 0 ) – 1 = 0 – 1 = – 1
1 2 3 ( 1 ) – 1 = 3 – 1 = 2

Plot the points. Check that they line up and draw the line.
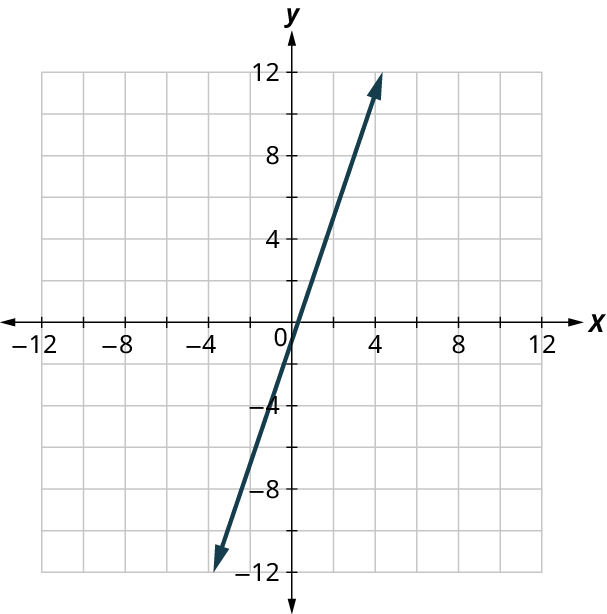
A line is plotted on an x y coordinate plane. The x and y axes range from negative 12 to 12, in increments of 2. The line passes through the following points, (negative 2, negative 7), (0, negative 1), (2, 5), and (4, 11). Note: all values are approximate.

Your Turn 5.42 §5.5 source ↗

If a stamp costs $0.55 and you buy a book of 20 stamps, then you pay $11. If you want to mail 100 letters, you can buy a roll of stamps for $55. Your friend only needs 3 stamps, how much will they pay?

Answer

Break the words into components.

Let x = the number stamps.

Let y = the cost of mailing your bundle of letters.

Cost of mailing is cost of one stamp times number of letters
y = $0.55 ∙ x
y = 0.55 x
y = 0.55 ( 3 ) Substitute 3 for x.
y = 1.65

Your friend will pay $1.65 for stamps.
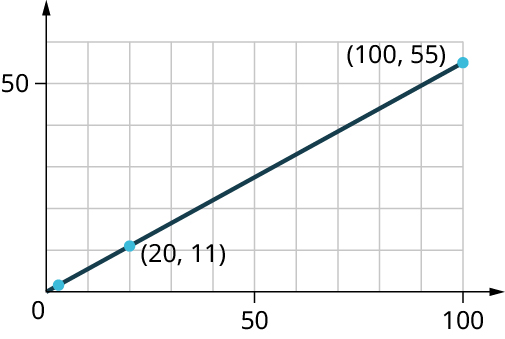
A line is plotted on a coordinate plane. The horizontal axis ranges from 0 to 100, in increments of 10. The vertical axis ranges from 0 to 50, in increments of 10. A stamp of the USA flag is at the top-left. The line passes through the points, (3, 1.65), (20, 11), and (100, 55).

Your friend will pay $1.65.

Your Turn 5.43 §5.5 source ↗

Determine whether each ordered pair is a solution to the inequality y > x − 1 :

( 0 , 1 )

Answer

y > x − 1

( 0 , 1 )

Is the ordered pair a solution to the inequality?

Substitute the pair into the inequality.

1 > 0 − 1

1 > − 1

This is true, so the ordered pair is a solution.

Yes

Your Turn 5.43 (b) §5.5 source ↗

Determine whether each ordered pair is a solution to the inequality y > x − 1 :

( − 4 , − 1 )

Answer

y > x − 1

( − 4 , − 1 )

Is the ordered pair a solution to the inequality?

Substitute the pair into the inequality.

− 1 > − 4 − 1

− 1 > − 5

This is true, so the ordered pair is a solution.

Yes

Your Turn 5.43 (c) §5.5 source ↗

Determine whether each ordered pair is a solution to the inequality y > x − 1 :

( 4 , 2 )

Answer

y > x − 1

( 4 , 2 )

Is the ordered pair a solution to the inequality?

Substitute the pair into the inequality.

2 > 4 − 1

2 > 3

This is not true, so the ordered pair is not a solution.

No

Your Turn 5.43 (d) §5.5 source ↗

Determine whether each ordered pair is a solution to the inequality y > x − 1 :

( 3 , 0 )

Answer

y > x − 1

( 3 , 0 )

Is the ordered pair a solution to the inequality?

Substitute the pair into the inequality.

0 > 3 − 1

0 > 2

This is not true, so the ordered pair is not a solution.

No

Your Turn 5.43 (e) §5.5 source ↗

Determine whether each ordered pair is a solution to the inequality y > x − 1 :

( − 2 , − 3 )

Answer

y > x − 1

( − 2 , − 3 )

Is the ordered pair a solution to the inequality?

Substitute the pair into the inequality.

− 3 > − 2 − 1

− 3 > − 3

This is not true, so the ordered pair is not a solution.

No

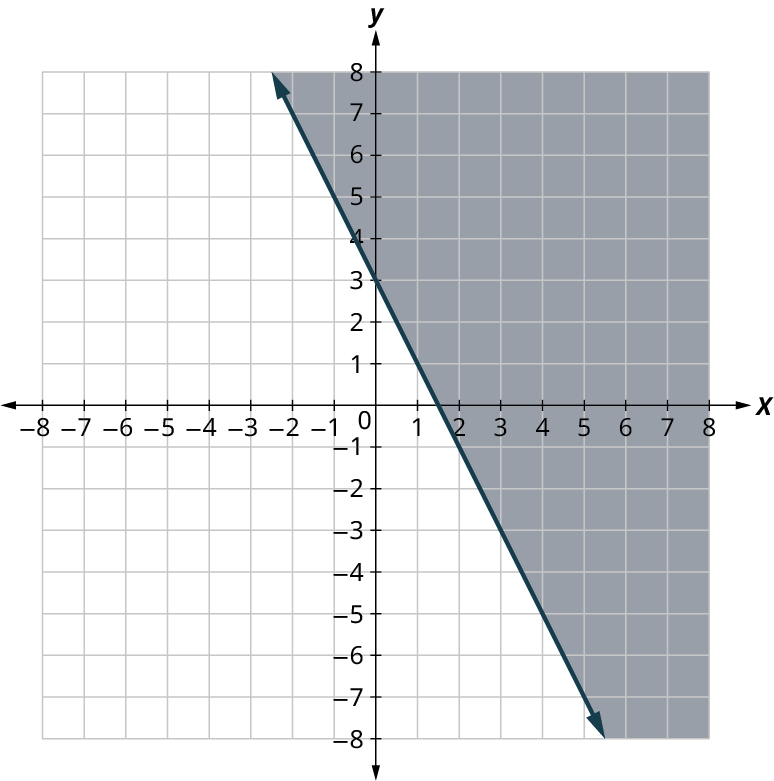
Your Turn 5.44 §5.5 source ↗

Write the inequality shown by the graph with the boundary line y = − 2 x + 3 .
A line is plotted on an x y coordinate plane. The x and y axes range from negative 8 to 8, in increments of 1. The line passes through the following points, (negative 2, 7), (0, 3), (1.5, 0), and (5, negative 7). The region to the right of the line is shaded. Note: all values are approximate.

Answer

The boundary line for this graph is given: y = − 2 x + 3 .

Test a point not on the line to see if y ≥ − 2 x + 3 is the answer:

( 0 , 0 )

0 ≥ − 2 ( 0 ) + 3

0 ≥ 3 is not true, so ( 0 , 0 ) is not a solution. That is good, since the proposed solution is the points above the given line.

Test ( 5 , 1 ) .

1 ≥ − 2 ( 5 ) + 3

1 ≥ − 10 + 3

1 ≥ − 7 is true, so shading above the line is correct.

y ≥ − 2 x + 3 is the answer.

y ≥ − 2 x + 3

Your Turn 5.45 §5.5 source ↗

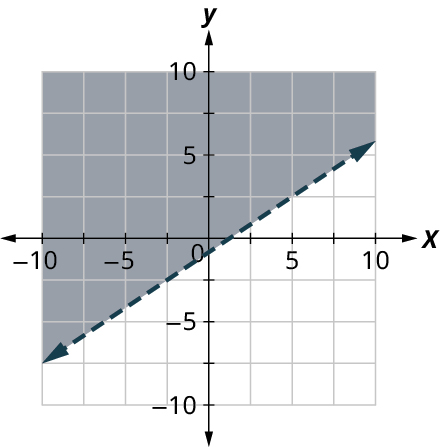
Graph the linear inequality: y > 2 x 3 − 1 .

Answer

A dashed line is plotted on an x y coordinate plane. The x and y axes range from negative 10 to 10, in increments of 2.5. The line passes through the following points, (negative 10, negative 7.5), (0, negative 1), (5, 2.5), and (7.5, 3.75). The region above the line is shaded. Note: all values are approximate.

Graph the line y = 2 3 x − 1 with a dotted line since the inequality is strictly greater than.

Shade above the line since this is “y >”.

Test ( 0 , 0 ) to be sure shading above the line is correct.

0 > 2 3 ( 0 ) − 1

0 > − 1 is true, so ( 0 , 0 ) is in the solution. The shading should include ( 0 , 0 ) . The shading is correct.

Your Turn 5.46 §5.5 source ↗

Harrison works two part time jobs. One at a gas station that pays $11 an hour and the other is as an IT consultant for $16.50 an hour. Between the two jobs, Harrison wants to earn at least $330 a week. How many hours does Harrison need to work at each job to earn at least $330?

Let x be the number of hours he works at the gas station and let y be the number of hours he works as an IT consultant. Write an inequality that would model this situation.

Answer

11 x + 16.5 y ≥ 330

Break the words into components.

Let x = the number of hours worked at the gas station.

$11 = the amount paid per hour at the gas station.

Let y = the number of hours worked as an IT consultant.

$16.50 = the amount paid per hour as an IT consultant.

$330 = the least amount needed to earn per week.

Gas station pay plus IT pay is at least 330
11x + 16.50y ≥ 330

Write an inequality to model the situation:

11 x + 16.50 y ≥ 330

Your Turn 5.46 (b) §5.5 source ↗

Harrison works two part time jobs. One at a gas station that pays $11 an hour and the other is as an IT consultant for $16.50 an hour. Between the two jobs, Harrison wants to earn at least $330 a week. How many hours does Harrison need to work at each job to earn at least $330?

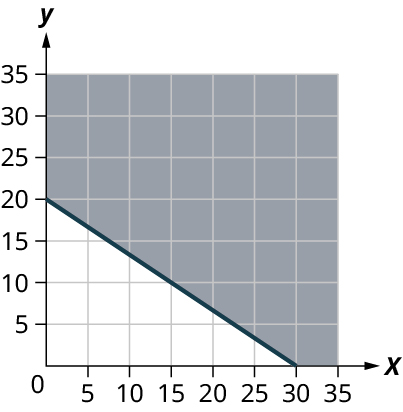
Graph the inequality.

Answer

A line is plotted on an x y coordinate plane. The x-axis ranges from 0 to 35, in increments of 5. The y-axis ranges from 0 to 35, in increments of 5. The line passes through the following points, (0, 20), (15, 10), and (30, 0). The region above the line is shaded.A line is plotted on an x y coordinate plane. The x-axis ranges from 0 to 35, in increments of 5. The y-axis ranges from 0 to 35, in increments of 5. The line passes through the following points, (0, 20), (15, 10), and (30, 0). The region above the line is shaded.

Graph the inequality: 11 x + 16.50 y ≥ 330 .

Graph the line 11 x + 16.50 y = 330 with a solid line since it is an “or equal to” type.

Test ( 0 , 0 ) in 11 x + 16.50 y ≥ 330 .

11 ( 0 ) + 16.50 ( 0 ) ≥ 330

0 ≥ 330 is false, so shade the other side of the boundary.

The shading should not include ( 0 , 0 ) .

Your Turn 5.46 (c) §5.5 source ↗

Harrison works two part time jobs. One at a gas station that pays $11 an hour and the other is as an IT consultant for $16.50 an hour. Between the two jobs, Harrison wants to earn at least $330 a week. How many hours does Harrison need to work at each job to earn at least $330?

Find three ordered pairs ( x , y ) that would be solutions to the inequality. Then, explain what that means for Harrison.

Answer

Answers will vary.

Test ( 0 , 0 ) in 11 x + 16.50 y ≥ 330 .

11 ( 0 ) + 16.50 ( 0 ) ≥ 330

0 ≥ 330 is false. It is not part of the solution.

Not working at all would not be good for Harrison. He would earn no money.

Test ( 15 , 5 ) .

11 ( 15 ) + 16.50 ( 5 ) ≥ 330

247.5 ≥ 330

This is not part of the solution.

If Harrison works at the gas station for 15 hours and at the IT job for 5 hours, that will not earn enough money.

Test ( 30 , 10 ) .

11 ( 30 ) + 16.50 ( 10 ) ≥ 330

495 ≥ 330

This point is part of the solution.

If Harrison works at the gas station for 30 hours and 10 hours at the IT job, that will earn $496. That is more than enough money to exceed the $330 requirement. This is still working just 40 hours a week and is very doable.

Check Your Understanding 5.5.43 §5.5 source ↗

Choose the correct solution to the equation 6 y + 10 = 12 y .
  1. a.
    y = 5
  2. b.
    y = − 1
  3. c.
    y = 1 2
  4. d.
    y = 5 3

Answer

D. y = 5 3
d

Test all the options by substitution until you find the option that works.

6 y + 10 = 12 y

6 ( 5 3 ) + 10 = 12 ( 5 3 )

10 + 10 = 20

Since this is true, 5 3 is a solution.

y = 5 3

Check Your Understanding 5.5.44 §5.5 source ↗
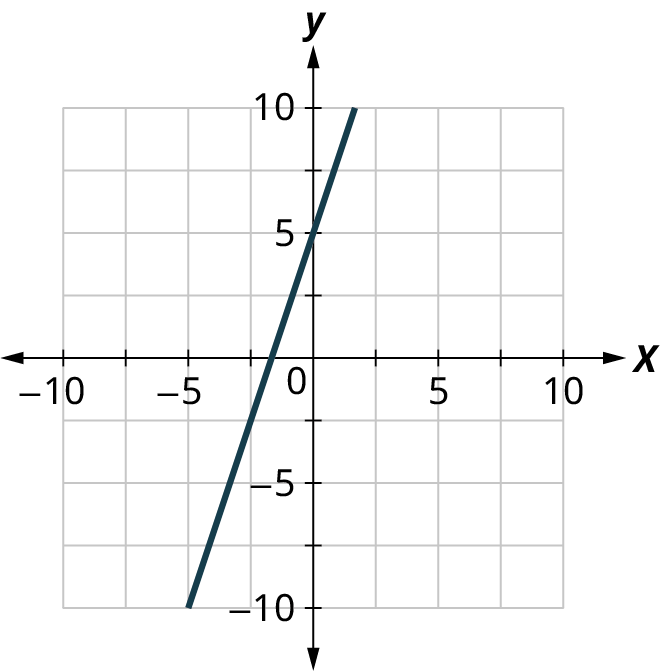
Choose the correct graph for y = 3 x + 5 .
A line is plotted on a coordinate plane. The horizontal and vertical axes range from negative 10 to 10, in increments of 5. The line passes through the points, (negative 5, negative 10) and (0, 5).
A line is plotted on a coordinate plane. The horizontal and vertical axes range from negative 10 to 10, in increments of 5. The line passes through the points, (0, negative 5) and (5, 10).
A line is plotted on a coordinate plane. The horizontal and vertical axes range from negative 10 to 10, in increments of 5. The line passes through the points, (0, negative 3.5) and (2, 5). Note: all values are approximate.
A line is plotted on a coordinate plane. The horizontal and vertical axes range from negative 10 to 10, in increments of 5. The line passes through the points, (negative 2, negative 5) and (0, 2.5). Note: all values are approximate.

Answer

Graph the equation and then compare it to the options offered.

y = 3 x + 5

Find three points that are solutions to the equation. Choose three values for x.

x y
–1  
0  
1  

Substitute into the equation to find the values for y.

x y y = 3 x + 5
–1 2 3 ( − 1 ) + 5 = − 3 + 5 = 2
0 5 3 ( 0 ) + 5 = 5
1 8 3 ( 1 ) + 5 = 8

Plot the points. Check that they line up and draw the line.

The first graph is the correct graph. It is the only one that passes through ( 0 , 5 ) .

A line is plotted on an x y coordinate plane. The x and y axes range from negative 10 to 10 in increments of 2.5. The line passes through the points, (negative 2.5, negative 2.5) and (0, 5).

Check Your Understanding 5.5.45 §5.5 source ↗
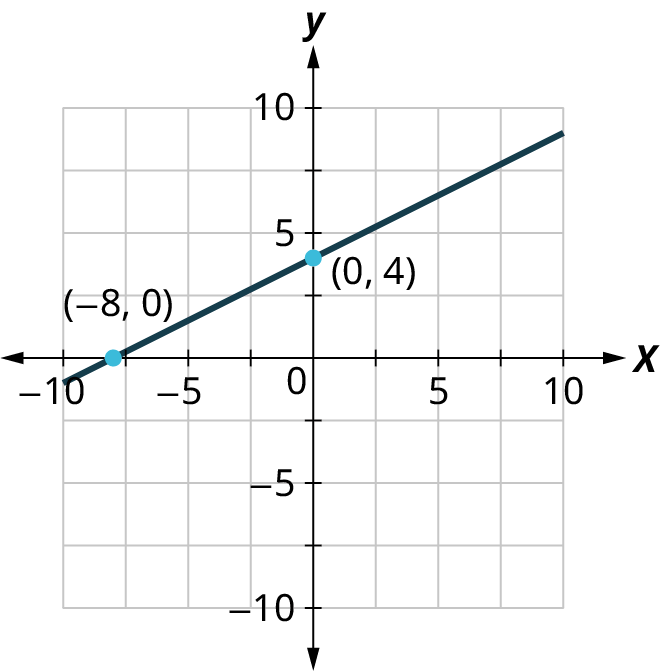
Choose the correct equation for the graph shown:
A line is plotted on a coordinate plane. The horizontal and vertical axes range from negative 10 to 10, in increments of 5. The line passes through the points, (negative 8, 0) and (0, 4).
  1. a.
    y = 2 x + 4
  2. b.
    y = 1 2 x + 4
  3. c.
    y = − 2 x + 4

Answer

B. y = 1 2 x + 4
b

Test the points for all the options. Only the correct option works.

Correct option: y = 1 2 x + 4 .

( 0 , 4 )

4 = 1 2 ( 0 ) + 4

4 = 4 is true, so this ordered pair is on the line.

( − 8 , 0 )

0 = 1 2 ( − 8 ) + 4

0 = − 4 + 4

0 = 0 is true, so this ordered pair is on the line.

Two points are all it takes to determine a line, so this is the correct equation for the line.

y = 1 2 x + 4

Check Your Understanding 5.5.46 §5.5 source ↗
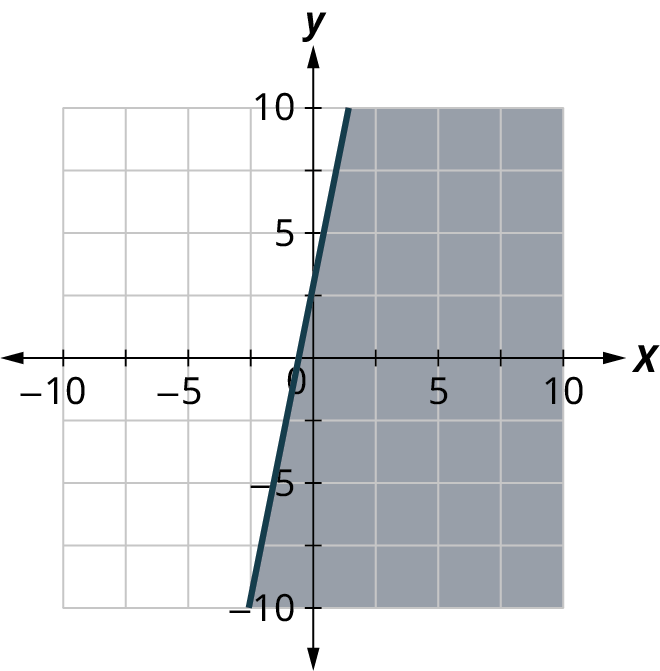
Choose the correct graph for y > 3 x + 5 .
A line is plotted on a coordinate plane. The horizontal and vertical axes range from negative 10 to 10, in increments of 5. The line passes through the points, (negative 2, negative 5) and (0, 2.5). The region to the right of the line is shaded. Note: all values are approximate.
A dashed line is plotted on a coordinate plane. The horizontal and vertical axes range from negative 10 to 10, in increments of 5. The line passes through the points, (negative 2, negative 5) and (0, 2.5). The region to the right of the line is shaded. Note: all values are approximate.

A line is plotted on a coordinate plane. The horizontal and vertical axes range from negative 10 to 10, in increments of 5. The line passes through the points, (negative 2, negative 5) and (0, 2.5). The region to the left of the line is shaded. Note: all values are approximate.

Answer

Graph the inequality, and then compare it to the options.

y > 3 x + 5

Graph the line y = 3 x + 5 with a dotted line, since this is a strictly greater than inequality.

Shade above the line since this is a “y >”.

Test ( 0 , 0 ) to be sure you shaded correctly.

0 > 3 ( 0 ) + 5

0 > 5 is false, so this ordered pair is not on the line. ( 0 , 0 ) should not be in the shaded area. You shaded correctly.

Two points are all it takes to determine a line, so this is the correct equation for the line.

The correct graph is the third graph.

A dashed line is plotted on an x y coordinate plane. The x and y axes range from negative 10 to 10 in increments of 2.5. The line passes through the following points, (negative 2.5, negative 10) and (0, 2.5). The region above the line is shaded. Note: all values are approximate.

Check Your Understanding 5.5.47 §5.5 source ↗
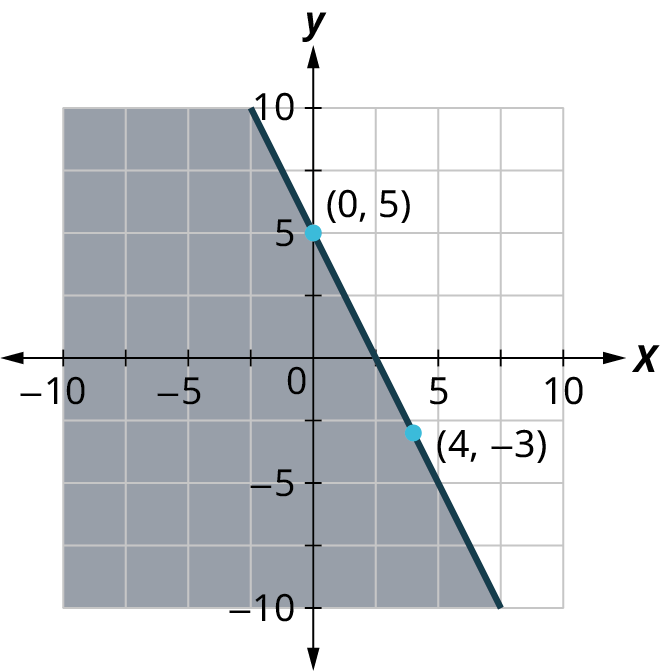
Choose the correct inequality for the graph shown.
A line is plotted on a coordinate plane. The horizontal and vertical axes range from negative 10 to 10, in increments of 5. The line passes through the points, (0, 5) and (4, negative 3). The region to the left of the line is shaded.
  1. a.
    y = − 2 x + 5
  2. b.
    y ≤ − 2 x + 5
  3. c.
    y ≥ − 2 x + 5
  4. d.
    y < − 2 x + 5

Answer

B. y ≤ − 2 x + 5
b

Test the points on the line and test points in the shaded are for all the options. Only the correct option works.

Correct option: y ≤ − 2 x + 5 .

( 0 , 5 )

5 ≤ − 2 ( 0 ) + 5

5 ≤ 5 is true, so this ordered pair is a solution to the inequality and a point on the boundary.

( 4 , − 3 )

− 3 ≤ − 2 ( 4 ) + 5

− 3 ≤ − 8 + 5

− 3 ≤ − 3 is true, so this ordered pair is a solution to the inequality and a point on the boundary.

( 0 , 0 ) to test shaded area.

0 ≤ − 2 ( 0 ) + 5

0 ≤ 5 is true, so shade the side of the boundary where ( 0 , 0 ) is.

y ≤ − 2 x + 5

Your Turn 5.47 §5.6 source ↗

Multiply ( x + 3 ) ( x + 1 ) .

Answer

You can use a table to help you practice distribution until you get comfortable with multiplying polynomials. Distribution works no matter how many terms you have. You can always make a table like this if you have problems keeping track of the terms.

x + 3
x x 2 3x
+ 1 x 3

After multiplying, write the products from the cells as a sum.

x 2 + 3 x + x + 3

Combine like terms.

x 2 + 4 x + 3

x 2 + 4 x + 3

Your Turn 5.48 §5.6 source ↗

Multiply ( x − 3 ) ( 2 x + 1 ) .

Answer

2 x 2 − 5 x − 3

You can use a table to help you practice distribution until you get comfortable with multiplying polynomials. Distribution works no matter how many terms you have. You can always make a table like this if you have problems keeping track of the terms.

x – 3
2x 2 x 2 –6x
+ 1 x –3

After multiplying, write the products from the cells as a sum.

2 x 2 − 6 x + x − 3

Combine like terms.

2 x 2 − 5 x − 3

Your Turn 5.49 §5.6 source ↗

Factor x 2 + 6 x + 8 .

Answer

( x + 2 ) ( x + 4 )

x 2 + 6 x + 8

Look for factors of 8 that add up to 6. This works when the coefficient of the x 2 term is 1.

Factors of 8 Sum of Factors = 6 Success?
1 times 8 1 + 8 = 9 No
2 times 4 2 + 4 = 6 Yes!

Because 2 and 4 are factors of 8 and they add up to 6, you can make the factors of the polynomial.

( x + 2 ) ( x + 4 )

Your Turn 5.50 §5.6 source ↗

Factor: x 2 − 16 x + 63 .

Answer

x 2 − 16 x + 63

Look for factors of 63 that add up to − 16 . This works when the coefficient of the x 2 term is 1.

Factors of 63 Sum of Factors = –16 Success?
1 times 63 1 + 63 = 64 No
3 times 21 3 + 21 = 24 No
7 times 9 7 + 9 = 16 No, but it’s the opposite of the sum you want. Try negatives of your factors.
–7 times –9 − 7 + ( − 9 ) = − 16 Yes

Because –7 and –9 are factors of 63 and they add up to –16, you can make the factors of the polynomial.

( x − 7 ) ( x − 9 )

( x − 7 ) ( x − 9 )

Your Turn 5.51 §5.6 source ↗

Graph y = − x 2 .

Answer

y = − x 2

For now, solve by plotting several points.

x y y = − x 2
–3 –9 y = − ( − 3 ) 2
–2 –4 y = − ( − 2 ) 2
–1 –1 y = − ( − 1 ) 2
0 0 y = − ( 0 ) 2
1 –1 y = − ( 1 ) 2
2 –4 y = − ( 2 ) 2
3 –9 y = − ( 3 ) 2

Connect the points with a smooth curve.
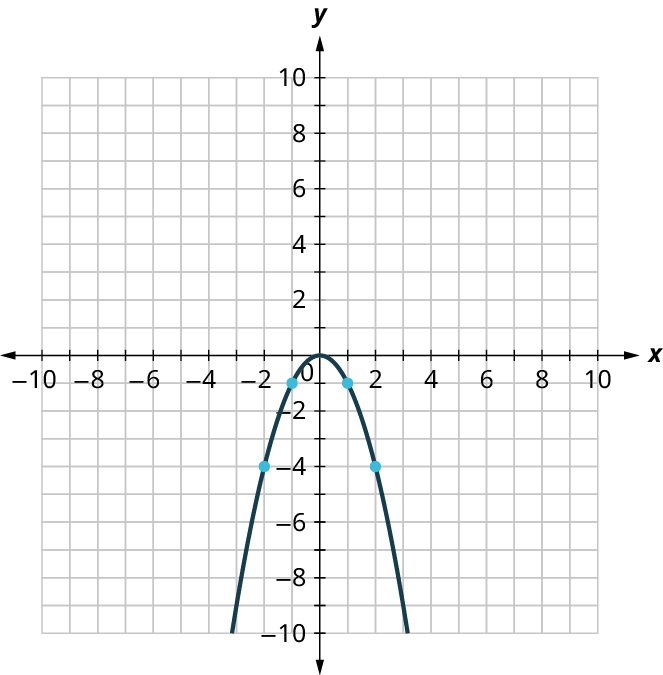
A parabola is plotted on an x y coordinate plane. The x and y axes range from negative 10 to 10, in increments of 1. The parabola opens down and it passes through the following points, (negative 2, negative 4), (negative 1, negative 1), (0, 0), (1, negative 1), and (2, negative 4). Note: all values are approximate.

Your Turn 5.52 §5.6 source ↗

Find the solutions of y = x 2 + x − 6 from its graph. A parabola is plotted on an x y coordinate plane. The x and y axes range from negative 10 to 10, in increments of 1. The parabola opens up and it passes through the following points, (negative 3, 0), (negative 0.5, negative 6.2), and (2, 0). Note: all values are approximate.

Answer

y = 0 where x = − 3 or x = 2 x = − 3 , x = 2

Your Turn 5.53 §5.6 source ↗

Solve ( x − 2 ) ( x + 5 ) = 0 .

Answer

( x − 2 ) ( x + 5 ) = 0

x − 2 = 0 x + 5 = 0 Set factors equal to zero.
x = 2 x = − 5 Solve each new equation.

Checking is left to you.

x = 2 or x = − 5

Your Turn 5.54 §5.6 source ↗

Solve x 2 + 2 x − 15 = 0 .

Answer

x 2 + 2 x − 15 = 0
( x − 3 ) ( x + 5 ) = 0 Factor the polynomial.
x − 3 = 0 x + 5 = 0 Set factors equal to zero.
x = 3 x = − 5 Solve each new equation.

Checking is left to you.

x = 3 or x = − 5

Your Turn 5.55 §5.6 source ↗

Solve using the Square Root Property: x 2 = 25 .

Answer

x 2 = 25
x = ± 25 Use the Square Root Property.
x = ± 5 Simplify.
x = 5 x = − 5 Rewrite the two solutions.

Checking is left to you.

x = 5 , x = − 5

Your Turn 5.56 §5.6 source ↗

Solve using the Square Root Property: 25 p 2 = 49 .

Answer

25 p 2 = 49
p 2 = 49 25 Divide.
p = ± 49 25 Use the Square Root Property.
p = ± 7 5 Simplify.
p = 7 5 p = − 7 5 Rewrite the two solutions.

Checking is left to you.

p = 7 5 , p = − 7 5

Your Turn 5.57 §5.6 source ↗

Solve using the quadratic formula: a 2 − 2 a − 15 = 0 .

Answer

a 2 − 2 a − 15 = 0 The equation is in standard form.

For the quadratic formula, a = 1 , b = − 2 , and c = − 15 . Do not get confused because there are two a’s in this exercise.

The solutions to the equation can be found with the quadratic formula − b ± b 2 − 4 a c 2 a .

− ( − 2 ) ± ( − 2 ) 2 − 4 ( 1 ) ( − 15 ) 2 ( 1 ) Substitute.
2 ± 4 + 60 2 Simplify.
2 ± 64 2
2 ± 8 2
a = 2 + 8 2 a = 2 − 8 2 Rewrite to show two solutions.
a = 10 2 a = − 6 2 Simplify.
a = 5 a = − 3

Checking is left for you.

a = 5 , a = − 3

Your Turn 5.58 §5.6 source ↗

Solve using the quadratic formula: 3 y 2 − 5 y + 2 = 0 .

Answer

3 y 2 − 5 y + 2 = 0 The equation is in standard form.

For the quadratic formula, a = 3 , b = − 5 , and c = 2 .

The solutions to the equation can be found with the quadratic formula − b ± b 2 − 4 a c 2 a .

− ( − 5 ) ± ( − 5 ) 2 − 4 ( 3 ) ( 2 ) 2 ( 3 ) Substitute.
5 ± 25 − 24 6 Simplify.
5 ± 1 6
5 ± 1 6
y = 5 + 1 6 y = 5 − 1 6 Rewrite to show two solutions.
y = 6 6 y = 4 6 Simplify.
y = 1 y = 2 3

Checking is left for you.

y = 1 , y = 2 3

Your Turn 5.59 §5.6 source ↗

The product of two consecutive odd integers is 240. Find the integers.

Answer

Let y = o n e i n t e g e r .

Let y + 1 = t h e n e x t i n t e g e r .

Break the sentence into components.

The product of two consecutive integers is 240
y multiplied by y + 1 = 240
y ( y + 1 ) = 240 The equation is not in standard form.
y 2 + y = 240 Distribute on the left.
y 2 + y − 240 = 240 − 240 Subtract to bring it into standard form.
y 2 + y − 240 = 0 The equation is in standard form. Use one of the solution methods.

Hint: Use https://www.wolframalpha.com/ to “factor 240” and look for a pair whose sum is 1 and whose product is 240. There is one pair that works: 16 and –15. You want the signs different to have a negative product. You want the 16 positive to have the middle term positive.

( y + 16 ) ( y − 15 ) = 0
y + 16 = 0 y − 15 = 0 Set factors equal to zero.
y = − 16 y = 15 Solve each new equation.
y + 1 = − 15 y + 1 = 16 Find the second integer for each solution.

There are two pairs of numbers that work: –16 and –15 are one pair; 15 and 16 are the other pair

Checking is left to you.

16, 15 and –16, –15

Your Turn 5.60 §5.6 source ↗

A rectangular sign has an area of 30 square feet. The length of the sign is 1 foot more than the width. Find the length and width of the sign.

Answer

Let w = t h e w i d t h o f t h e s i g n i n f e e t .

Let w + 1 = t h e l e n g t h o f t h e s i g n .

A r e a = l e n g t h t i m e s w i d t h = 30 s q u a r e f e e t .

Break the sentence into components.

Length times width is area
w times w + 1 = 30
w ( w + 1 ) = 30 The equation is not in standard form.
w 2 + w = 30 Distribute on the left.
w 2 + w − 30 = 30 − 30 Subtract to bring it into standard form.
w 2 + w − 30 = 0 The equation is in standard form. Use one of the solution methods.
( w + 6 ) ( w − 5 ) = 0 This solves by factoring.
w + 6 = 0 w − 5 = 0 Set factors equal to zero.
y = − 6 w = 5 Solve each new equation.
w + 1 = − 5 w + 1 = 6 Find the second integer for each solution.

There is only one pair of numbers that work since the length and width cannot be negative: the width is 5 feet, and the length is 6 feet.

This checks because it yields an area of 30 feet.

width = 5  feet , length = 6  feet

Check Your Understanding 5.6.48 §5.6 source ↗

Which quadratic equation equals ( x − 3 ) ( x + 5 ) ?
  1. a.
    x 2 − 15
  2. b.
    x 2 − 3 x + 15
  3. c.
    x 2 − 2 x − 15
  4. d.
    x 2 + 2 x − 15

Answer

D. x 2 + 2 x − 15
d
( x − 3 ) ( x + 5 )
x ( x + 5 ) − 3 ( x + 5 ) Distribute.
x 2 + 5 x − 3 x − 15 Distribute again.
x 2 + 2 x − 15 Combine like terms.

This matches the correct option.

Check Your Understanding 5.6.49 §5.6 source ↗

Which product is equal to x 2 − 8 x + 15 ?
  1. a.
    ( x − 3 ) ( x + 5 )
  2. b.
    ( x − 3 ) ( x − 5 )
  3. c.
    ( x + 3 ) ( x + 5 )
  4. d.
    ( x + 3 ) ( x − 5 )

Answer

B. ( x − 3 ) ( x − 5 )
b

x 2 − 8 x + 15

Look for two factors of 15 that add up to –8.

Factors of 8 Sum of Factors = –8 Success?
1 times 15 1 + 15 = 16 No
3 times 5 3 + 5 = 8 No, but the sum is 8, so change signs.
–3 times –5 − 3 + ( − 5 ) = − 8 Yes!
( x − 3 ) ( x − 5 ) Write the factored form.

This is the correct option.

Check Your Understanding 5.6.50 §5.6 source ↗
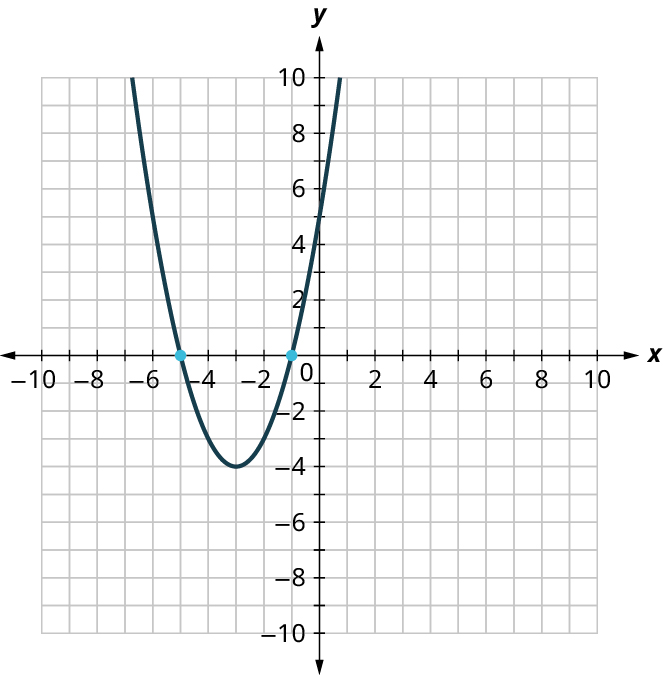
The graph shown is the graph of which quadratic equation? A parabola is plotted on an x y coordinate plane. The x and y axes range from negative 10 to 10, in increments of 1. The parabola opens up and it passes through the following points, (negative 5, 0), (negative 3, negative 4), and (negative 1, 0).
  1. a.
    x 2 − x + 5 = 0
  2. b.
    x 2 − 5 x + 1 = 0
  3. c.
    x 2 + 6 x + 5 = 0
  4. d.
    x 2 − 4 x + 5 = 0

Answer

C. x 2 + 6 x + 5 = 0
c

Since it intersects the x -axis at –5 and –1, you can “reverse” solve.

x = − 5 x = − 1 Write the factors they came from.
x + 5 = 0 x + 1 = 0 Multiply together to get the quadratic equation.
( x + 5 ) ( x + 1 ) = 0 Distribute twice to expand the polynomial.
x 2 + 5 x + x + 5 = 0 Simplify.
x 2 + 6 x + 5 = 0 This is the correct option.

Check Your Understanding 5.6.51 §5.6 source ↗

What is the solution to x 2 − 49 = 0 ?
  1. a.
    x = 7
  2. b.
    x = − 7
  3. c.
    x = ± 49
  4. d.
    x = ± 7

Answer

D. x = ± 7
d
x 2 = 49
x ± 49 Use the Square Root Property.
x = ± 7 Simplify.
x = 7 x = − 7 Rewrite the two solutions.

This is the correct option.

Check Your Understanding 5.6.52 §5.6 source ↗

x 2 − 5 x + 5 = 0 can be factored to ( x − 1 ) ( x − 5 ) .
  1. a.
    True
  2. b.
    False

Answer

B. False
b This is false. When you distribute in the product, you get − x and − 5 x . This adds up to − 6 x , which is not the middle term of the trinomial. False

Check Your Understanding 5.6.53 §5.6 source ↗

x 2 − 5 x + 5 = 0 can be solved using the square root method.
  1. a.
    True
  2. b.
    False

Answer

B. False
b False. You cannot use the square root method when you have a linear term. The 5 x term prevents you from using the square root method unless you do a lot of rearranging this equation. False

Check Your Understanding 5.6.54 §5.6 source ↗

x 2 − 5 x + 5 = 0 can be solved using the quadratic formula.
  1. a.
    True
  2. b.
    False

Answer

A. True
a True. Any quadratic equation can be solved with the quadratic formula. Some will have imaginary solutions, so you are not guaranteed a real number solution. True

Check Your Understanding 5.6.55 §5.6 source ↗
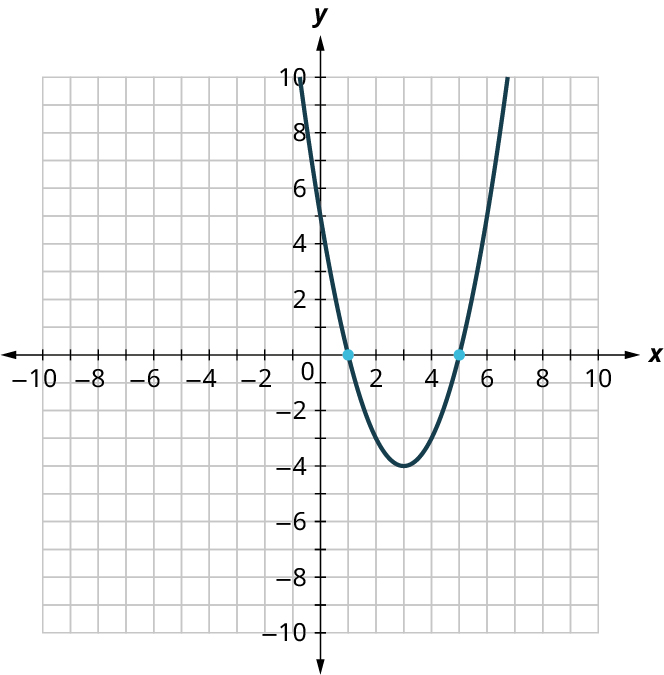
x 2 − 5 x + 5 = 0 can be graphed as:
A parabola is plotted on an x y coordinate plane. The x and y axes range from negative 10 to 10, in increments of 1. The parabola opens up and it passes through the following points, (1, 0), (3, negative 4), and (5, 0).
  1. a.
    True
  2. b.
    False

Answer

B. False
b

False. For example, substitute ( 1 , 0 ) into the equation.

Substitute 1 in for x . You expect the result to be 0, but it is 1.

( 1 ) 2 − 5 ( 1 ) + 5 = 1 − 5 + 5 = 1

False

Check Your Understanding 5.6.56 §5.6 source ↗

Using the square root method, find the solutions to x 2 − 5 x + 5 = 0 .

Answer

x 2 − 5 x + 5 = 0

This is the completing the square method. First, you must make the left side look like an expression squared. It is usually a good method to choose when the linear term has an even coefficient, but it can be done here.

Move the constant to the right side.

x 2 − 5 x = − 5

Let b = the linear term’s coefficient, so b = − 5

Add ( b 2 ) 2 to both sides. ( b 2 ) 2 = ( − 5 2 ) 2 = 25 4

x 2 − 5 x + 25 4 = − 5 + 25 4 Now, you can write the left side as an expression squared.
( x − 5 2 ) 2 = − 20 4 + 25 4 Add the constants on the right.
( x − 5 2 ) 2 = 5 4 You can use the Square Root Property in this form.
x − 5 2 = ± 5 4
x − 5 2 = ± 5 2 Simplify.
x = 5 2 ± 5 2
x = 5 2 + 5 2 x = 5 2 − 5 2 Write the two solutions.

Checking is left for you.

x = 5 2 ± 5 2

Your Turn 5.61 §5.7 source ↗

For the function f ( x ) = 3 x 2 − 2 x + 1 , evaluate the function.

f ( 3 )

Answer

f ( x ) = 3 x 2 − 2 x + 1
f ( 3 ) = 3 ( 3 ) 2 − 2 ( 3 ) + 1 Substitute 3 for x.
f ( 3 ) = 27 − 6 + 1 Simplify.
f ( 3 ) = 22
22

Your Turn 5.61 (b) §5.7 source ↗

For the function f ( x ) = 3 x 2 − 2 x + 1 , evaluate the function.

f ( − 1 )

Answer

f ( x ) = 3 x 2 − 2 x + 1
f ( − 1 ) = 3 ( − 1 ) 2 − 2 ( − 1 ) + 1 Substitute –1 for x.
f ( 1 ) = 3 + 2 + 1 Simplify.
f ( 1 ) = 6
6

Your Turn 5.61 (c) §5.7 source ↗

For the function f ( x ) = 3 x 2 − 2 x + 1 , evaluate the function.

f ( t )

Answer

f ( x ) = 3 x 2 − 2 x + 1
f ( t ) = 3 ( t ) 2 − 2 ( t ) + 1 Substitute t for x.
f ( t ) = 3 t 2 − 2 t + 1 Simplify.
3 t 2 − 2 t + 1

Your Turn 5.62 §5.7 source ↗

The number of unread emails in Bryan’s account is 100. This number grows by 15 unread emails a day. The function N ( t ) = 100 + 15 t represents the relation between the number of emails, N , and the time, t , measured in days. Find N (7). Explain what the result means.

Answer

N ( t ) = 100 + 15 t
N ( 5 ) = 100 + 15 ( 7 ) Substitute 7 for t.
N ( 5 ) = 100 + 105 Simplify.
N ( 5 ) = 205

Bryan had 205 unread emails after seven days.

There 205 unread emails after 7 days.

Your Turn 5.63 §5.7 source ↗

Use the set of ordered pairs to determine whether the relation is a function.

{ ( − 3 , − 6 ) , ( − 2 , − 4 ) , ( − 1 , − 2 ) , ( 0 , 0 ) , ( 1 , 2 ) , ( 2 , 4 ) , ( 3 , 6 ) }

Answer

This relation is a function because there are no repeated x-values. Each x-value is matched with only one y-value. This relation is a function.

Your Turn 5.63 (b) §5.7 source ↗

Use the set of ordered pairs to determine whether the relation is a function.

{ (8, - 4), (4, - 2), (2, - 1), (0,0), (2,1), (4,2), (8,4)} 

Answer

This relation is not a function because there are repeated x-values. For example, the x-value 2 is matched with more than one y-value. This relation is not a function.

Your Turn 5.64 §5.7 source ↗

Use the mapping in the given figure to determine whether the relation is a function. Mapping of names and phone numbers. The names and corresponding phone numbers are as follows. Neal: 753-469-9731 cell. Krystal: 684-369-7231 cell. Kelvin: 123-567-4839 work. George: 123-567-4839 work and 639-847-6971 cell. Christa: 567-534-2970 work. Mike: 798-367-8541 cell and 567-534-2970 work.

Answer

This relation is not a function because there are repeated x-values. Both George and Mike are matched with more than one y-value. Both George and Mike have two phone numbers. Each x -value is not matched with only one y -value. This relation is not a function.

Your Turn 5.65 §5.7 source ↗

Determine whether each equation is a function.

4 x + y = − 3

Answer

This is the equation of a line. Each x-value on a line is paired with only one y-value. function

Your Turn 5.65 (b) §5.7 source ↗

Determine whether each equation is a function.

x + y 2 = 1

Answer

x + y 2 = 1 Isolate the y term.
x + y 2 − x = 1 − x
y 2 = 1 − x
y = ± 1 − x Use the Square Root Property.

Substitute 0 for x.

y = 1 and –1.

Thus, you have two y-values paired with one x-value. This is not a function.

not a function

Your Turn 5.65 (c) §5.7 source ↗

Determine whether each equation is a function.

y − x 2 = 2

Answer

y − x 2 = 2

y = x 2 + 2

You square x, then add 2. Since each value of x will correspond to just one value of y, this is a function.

function

Your Turn 5.66 §5.7 source ↗

Determine whether the graph is the graph of a function. A parabola is plotted on an x y coordinate plane. The x-axis ranges from negative 6 to 6, in increments of 1. The y-axis ranges from negative 2 to 10, in increments of 1. The parabola opens up and it passes through the points, (negative 3, 8), (negative 2, 3), (negative 1, 0), (0, negative 1), (1, 0), (2, 3), and (3, 8).Note: all values are approximate.

Answer

This is a function. A vertical line will only pass through it once, so it passes the vertical line test. This graph represents a function.

Your Turn 5.67 §5.7 source ↗

Determine whether the graph is the graph of a function. An ellipse is plotted on an x y coordinate plane. The x and y axes range from negative 6 to 6, in increments of 1. The center of the ellipse is at (0, 0). The ellipse passes through the points, (negative 2, 0), (0, 3), (2, 0), and (0, negative 3).

Answer

This is not a function. There are places where a vertical line can pass through it more than once. It fails the vertical line test. This graph does not represent a function.

Your Turn 5.68 §5.7 source ↗

For the relation { ( 1 , 1 ) , ( 2 , 8 ) , ( 3 , 27 ) , ( 4 , 64 ) , ( 5 , 125 ) } :

Find the domain of the relation.

Answer

The domain is the set of all x -values of the relation: { 1 , 2 , 3 , 4 , 5 } .

Your Turn 5.68 (b) §5.7 source ↗

For the relation { ( 1 , 1 ) , ( 2 , 8 ) , ( 3 , 27 ) , ( 4 , 64 ) , ( 5 , 125 ) } :

Find the range of the relation.

Answer

The range is the set of all y -values of the relation: { 1 , 8 , 27 , 64 , 125 } .

Your Turn 5.69 §5.7 source ↗

Use the given figure to:

List the ordered pairs of the relation.

Answer

The ordered pairs of the relation are: { ( − 3 , 3 ) , ( − 2 , 2 ) , ( − 1 , 0 ) , ( 0 , − 1 ) , ( 2 , − 2 ) , ( 4 , − 4 ) } .

Your Turn 5.69 (b) §5.7 source ↗

Use the given figure to:

Find the domain of the relation.

Answer

The domain is the set of all x -values of the relation: { − 3 , − 2 , − 1 , 0 , 2 , 4 } .

Your Turn 5.69 (c) §5.7 source ↗

Use the given figure to:

Find the range of the relation. Six points are plotted on an x y coordinate plane. The x and y axes range from negative 6 to 6, in increments of 1. The points are plotted at the following coordinates: (negative 3, 3), (negative 2, 2), (negative 1, 0), (0, negative 1), (2, negative 2), and (4, negative 4).
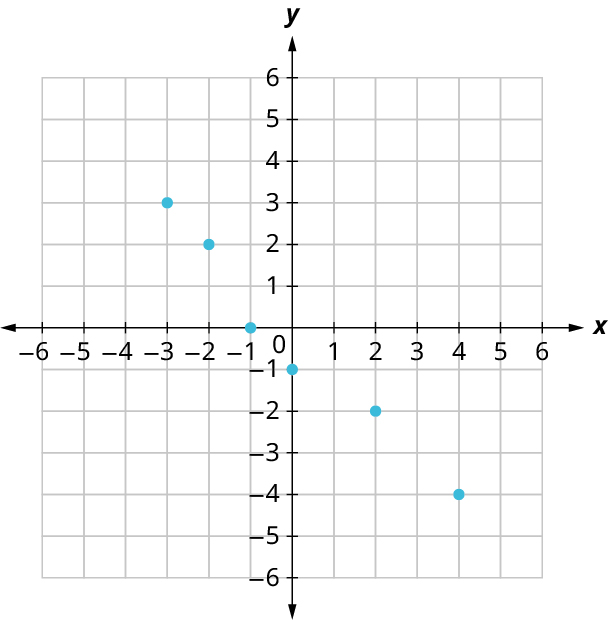
Answer

The range is the set of all y -values of the relation: { − 4 , − 2 , − 1 , 0 , 2 , 3 } .

Check Your Understanding 5.7.57 §5.7 source ↗

If f ( x ) = 2 x − 8 then f ( 3 ) = − 2 .
  1. a.
    True
  2. b.
    False

Answer

A. True
a

f ( x ) = 2 x − 8

f ( 3 ) = 2 ( 3 ) − 8

f ( 3 ) = 6 − 8

f ( 3 ) = − 2

True

Check Your Understanding 5.7.58 §5.7 source ↗

{ ( 1 , 2 ) , ( 2 , 3 ) , ( 3 , 4 ) , ( 2 , 1 ) , ( 3 , 2 ) , ( 4 , 3 ) } represent the ordered pairs of a function.
  1. a.
    True
  2. b.
    False

Answer

B. False
b This relation is not a function because there are repeated x-values. The x-value 3 is matched with more than one y-value. False

Check Your Understanding 5.7.59 §5.7 source ↗
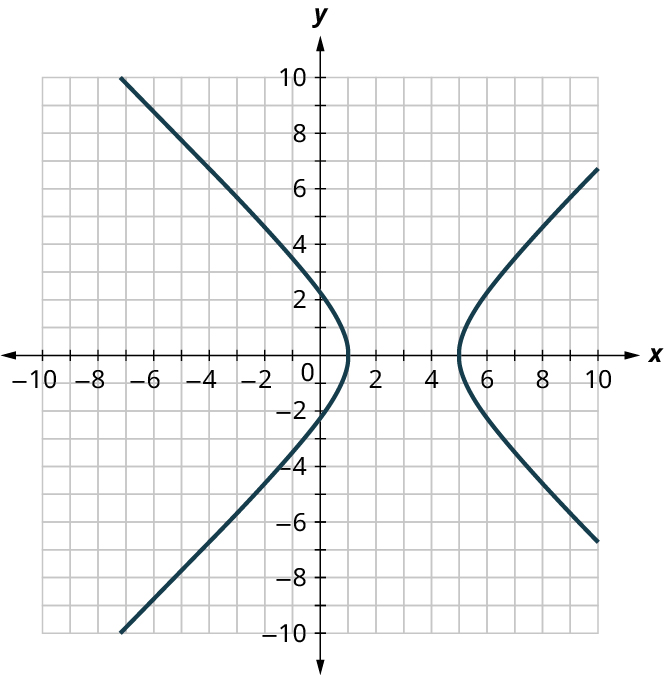
The graph shown represents the graph of a function:
Two functions are graphed on an x y coordinate plane. The x and y axes range from negative 10 to 10, in increments of 1. The first function passes through the points, (negative 6, 9), (negative 2, 4.5), (1, 0), (negative 2, negative 4.5), and (negative 6, negative 9). The second function passes through the points, (9, 6), (7, 3.5), (5, 0), (7, negative 3.5), and (9, negative 6). Note: all values are approximate.
  1. a.
    True
  2. b.
    False

Answer

B. False
b This is not a function. There are places where a vertical line can pass through it more than once. It fails the vertical line test. False

Check Your Understanding 5.7.60 §5.7 source ↗
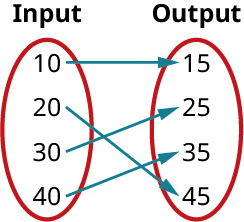
The figure shown represents the mapping of a function.
Mapping of two sets of values. Mapping infers the following data: 10, 15; 20, 45; 30, 25; and 40, 35.
  1. a.
    True
  2. b.
    False

Answer

A. True
a True This relation is a function because there are no repeated x-values. Each x-value is matched with only one y-value.

Check Your Understanding 5.7.61 §5.7 source ↗

The domain of the mapping in the figure is { 15 , 25 , 35 , 45 } .
  1. a.
    True
  2. b.
    False

Answer

B. False
b The domain is the set of all x-values of the relation. {10, 20, 30, 40} False

Your Turn 5.70 §5.8 source ↗

Find the x -intercept and y -intercept on the given graph.
A line is plotted on an x y coordinate plane. The x and y axes range from negative 6 to 6, in increments of 1. The line passes through the following points, (negative 3, negative 5), (0, negative 2), (2, 0), and (6, 4).

Answer

The graph crosses the x -axis at the point (2, 0). The x -intercept is (2, 0). The graph crosses the y -axis at the point (0, −2). The y -intercept is (0, −2).

The y-coordinate of the point where the line crosses the x-axis is zero. For this line, that point is (2, 0). The point where the line crosses the x-axis has the form ( a , 0 ) and is called the x-intercept of the line. For this line, the x-intercept is (2,0).

In each line, the x-coordinate of the point where the line crosses the y-axis is zero. For this line, that point is (0, –2). The point where the line crosses the y-axis has the form ( 0 , b ) and is called the y-intercept of the line. The y-intercept occurs where x is zero. For this line, the y-intercept is (0, –2).

Your Turn 5.71 §5.8 source ↗

Find the intercepts of 3 x + y = 12 and use them to graph the equation.

Answer

3 x + y = 12

Let y = 0 to find the x-intercept.

3 x + 0 = 12

3 x = 12

x = 4

x-intercept: (4, 0).

Let x = 0 to find the y-intercept.

3 ( 0 ) + y = 12

y = 12

y-intercept: (0, 12).

Plot the intercepts and connect to graph the line.

The x -intercept is (4, 0) and the y -intercept is (0, 12).
A line is plotted on an x y coordinate plane. The x and y axes range from negative 10 to 10, in increments of 1. The line passes through the following points, (0, 12), (4, 0), and (5, negative 3).

Your Turn 5.72 §5.8 source ↗

Find the slope of the line shown in the graph. A line is plotted on an x y coordinate plane. The x-axis ranges from negative 4 to 4, in increments of 1. The y-axis ranges from negative 6 to 1, in increments of 1. The line passes through the following points, (negative 1.5, 0), (0, negative 2), and (3, negative 6). Note: all values are approximate.

Answer

Locate two points on the graph whose coordinates are integers. This solution uses (0, –2) and (3, –6).

Sketch a right triangle on the graph to help you count the rise over run.

Start at (0, –2).

Count the rise. Since the rise goes down, it is negative. The rise is –4.

Count the run. The run goes to the right, so it is positive. The run is 3.

Use the slope formula. m = r i s e r u n = − 4 3 = − 4 3

The slope of the line is − 4 3 .

m = − 4 3

Your Turn 5.73 §5.8 source ↗

Use the slope formula to find the slope of the line through the pair of points ( − 3 , 4 ) and ( 2 , − 1 ) .

Answer

Point 1: (–3, 4) and Point 2: (2, –1).

Find the slope.

m = y 2 − y 1 x 2 − x 1 = 2 − ( − 3 ) − 1 − 4 Substitute.
m = 5 − 5 = − 1 Simplify.

The slope is –1.

You can plot the points and verify the slope by counting the rise over the run.

slope = − 1

Your Turn 5.74 §5.8 source ↗

Identify the slope and y -intercept from the equation of the line.

y = 2 x − 1

Answer

When the equation is in the slope-intercept form of the equation of the line,

y = m x + b .

m = the slope.

(0, b) = the y-intercept.

y = 2 x − 1 Since this equation is in slope intercept form, the slope is 2.

The y-intercept is (0, –1).

slope m = 2 and y -intercept = ( 0 , − 1 )

Your Turn 5.74 (b) §5.8 source ↗

Identify the slope and y -intercept from the equation of the line.

x + 4 y = 16

Answer

When the equation is in the slope-intercept form of the equation of the line,

y = m x + b .

m = the slope.

(0, b) = the y-intercept.

x + 4 y = 16 Solve for y.
x + 4 y − x = 16 − x Subtract.
4 y = − x + 16
4 y 4 = − x + 16 4 Divide.
y = − 1 4 x + 4 This is now in slope intercept form.

The slope is − 1 4 .

The y-intercept is (0, 4).

slope m = − 1 4 and y -intercept = ( 0 , 4 )

Your Turn 5.75 §5.8 source ↗

Graph the line of the equation y = − x − 3 using its slope and y -intercept.

Answer

When the equation is in the slope-intercept form of the equation of the line,

y = m x + b .

m = the slope.

(0, b) = the y-intercept.

y = − x − 3 This is in slope intercept form.

The slope is –1. To give you a rise over run, write this as − 1 1 .

The y-intercept is (0, –3).

Plot the point (0, –3).

From that point, use the slope ( m = r i s e r u n = − 1 1 ) to go down one, then right one to plot the next point.

Connect the two points with a line.
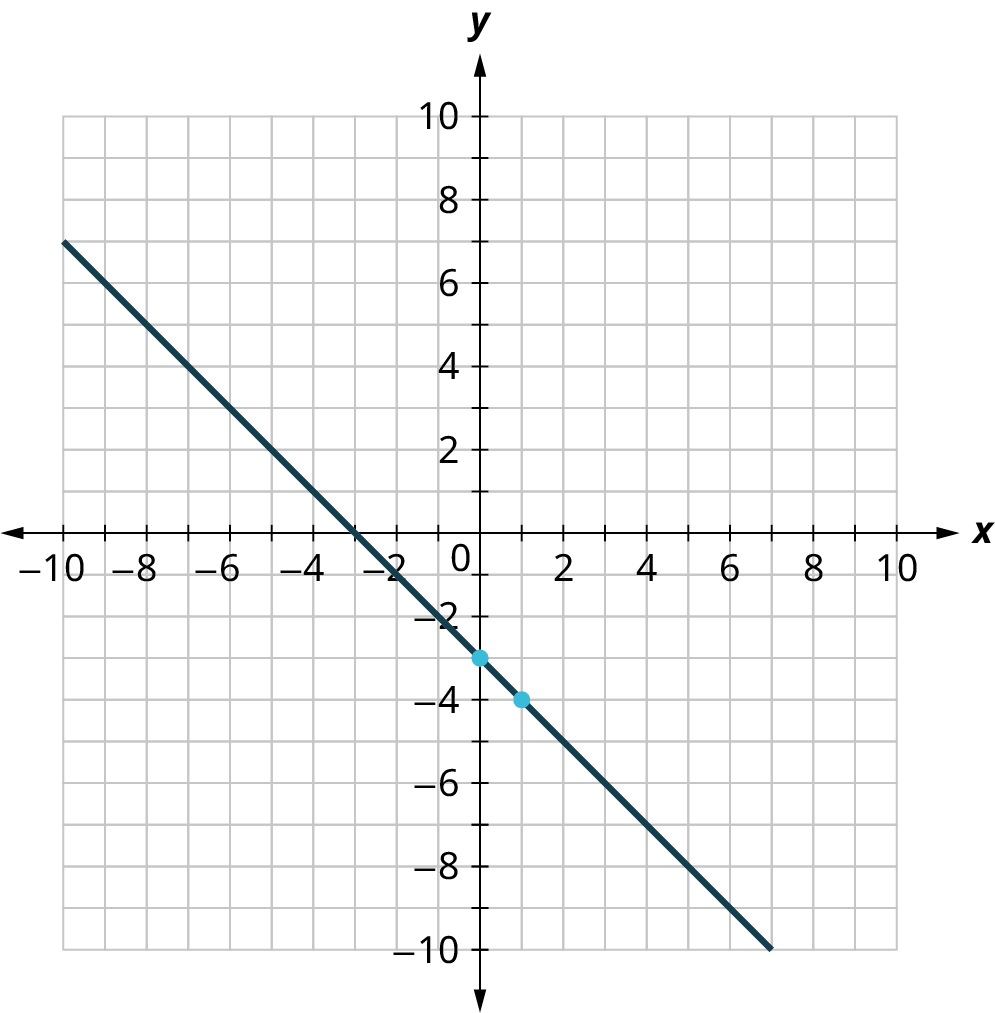
A line is plotted on an x y coordinate plane. The x and y axes range from negative 10 to 10, in increments of 1. The line passes through the following points, (negative 10, 7), (negative 3, 0), (0, negative 3), (1, negative 4), and (6, negative 9). Note: all values are approximate.

Your Turn 5.76 §5.8 source ↗

Graph x = 5 .

Answer

A single variable is a special case.

Make a table of values.

x y
5 2
5 4
5 –1

Plot the points and connect them with a line.
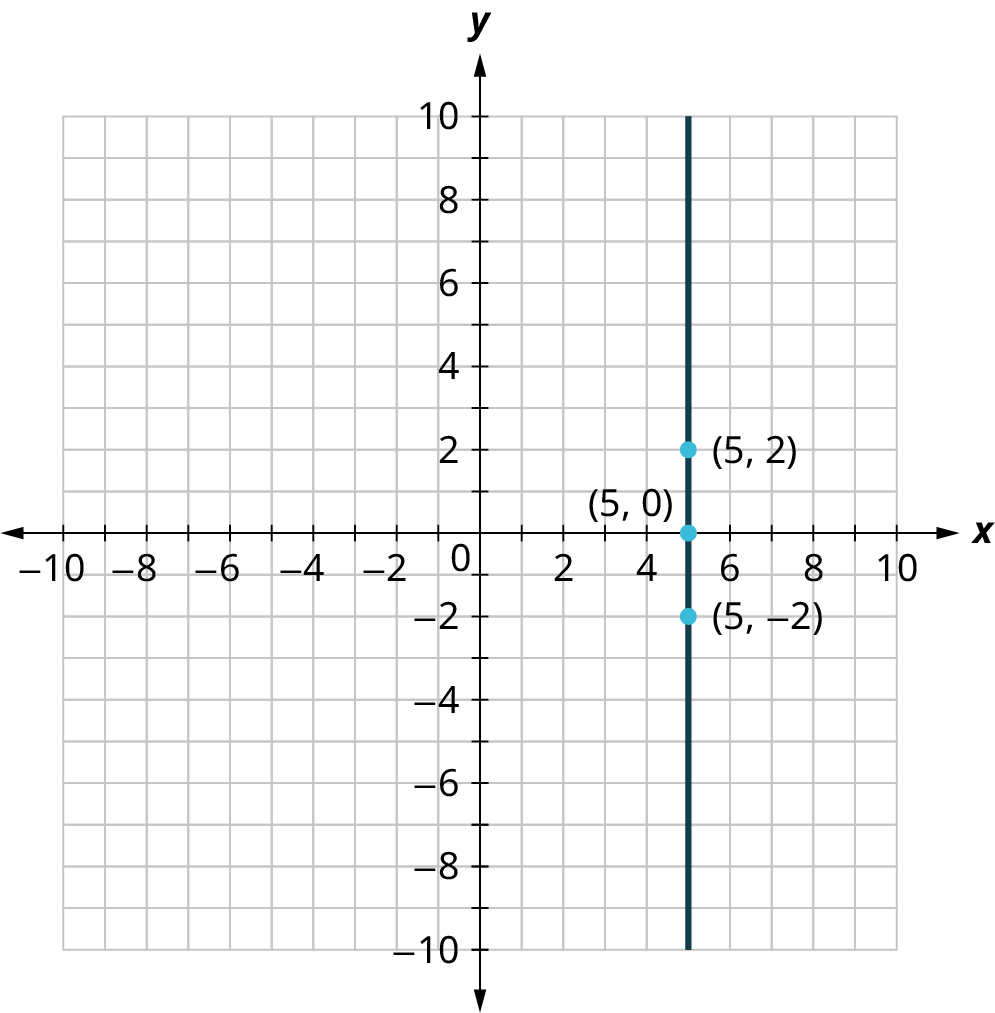
A line is plotted on an x y coordinate plane. The x and y axes range from negative 10 to 10, in increments of 1. The line is vertical and it passes through the following points, (5, negative 2), (5, 0), and (5, 2). Note: all values are approximate.

Your Turn 5.77 §5.8 source ↗

Graph the equation y = − 4 .

Answer

A single variable is a special case.

Make a table of values.

x y
–3 –4
0 –4
2 –4

Plot the points and connect them with a line.
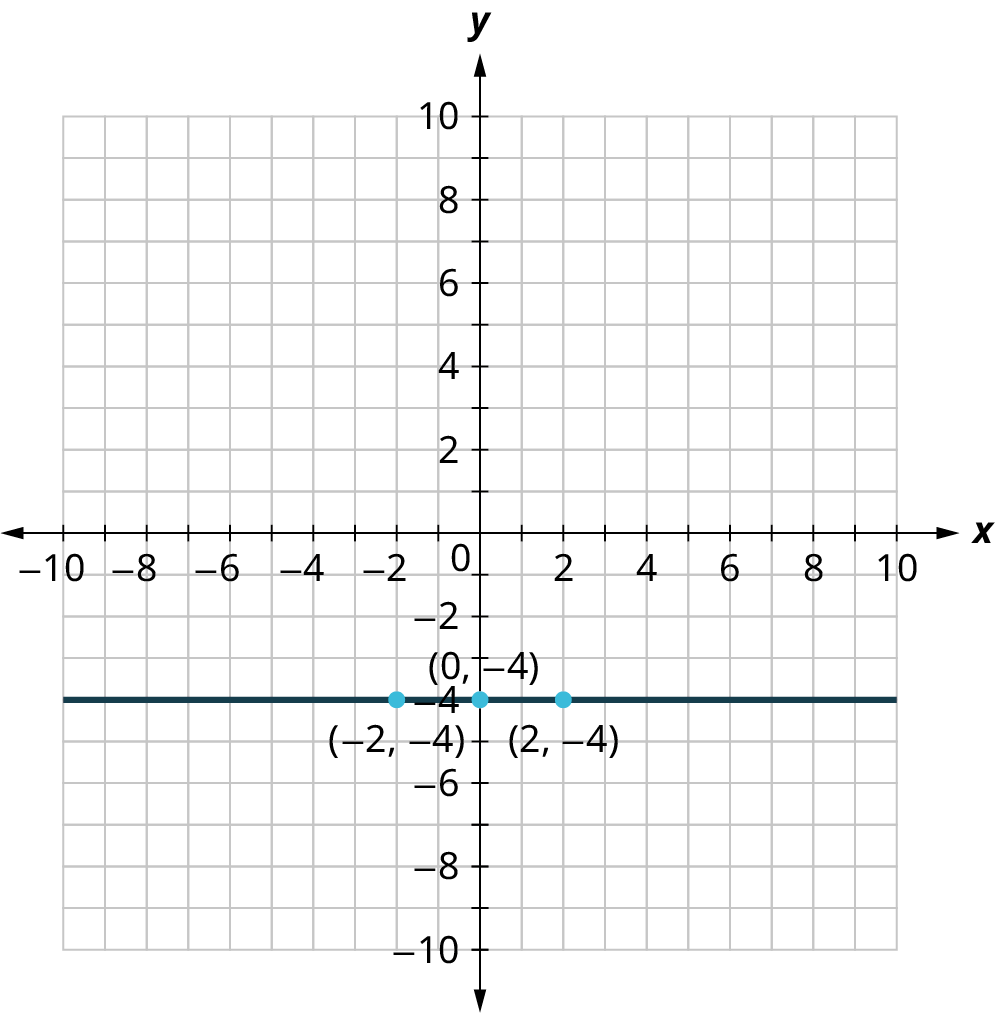
A line is plotted on an x y coordinate plane. The x and y axes range from negative 10 to 10, in increments of 1. The line is horizontal and it passes through the following points, (negative 2, negative 4), (0, negative 4), and (2, negative 4). Note: all values are approximate.

Your Turn 5.78 §5.8 source ↗

In the given figure the x -axis on the graph represents the years. The y-axis represents the number of teachers at Jones High School. A graph titled, Teachers at Jones High. The horizontal axis representing years ranges from 1990 to 2025, in increments of 5. The vertical axis representing the number of teachers ranges from 0 to 90, in increments of 10. The graph shows a line that passes through the points, (1990, 20), (1995, 30), (2000, 50), (2005, 50), (2010, 40), (2015, 60), and (2020, 80). Teachers at Jones High Interpret the x - and y -intercept.

Answer

(0, 20) is the y -intercept and represents that there were 20 teachers at Jones High School in 1990. There is no x -intercept .

Your Turn 5.78 (b) §5.8 source ↗

In the given figure the x -axis on the graph represents the years. The y-axis represents the number of teachers at Jones High School. A graph titled, Teachers at Jones High. The horizontal axis representing years ranges from 1990 to 2025, in increments of 5. The vertical axis representing the number of teachers ranges from 0 to 90, in increments of 10. The graph shows a line that passes through the points, (1990, 20), (1995, 30), (2000, 50), (2005, 50), (2010, 40), (2015, 60), and (2020, 80). Teachers at Jones High For each segment, find the slope.

Answer

Between 1990 and 1995:

The rise is 10. The run is 5.

Use the slope formula. m = r i s e r u n = 10 5 = 2

On average, the school gained two teachers every year between 1990 and 1995.

Between 1995 and 2000:

The rise is 50 – 30 = 20.

The run is 2000 – 1995 = 5.

Use the slope formula. m = r i s e r u n = 20 5 = 4

On average, the school gained four teachers every year between 1995 and 2000.

Between 2000 and 2005:

The rise is 0.

The run is 5.

The slope is 0.

On average, the school gained zero teachers every year between 2000 and 2005. That means the number of teachers remained constant.

Between 2005 and 2010:

The rise is –10.

The run is 5.

Use the slope formula. m = r i s e r u n = − 10 5 = − 2

On average, the school lost two teachers every year between 2005 and 2010.

Between 2010 and 2015:

The rise is 20.

The run is 5.

Use the slope formula. m = r i s e r u n = 20 5 = 4

On average, the school gained four teachers every year between 2010 and 2015.

Between 2015 and 2020:

The rise is 20.

The run is 5.

Use the slope formula. m = r i s e r u n = 20 5 = 4

On average, the school gained four teachers every year between 2015 and 2020, the same slope as between 2010 and 2015.

In the first 5 years the slope is 2; this means that on average, the school gained 2 teachers every year between 1990 and 1995. Between 1995 and 2000, the slope is 4; on average the school gained 4 teachers every year. Then the slope is 0 between 2000 and 2005 meaning the number of teachers remained the same. There was a decrease in teachers between 2005 and 2010, represented by a slope of –2. Finally, the slope is 4 between 2010 and 2020, which indicates that on average the school gained 4 teachers every year.

Your Turn 5.78 (c) §5.8 source ↗

In the given figure the x -axis on the graph represents the years. The y-axis represents the number of teachers at Jones High School. A graph titled, Teachers at Jones High. The horizontal axis representing years ranges from 1990 to 2025, in increments of 5. The vertical axis representing the number of teachers ranges from 0 to 90, in increments of 10. The graph shows a line that passes through the points, (1990, 20), (1995, 30), (2000, 50), (2005, 50), (2010, 40), (2015, 60), and (2020, 80). Teachers at Jones High Create an interpretation of this graph (i.e., make up a story that goes with it).

Answer

Answers will vary. Jones High School was founded in 1990 and hired 2 teachers per year until 1995, when they had an increase in students and they hired 4 teachers per year for the next 5 years. Then there was a hiring freeze, and no teachers were hired between 2000 and 2005. After the hiring freeze, the student population decreased, and they lost 2 teachers per year until 2010. Another surge in student population meant Jones High School hired 4 new teachers per year until 2020 when they had 80 teachers at the school.

Your Turn 5.79 §5.8 source ↗

The equation h = 2 s + 50 is used to estimate a person’s height in inches, h , based on women’s shoe size, s .

Estimate the height of a child who wears women’s shoe size 0.

Answer

h = 2 s + 50

h = 2 ( 0 ) + 50 = 0 + 50 = 50

The estimated height is 50 inches.

50 inches

Your Turn 5.79 (b) §5.8 source ↗

The equation h = 2 s + 50 is used to estimate a person’s height in inches, h , based on women’s shoe size, s .

Estimate the height of a woman with shoe size 8.

Answer

h = 2 s + 50

h = 2 ( 8 ) + 50 = 16 + 50 = 66

The estimated height is 66 inches.

66 inches

Your Turn 5.79 (c) §5.8 source ↗

The equation h = 2 s + 50 is used to estimate a person’s height in inches, h , based on women’s shoe size, s .

Interpret the slope and h -intercept of the equation.

Answer

For every increase in shoe size, the estimated height increases by two inches. The intercept says that for a shoe size of 0, the estimated height is 50 inches. The slope, 2, means that the height h increases 2 inches when the shoe size(s) increases 1 size.

Your Turn 5.79 (d) §5.8 source ↗

The equation h = 2 s + 50 is used to estimate a person’s height in inches, h , based on women’s shoe size, s .

Graph the equation.

Answer

Plot the point (0, 50). Use the slope ( m = 2 = r i s e r u n = 2 1 ) to find another point. From (0, 50), count up 2 and right 1 to determine another point. Plot this point. Connect the two points with a line. The h -intercept means that when the shoe size is 0, the woman’s height is 50 inches. A line is plotted on an x y coordinate plane. The x and y axes range from negative 20 to 140, in increments of 20. The line passes through the points, (negative 30, 0), (0, 50), and (40, 130). Note: all values are approximate.

Your Turn 5.80 §5.8 source ↗

Stella has a home business selling gourmet pizzas. The equation C = 4 p + 25 models the relation between her weekly cost, C , in dollars and the number of pizzas, p , that she sells.

Find Stella’s cost for a week when she sells no pizzas.

Answer

C = 4 p + 25

C = 4 ( 0 ) + 25 = 25

Stella’s costs are $25 when no pizzas are sold.

$25

Your Turn 5.80 (b) §5.8 source ↗

Stella has a home business selling gourmet pizzas. The equation C = 4 p + 25 models the relation between her weekly cost, C , in dollars and the number of pizzas, p , that she sells.

Find the cost for a week when she sells 15 pizzas.

Answer

C = 4 ( 15 ) + 25 = 60 + 25 = 85

Stella’s costs are $85.

$85

Your Turn 5.80 (c) §5.8 source ↗

Stella has a home business selling gourmet pizzas. The equation C = 4 p + 25 models the relation between her weekly cost, C , in dollars and the number of pizzas, p , that she sells.

Interpret the slope and C -intercept of the equation.

Answer

When the equation is in the slope-intercept form of the equation of the line,

y = m x + b .

m = the slope.

(0, b) = the y-intercept.

C = 4 p + 25

The y-intercept gives the cost when no pizzas are sold: $25.

The slope gives the rate at which costs increase per pizza made. For every pizza sold, Stella’s costs increase by $4.

The slope, 4, means that the weekly cost, C , increases by $4 when the number of pizzas sold, p , increases by 1. The C -intercept means that when the number of pizzas sold is 0, the weekly cost is $25.

Your Turn 5.80 (d) §5.8 source ↗

Stella has a home business selling gourmet pizzas. The equation C = 4 p + 25 models the relation between her weekly cost, C , in dollars and the number of pizzas, p , that she sells.

Graph the equation.

Answer

Plot the point (0, 25).

From that point, use the slope ( m = r i s e r u n = 4 1 ) to go up 4, then right 1 to plot the next point.

Connect the two points with a line.

Graph: A line is plotted on an x y coordinate plane. The x-axis ranges from negative 60 to 210, in increments of 15. The y-axis ranges from negative 75 to 200, in increments of 15. The line passes through the points, (negative 15, negative 35), (0, 25), (13, 85), and (30, 145). Note: all values are approximate.
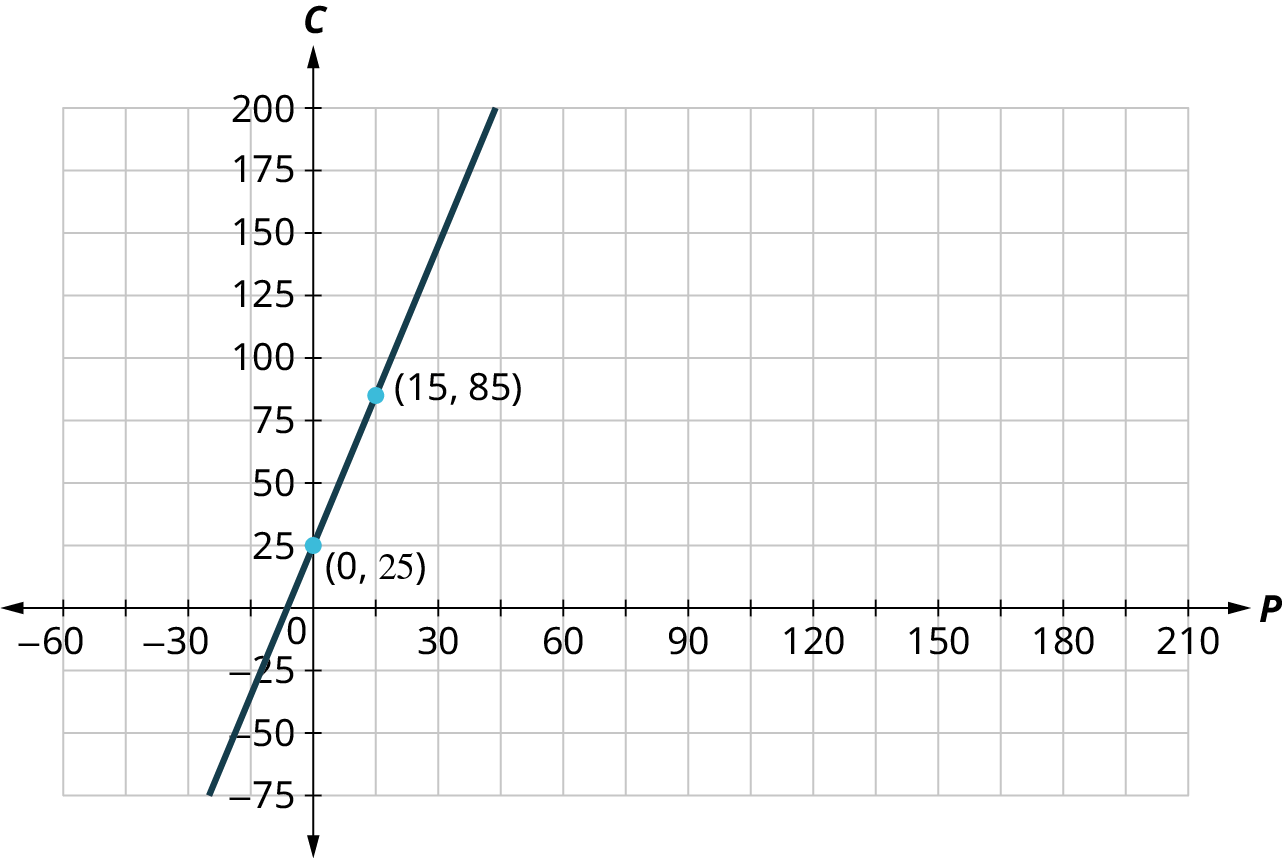
Check Your Understanding 5.8.62 §5.8 source ↗

True or False. The x -intercept of y =   2 x   − 8  is  ( 0 , − 8 ) .
  1. a.
    True
  2. b.
    False

Answer

A. True
a

Substitute 0 for y to find the x-intercept.

y = 2 ( 0 ) − 8 = − 8

(0, –8) is the x-intercept.

True

Check Your Understanding 5.8.63 §5.8 source ↗

True or False. The slope of the line containing the points (1, 2) and (2, 4) is 1.
  1. a.
    True
  2. b.
    False

Answer

B. False
b

The slope is 2, not 1.

Point 1: (1, 2) and Point 2: (2, 4).

Find the slope.

m = y 2 − y 1 x 2 − x 1 = 4 − 2 2 − 1 Substitute.
m = 2 1 = 2 Simplify.

The slope is 2.

You can plot the points and verify the slope by counting the rise over the run.

False

Check Your Understanding 5.8.64 §5.8 source ↗

For the following exercises, use the graph shown.
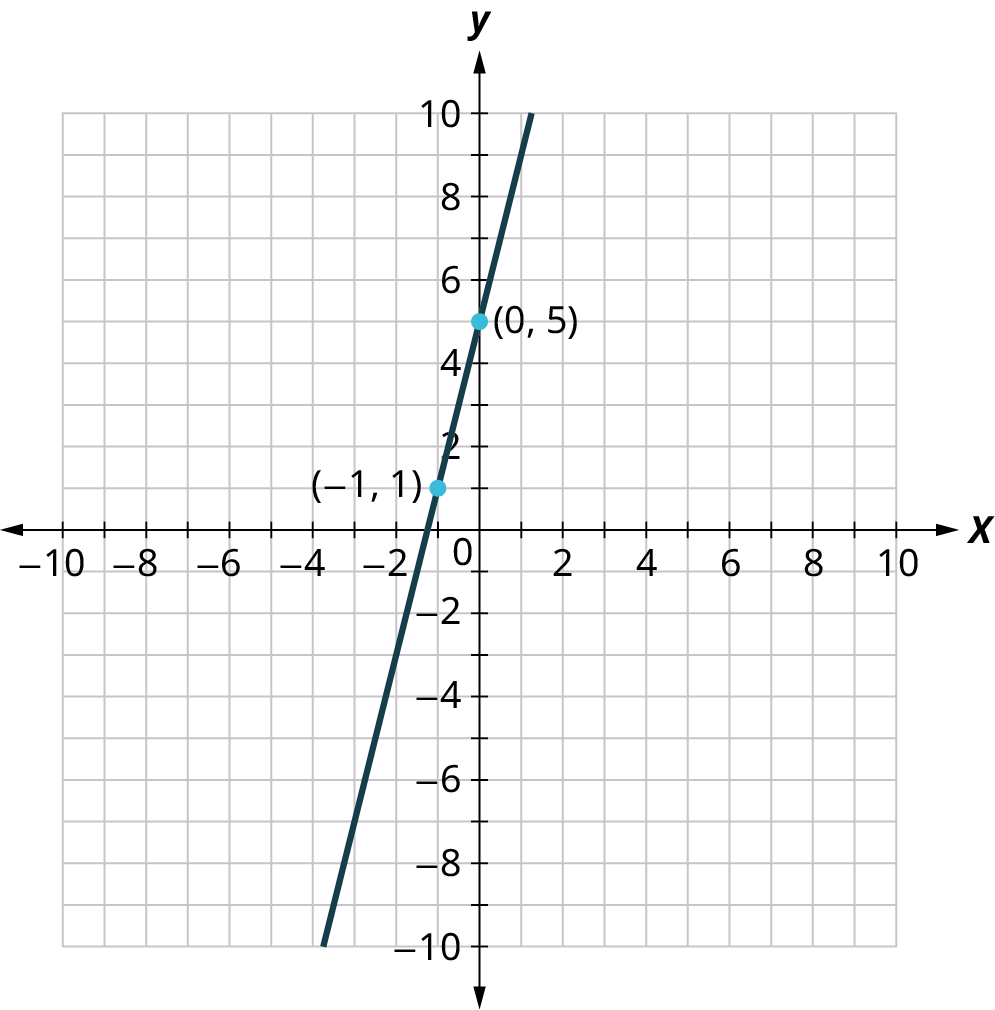
A line is plotted on an x y coordinate plane. The x and y axes range from negative 10 to 10, in increments of 1. The line passes through the points, (negative 3, negative 7), (negative 1, 1), (0, 5), and (1, 9). Note: all values are approximate.

True or False. This graph has a slope of 5.
  1. a.
    True
  2. b.
    False

Answer

B. False
b Count the rise over run between the two labeled points. The rise is 4. The run is 1. The rise over run is 4, not 5. False

Check Your Understanding 5.8.65 §5.8 source ↗

For the following exercises, use the graph shown.
A line is plotted on an x y coordinate plane. The x and y axes range from negative 10 to 10, in increments of 1. The line passes through the points, (negative 3, negative 7), (negative 1, 1), (0, 5), and (1, 9). Note: all values are approximate.

True or False. This is the graph of the equation y =   4 x + 5 .
  1. a.
    True
  2. b.
    False

Answer

A. True
a

The slope is 4. The y-intercept is (0, 5).

When the equation is in the slope-intercept form of the equation of the line,

y = m x + b .

m = the slope.

(0, b) = the y-intercept.

This line is y = 4 x + 5 .

True

Check Your Understanding 5.8.66 §5.8 source ↗

True or False. All vertical lines have a slope of zero.
  1. a.
    True
  2. b.
    False

Answer

B. False
b Vertical lines have an undefined slope. This is also expressed as no slope. False

Your Turn 5.81 §5.9 source ↗

Determine whether the ordered pair is a solution to the system.
{ x − 3 y = − 8 − 3 x − y = 4

( 2 , − 2 )

Answer

{ x − 3 y = − 8 − 3 x − y = 4
Test (2, –2).  
2 − 3 ( − 2 ) = − 8 Substitute into the first equation.
2 + 6 = − 8 This is not true. The ordered pair is not a solution to the system because the ordered pair is not a solution to the equation.
No

Your Turn 5.81 (b) §5.9 source ↗

Determine whether the ordered pair is a solution to the system.
{ x − 3 y = − 8 − 3 x − y = 4

( − 2 , 2 )

Answer

{ x − 3 y = − 8 − 3 x − y = 4
Test (–2, 2).  
− 2 − 3 ( 2 ) = − 8 Substitute into the first equation.
− 2 − 6 = − 8 This is true.
− 3 ( − 2 ) − ( 2 ) = 4 Substitute into the second equation.
6 − 2 = 4  
4   =   4 This is true. This ordered pair is a solution to the system.
Yes

Your Turn 5.82 §5.9 source ↗

Determine whether the ordered pair is a solution to the system.
{ y = 2 3 x + 1 − 2 x + 3 y = 5

( 3 , 3 )

Answer

{ y = 2 3 x + 1 − 2 x + 3 y = 5
Test (3, 3).
3 = 2 3 ( 3 ) + 1 Substitute into the first equation.
3 = 2 + 1 This is true.
− 2 ( 3 ) + 3 ( 3 ) = 5 Substitute into the second equation.
− 6 + 9 = 5  
3 = 5 This is not true. This ordered pair is not a solution to the system.
No

Your Turn 5.82 (b) §5.9 source ↗

Determine whether the ordered pair is a solution to the system.
{ y = 2 3 x + 1 − 2 x + 3 y = 5

( − 3 , 3 )

Answer

{ y = 2 3 x + 1 − 2 x + 3 y = 5
Test (–3, 3)
3 = 2 3 ( − 3 ) + 1 Substitute into the first equation.
3 = − 2 + 1 This is not true. This ordered pair is not a solution to the system. There is no need to test the second equation.
No

Your Turn 5.83 §5.9 source ↗

Solve this system of linear equations by graphing.
{ x − 3 y = − 3 x + y = 5

Answer

Graph the first line by using intercepts: ( − 3 , 0 ) and ( 0 , 1 ) .

Graph the second line by using intercepts ( 5 , 0 ) and ( 0 , 5 ) .

The two lines cross at ( 3 , 2 ) .

Checking is left to you.

Two lines are plotted on an x y coordinate plane. The x and y axes range from negative 10 to 10, in increments of 1. The first line passes through the points, (negative 9, negative 2), (negative 3, 0), (0, 1), and (9, 4). The second line passes through the points, (negative 4, 9), (0, 5), (5, 0), and (9, negative 4). The two lines intersect at (3, 2).

Your Turn 5.84 §5.9 source ↗

Solve this system of linear equations by substitution:
{ x − 3 y = − 3 x + y = 5

Answer

{ x − 3 y = − 3 x + y = 5

Step 1: Solve one of the equations for either variable.

x − 3 y = − 3

x − 3 y + 3 y = − 3 + 3 y

x = − 3 + 3 y

Step 2: Substitute the expression from Step 1 into the other equation.

x + y = 5

− 3 + 3 y + y = 5

Step 3: Solve the resulting equation.

− 3 + 4 y = 5

− 3 + 4 y + 3 = 5 + 3

4 y = 8

y = 2

Step 4: Substitute the solution in Step 3 into either of the original equations to find the other variable.

x + y = 5

x + 2 = 5

x = 3

Step 5: Write the solution as an ordered pair.

( 3 , 2 )

Step 6: Checking is left to you.

(3, 2)

Your Turn 5.85 §5.9 source ↗

Solve this system of linear equations by elimination:
{ x − 3 y = − 3 x + y = 5

Answer

{ x − 3 y = − 3 x + y = 5

Step 1: Write both equations in standard form, A x + B y = C .

This system already is in standard form.

Step 2: Make the coefficients of one variable opposites.

( − 1 ) ( x + y ) = ( − 1 ) 5

− x − y = − 5

Step 3: Add the equations resulting from Step 2 to eliminate one variable.

  x –3y = –3
  –x –y = –5
SUM:   –4y = –8

Step 4: Solve for the remaining variable.

− 4 y = − 8

y = 2

Step 5: Substitute the solution from Step 4 into one of the original equations. Solve for the remaining variable.

x + y = 5

x + 2 = 5

x = 3

Step 6: Write the solution as an ordered pair.

( 3 , 2 )

Step 6: Checking is left to you.

( 3 , 2 )

Your Turn 5.86 §5.9 source ↗

Solve the system by a method of your choice:
{ y = 1 3 x + 2 x − 3 y = 7

Answer

{ y = 1 3 x + 2 x − 3 y = 7

Step 1: Solve one of the equations for either variable.

y = 1 3 x + 2

Step 2: Substitute the expression from Step 1 into the other equation.

x − 3 y = 7

x − 3 ( 1 3 x + 2 ) = 7

x − x − 6 = 7

Step 3: Solve the resulting equation.

− 6 = 7

This is false. There is no solution to this system.

There is no solution to this system.

Your Turn 5.87 §5.9 source ↗

Solve the system by a method of your choice:
{ y = 3 x − 5 − 18 x + 6 y = − 30

Answer

{ y = 3 x − 5 − 18 x + 6 y = − 30

Step 1: Solve one of the equations for either variable.

y = 3 x − 5

Step 2: Substitute the expression from Step 1 into the other equation.

− 18 x + 6 y = − 30

− 18 x + 6 ( 3 x − 5 ) = − 30

Step 3: Solve the resulting equation.

− 18 x + 6 ( 3 x − 5 ) = − 30

− 18 x + 18 x − 30 = − 30

− 30 = − 30

This is always true. This system has infinitely many solutions.

There are infinitely many solutions to this system.

Your Turn 5.88 §5.9 source ↗

Translate to a system of equations and then solve.
When Jenna spent 10 minutes on the elliptical trainer and then did circuit training for 20 minutes, her fitness app says she burned 278 calories. When she spent 20 minutes on the elliptical trainer and 30 minutes circuit training, she burned 473 calories. How many calories does she burn for each minute on the elliptical trainer? How many calories for each minute of circuit training?

Answer

Let e = the number of calories for each minute of elliptical training.

Let c = the number of calories for each minute of circuit training.

Make a table of what you know.

  Elliptical Minutes Circuit Minutes Calories
First pass 10 20 278
Second pass 20 30 473

You can make a system of equations using this information.

{ 10 e + 20 c = 278 20 e + 30 c = 473

Step 1: Write both equations in standard form, A x + B y = C .

This system already is in standard form.

Step 2: Make the coefficients of one variable opposites.

− 2 ( 10 e + 20 c ) = − 2 ( 278 )

− 20 e − 40 c = − 556

Step 3: Add the equations resulting from Step 2 to eliminate one variable.

  –20e –40c = –556
  20e 30c = 473
SUM:   –10c = –83

Step 4: Solve for the remaining variable.

− 10 c = − 83

c = 8.3

Step 5: Substitute the solution from Step 4 into one of the original equations. Solve for the remaining variable.

10 e + 20 c = 278

10 e + 20 ( 8.3 ) = 278

10 e + 20 ( 8.3 ) = 278

10 e + 166 = 278

10 e = 112

e = 11.2

Step 6: Interpret the answer.

Jenna burns 8.3 calories per minute circuit training and 11.2 calories per minute on the elliptical trainer.

Step 6: Checking is left to you.

Jenna burns 8.3 calories per minute circuit training and 11.2 calories per minute while on the elliptical trainer.

Check Your Understanding 5.9.67 §5.9 source ↗

Decide whether it would be more convenient to solve the system of equations by substitution or elimination.

{ 8 x − 15 y = − 32 6 x + 3 y = − 5

Answer

Elimination is best because you can multiply the second equation by 5 to eliminate the y variable. Elimination

Check Your Understanding 5.9.68 §5.9 source ↗

Decide whether it would be more convenient to solve the system of equations by substitution or elimination.

{ x = 4 y − 3 4 x − 2 y = − 6

Answer

Substitution is a good choice because the first equation is already solved for x. Substitution

Check Your Understanding 5.9.69 §5.9 source ↗

Decide whether it would be more convenient to solve the system of equations by substitution or elimination.

{ y = 7 x − 5 3 x − 2 y = 16

Answer

Substitution is a good choice because the first equation is already solved for y. Substitution

Check Your Understanding 5.9.70 §5.9 source ↗

Decide whether it would be more convenient to solve the system of equations by substitution or elimination.

{ 12 x − 5 y = − 42 3 x + 7 y = − 15

Answer

Elimination is best because you can multiply the second equation by –4 to eliminate the x variable. Elimination

Check Your Understanding 5.9.71 §5.9 source ↗

Decide whether it would be more convenient to solve the system of equations by substitution or elimination.

{ y = 4 x + 9 5 x − 2 y = − 21

Answer

Substitution is a good choice because the first equation is already solved for y. Substitution

Check Your Understanding 5.9.72 §5.9 source ↗

Decide whether it would be more convenient to solve the system of equations by substitution or elimination.

{ 9 x − 4 y = 24 3 x + 5 y = 14

Answer

Elimination is best because you can multiply the second equation by –3 to eliminate the x variable. Elimination

Check Your Understanding 5.9.73 §5.9 source ↗

Decide whether it would be more convenient to solve the system of equations by substitution or elimination.

{ 14 x − 15 y = − 30 7 x + 2 y = 10

Answer

Elimination is best because you can multiply the second equation by –2 to eliminate the x variable. Elimination

Check Your Understanding 5.9.74 §5.9 source ↗

Decide whether it would be more convenient to solve the system of equations by substitution or elimination.

{ x = 9 y − 11 2 x − 7 y = − 27

Answer

Substitution is a good choice because the first equation is already solved for x. Substitution

Your Turn 5.89 §5.10 source ↗

Determine whether the ordered pair is a solution to the system:
{ x − 5 y > 10 2 x + 3 y > − 2

( 3 , − 1 )

Answer

{ x − 5 y > 10 2 x + 3 y > − 2
x − 5 y > 10 Substitute in the first inequality.
3 − 5 ( − 1 ) > 10
3 + 6 > 10 Simplify.
9 > 10

This is not true. This is not a solution to the system.

not a solution

Your Turn 5.89 (b) §5.10 source ↗

Determine whether the ordered pair is a solution to the system:
{ x − 5 y > 10 2 x + 3 y > − 2

( 6 , − 3 )

Answer

{ x − 5 y > 10 2 x + 3 y > − 2
x − 5 y > 10 Substitute in the first inequality.
6 − 5 ( − 3 ) > 10
6 + 15 > 10 Simplify.
23 > 10 This is true.
2 x + 3 y > − 2 Substitute in the second inequality.
2 ( 6 ) + 3 ( − 3 ) > − 2
12 − 9 > − 2 Simplify.
3 > − 2

This is true. The ordered pair made both inequalities true. This is a solution to the system.

a solution

Your Turn 5.90 §5.10 source ↗

Use the graph shown to solve the system of linear inequalities:
{ y < 3 x + 2 y > − x − 1
Two dashed lines are plotted on an x y coordinate plane. The x and y axes range from negative 10 to 10, in increments of 1. The first line passes through the points, (negative 9, 8), (negative 1, 0), (0, 1), and (8, negative 9). The region above the line is shaded in gray. The second line passes through the points, (negative 3, negative 7), (0, 2), and (2, 8). The region to the right of the line is shaded in dark blue. The two lines intersect approximately at (negative 0.8, negative 0.2). The region to the right of the intersection point and within the lines is shaded in light blue.Two dashed lines are plotted on an x y coordinate plane. The x and y axes range from negative 10 to 10, in increments of 1. The first line passes through the points, (negative 9, 8), (negative 1, 0), (0, 1), and (8, negative 9). The region above the line is shaded in gray. The second line passes through the points, (negative 3, negative 7), (0, 2), and (2, 8). The region to the right of the line is shaded in dark blue. The two lines intersect approximately at (negative 0.8, negative 0.2). The region to the right of the intersection point and within the lines is shaded in light blue.

Answer

Look at the graph. Find the region that satisfies both inequalities. To do this, pick a test point in the area shaded by both graphs and check.

Try (1, 7).
{ y < 3 x + 2 y > − x − 1
y < 3 x + 2 Substitute in the first inequality.
7 < 3 ( 7 ) + 2
7 < 21 + 2 Simplify.
7 < 23 This is true.
y > − x − 1 Substitute in the second inequality.
7 > − 1 − 1
7 > − 2 Simplify. This is also true.

The ordered pair made both inequalities true. This is a solution to the system.

The region containing (0, 0) is the solution to the system of linear inequalities.

Your Turn 5.91 §5.10 source ↗

Solve the system by graphing:
{ x + y ≤ 2 y ≥ 2 3 x − 1

Answer

x + y ≤ 2

Graph the first line as a solid line using intercepts: ( 2 , 0 ) and ( 0 , 2 ) .

Test (0, 0).
0 + 0 ≤ 2 This is true. Shade lightly the side where (0, 0) is located.
y ≥ 2 3 x − 1

Graph the second line as a solid line using the intercept ( 0 , − 1 ) and the slope of 2 3 .

Test (0, 0).
0 ≥ 2 3 ( 0 ) − 1
0 ≥ − 1 This is also true. Shade lightly the side where (0, 0) is located.

The solution is the region shaded by both graphs.

The solution is the darkest shaded region.
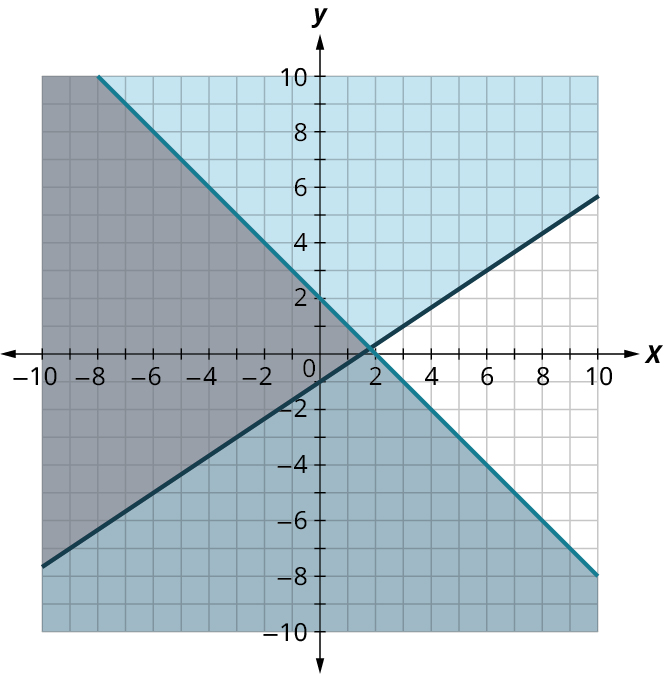
Two lines are plotted on a coordinate plane. The horizontal and vertical axes range from negative 10 to 10, in increments of 1. The first line passes through the points, (negative 7, 9), (0, 2), (2, 0), and (9, negative 7). The region below the line is shaded in dark blue. The second line passes through the points, (negative 9, negative 7), (0, negative 1), and (9, 5). The region above the line is shaded in light blue. The two lines intersect approximately at (1.8, 0.3). The region to the left of the intersection point and within the lines is shaded in gray.Two lines are plotted on a coordinate plane. The horizontal and vertical axes range from negative 10 to 10, in increments of 1. The first line passes through the points, (negative 7, 9), (0, 2), (2, 0), and (9, negative 7). The region below the line is shaded in dark blue. The second line passes through the points, (negative 9, negative 7), (0, negative 1), and (9, 5). The region above the line is shaded in light blue. The two lines intersect approximately at (1.8, 0.3). The region to the left of the intersection point and within the lines is shaded in gray.

Your Turn 5.92 §5.10 source ↗

Solve the system by graphing:
{ y ≥ 3 x − 2 y < − 1

Answer

y ≥ 3 x − 2

Graph the first line as a solid line using the intercept ( 0 , − 2 ) and the slope of 3 .

Test (0, 0).
0 ≥ 3 ( 0 ) − 2
0 ≥ − 2 This is true. Shade lightly the side where (0, 0) is located.
y < − 1

Graph the second line as a dotted line using the intercept ( 0 , − 1 ) and the slope of 0 . (It is a horizontal line).

Test (0, 0).
0 < − 1 This is not true. Shade lightly the side where (0, 0) is not located.

The solution is the region shaded by both graphs.

The solution is the lighter shaded region.
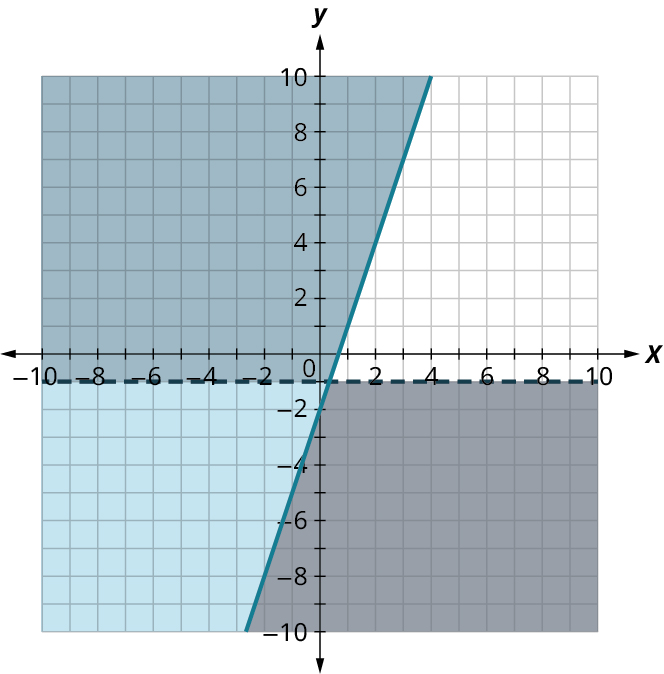
Two lines are plotted on a coordinate plane. The horizontal and vertical axes range from negative 10 to 10, in increments of 1. The first (dashed) line is horizontal and it passes through y equals negative 1. The region below the line is shaded in gray. The second (solid) line passes through the points, (negative 2, negative 8), (0, negative 2), and (3, 7). The region to the left of the line is shaded in dark blue. The two lines intersect approximately at (0.5, 1). The region below the intersection point and within the lines is shaded in light blue.Two lines are plotted on a coordinate plane. The horizontal and vertical axes range from negative 10 to 10, in increments of 1. The first (dashed) line is horizontal and it passes through y equals negative 1. The region below the line is shaded in gray. The second (solid) line passes through the points, (negative 2, negative 8), (0, negative 2), and (3, 7). The region to the left of the line is shaded in dark blue. The two lines intersect approximately at (0.5, 1). The region below the intersection point and within the lines is shaded in light blue.

Your Turn 5.93 §5.10 source ↗

Solve the system by graphing:
{ 3 x − 2 y ≥ 12 y ≥ 3 2 x + 1

Answer

3 x − 2 y ≥ 12

Graph the first line as a solid line using the intercepts ( 4 , 0 ) and ( 0 , − 6 ) .

Test (0, 0).
( 0 ) x − 2 ( 0 ) ≥ 12
0 ≥ 12 This is false. Shade lightly the side where (0, 0) is not located.
y ≥ 3 2 x + 1

Graph the second line as a solid line using the intercept ( 0 , 1 ) and the slope of 3 2 .

Test (0, 0).
0 ≥ 3 2 ( 0 ) + 1
0 ≥ 1 This is not true. Shade lightly the side where (0, 0) is not located.

There is no overlap in this graph, no shared points There is no solution.

No solution.
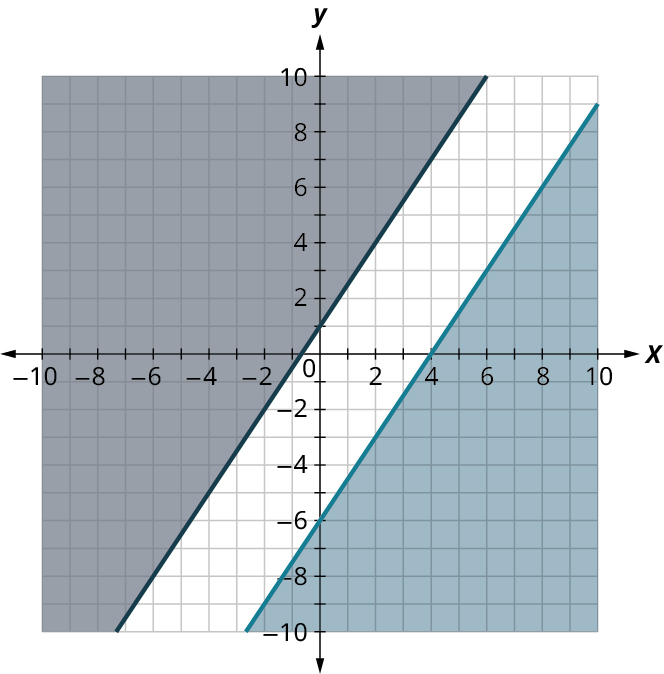
Two lines are plotted on a coordinate plane. The horizontal and vertical axes range from negative 10 to 10, in increments of 1. The first line passes through the points, (negative 6, negative 8), (0, 1), and (4, 7). The region above the line is shaded in gray. The second line passes through the points, (negative 2, negative 9), (0, negative 6), (4, 0), and (10, 9). The region below the line is shaded in blue.Two lines are plotted on a coordinate plane. The horizontal and vertical axes range from negative 10 to 10, in increments of 1. The first line passes through the points, (negative 6, negative 8), (0, 1), and (4, 7). The region above the line is shaded in gray. The second line passes through the points, (negative 2, negative 9), (0, negative 6), (4, 0), and (10, 9). The region below the line is shaded in blue.

Your Turn 5.94 §5.10 source ↗

Solve the system by graphing:
{ y ≥ 3 x + 1 − 3 x + y ≥ − 4

Answer

y ≥ 3 x + 1

Graph the first line as a solid line using the intercept ( 0 , 1 ) and the slope of 3 .

Test (0, 0).
0 ≥ 3 ( 0 ) + 1
0 ≥ 1 This is false. Shade lightly the side where (0, 0) is not located.
− 3 x + y ≥ − 4
y ≥ 3 x − 4 Rearrange the inequality to avoid fractional intercepts.

Graph the second line as a solid line using the intercept ( 0 , − 4 ) and the slope of 3 .

Test (0, 0).
0 ≥ 3 ( 0 ) − 4
0 ≥ − 4 This is true. Shade lightly the side where (0, 0) is located.

The solution is the region shaded by both graphs.

The solution is the lighter shaded region.
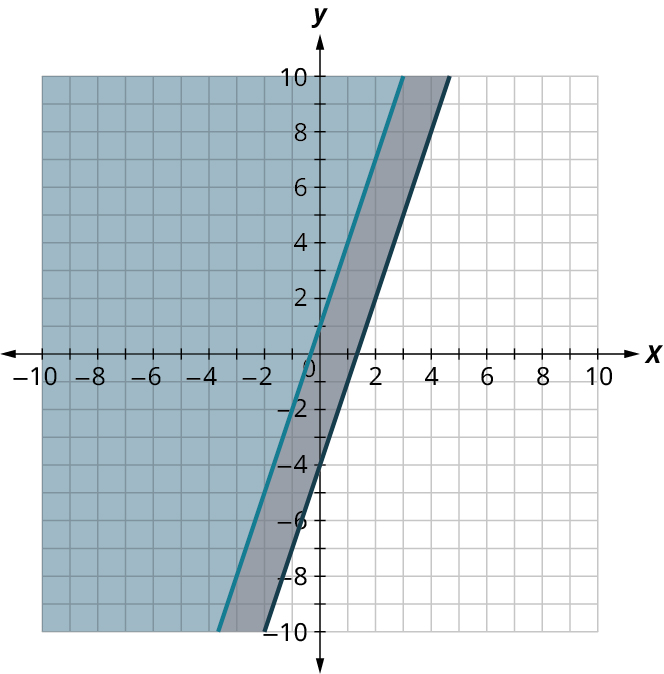
Two lines are plotted on a coordinate plane. The horizontal and vertical axes range from negative 10 to 10, in increments of 1. The first line passes through the points, (negative 3, negative 8), (0, 1), and (2, 7). The region above the line is shaded in light blue. The second line passes through the points, (negative 1, negative 7), (0, negative 4), (2, 2), and (4, 8). The region above the line is shaded in gray. The region above the second line is shaded in both colors and appears dark blue.

Your Turn 5.95 §5.10 source ↗

Omar needs to eat at least 800 calories before going to his team practice. All he wants is hamburgers and cookies, and he doesn’t want to spend more than $5. At the hamburger restaurant near his college, each hamburger has 240 calories and costs $1.40. Each cookie has 160 calories and costs $0.50.

Write a system of inequalities to model this situation.

Answer

Let h = the number of hamburgers eaten.

Let c = the number of cookies eaten.

A hamburger has 240 calories and costs $1.40.

A cookie has 160 calories and costs $0.50.

Omar wants to spend less than or equal to $5.

Omar needs to eat 800 calories.

The number of hamburgers and hot dogs cannot be less than zero.

Make a table of what you know.

Hamburger calories Cookie Calories at least 800 calories
240h 160h ≥ 800
Hamburger cost in $ Cookie cost in $ no more than $5
1.40h 0.50c ≤ 5

You can make a system of equations using this information.

{ 240 h + 160 c ≥ 800 1.4 h + 0.5 c ≤ 5 h ≥ 0 c ≥ 0

{ 240 h + 160 C ≥ 800 1.40 h + 0.50 C ≤ 5 h ≥ 0 C ≥ 0

Your Turn 5.95 (b) §5.10 source ↗

Omar needs to eat at least 800 calories before going to his team practice. All he wants is hamburgers and cookies, and he doesn’t want to spend more than $5. At the hamburger restaurant near his college, each hamburger has 240 calories and costs $1.40. Each cookie has 160 calories and costs $0.50.

Graph the system.

Answer

{ 240 h + 160 c ≥ 800 1.4 h + 0.5 c ≤ 5 h ≥ 0 c ≥ 0

To avoid too much clutter on the graph, for the last two inequalities, just remember that the solution is only in quadrant I.

240 h + 160 c ≥ 800 To make this easier to work with, divide both sides by 80.
3 h + 2 c ≥ 10
2 c ≥ − 3 h + 10 Solve for c.
2 c 2 ≥ − 3 h + 10 2
c ≥ − 3 2 h + 5
Test (0, 0).
0 ≥ − 3 2 ( 0 ) + 5
0 ≥ 5 This is false. Shade lightly the side where (0, 0) is not.

Graph this boundary with a solid line, an intercept at ( 0 , 5 ) and a slope of − 3 2 .

1.4 h + 0.5 c ≤ 5 Multiply by 2 to clear the fraction for what takes the place of “y.”
2 ( 1.4 h + 0.5 c ) ≤ 2 ( 5 )
2.8 h + c ≤ 10
c ≤ − 2.8 h + 10

Graph this boundary with a solid line, an intercept at ( 0 , 10 ) , and a slope of − 2.8 .

Test (0, 0).
1.4 ( 0 ) + 0.5 ( 0 ) ≤ 5
0 ≤ 5 This is true. Shade lightly the side where (0, 0) is located.

The shaded area is between the two lines. This is the solution to the system.
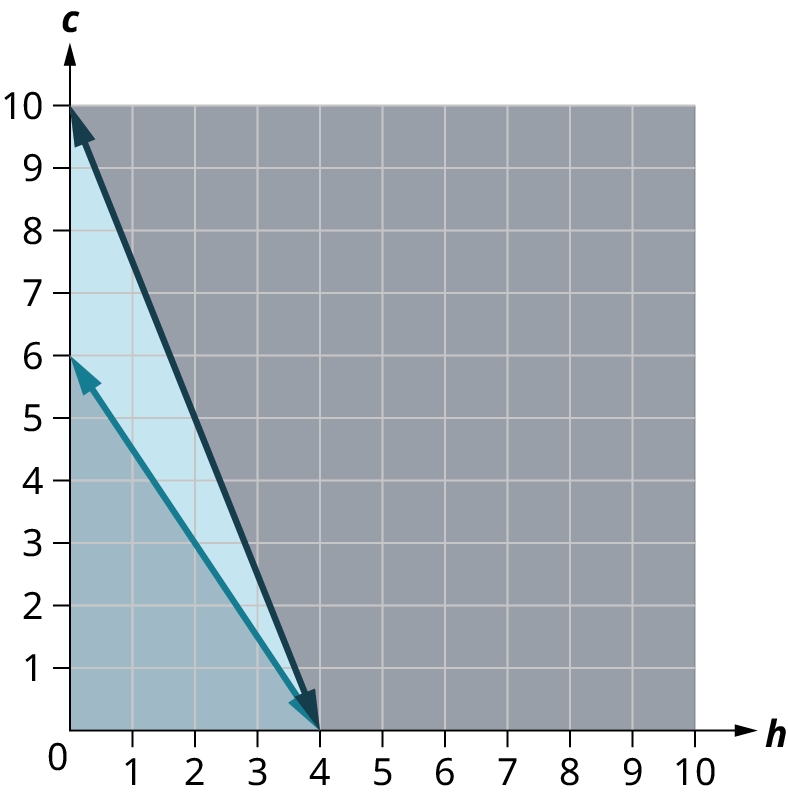
Two lines are plotted on a coordinate plane. The horizontal and vertical axes range from negative 0 to 10, in increments of 1. The first line passes through the points, (0, 10), (2, 5), and (4, 0). The region above the line is shaded in light gray. The second line passes through the points, (0, 6), (2, 3), and (4, 0). The region below the line is shaded in dark blue. The region within the lines is shaded light blue.Two lines are plotted on a coordinate plane. The horizontal and vertical axes range from negative 0 to 10, in increments of 1. The first line passes through the points, (0, 10), (2, 5), and (4, 0). The region above the line is shaded in light gray. The second line passes through the points, (0, 6), (2, 3), and (4, 0). The region below the line is shaded in dark blue. The region within the lines is shaded light blue.

Your Turn 5.95 (c) §5.10 source ↗

Omar needs to eat at least 800 calories before going to his team practice. All he wants is hamburgers and cookies, and he doesn’t want to spend more than $5. At the hamburger restaurant near his college, each hamburger has 240 calories and costs $1.40. Each cookie has 160 calories and costs $0.50.

Could he eat 3 hamburgers and 2 cookies?

Answer

Test (3, 2).

240 h + 160 c ≥ 800

240 ( 3 ) + 160 ( 2 ) ≥ 800

720 + 360 ≥ 800

1 , 080 ≥ 800 This is true. Test the second inequality.

1.4 h + 0.5 c ≤ 5

1.4 ( 3 ) + 0.5 ( 2 ) ≤ 5

4.2 + 1 ≤ 5

5.2 ≤ 5 This is false. The ordered pair is not a solution to the system.

He cannot eat 3 hamburgers and 2 cookies because they cost more than $5.00.

The point ( 3 , 2 ) is not in the solution region. Omar would not choose to eat 3 hamburgers and 2 cookies.

Your Turn 5.95 (d) §5.10 source ↗

Omar needs to eat at least 800 calories before going to his team practice. All he wants is hamburgers and cookies, and he doesn’t want to spend more than $5. At the hamburger restaurant near his college, each hamburger has 240 calories and costs $1.40. Each cookie has 160 calories and costs $0.50.

Could he eat 2 hamburgers and 4 cookies?

Answer

Test (2, 4).

240 h + 160 c ≥ 800

240 ( 2 ) + 160 ( 4 ) ≥ 800

480 + 640 ≥ 800

1 , 120 ≥ 800 This is true. Test the second inequality.

1.4 h + 0.5 c ≤ 5

1.4 ( 2 ) + 0.5 ( 4 ) ≤ 5

2.8 + 2 ≤ 5

4.8 ≤ 5 This is true. The ordered pair is a solution to the system.

Omar can eat 2 hamburgers and 4 cookies. They provide enough calories and cost less than $5.

The point ( 2 , 4 ) is in the solution region. Omar might choose to eat 2 hamburgers and 4 cookies.

Check Your Understanding 5.10.75 §5.10 source ↗

Match the correct graph to its system of inequalities.

{ 2 x + 3 y < 5 x − y > 3
  1. a.
    Two lines are plotted on a coordinate plane. The horizontal and vertical axes range from negative 10 to 9, in increments of 1. The first line passes through the points, (negative 9, 7.5), (0, 1.5), and (9, negative 4.5). The region below the line is shaded in dark blue. The second line passes through the points, (negative 6, 9), (0, 3), (3, 0), and (9, negative 6). The region above the line is shaded in grey. The two lines intersect at (4, negative 1). The region below the intersection point and within the lines is shaded in light blue.Two lines are plotted on a coordinate plane. The horizontal and vertical axes range from negative 10 to 9, in increments of 1. The first line passes through the points, (negative 9, 7.5), (0, 1.5), and (9, negative 4.5). The region below the line is shaded in dark blue. The second line passes through the points, (negative 6, 9), (0, 3), (3, 0), and (9, negative 6). The region above the line is shaded in grey. The two lines intersect at (4, negative 1). The region below the intersection point and within the lines is shaded in light blue.
  2. b.
    Two lines are plotted on a coordinate plane. The horizontal and vertical axes range from negative 10 to 9, in increments of 1. The first (dashed) line passes through the points, (negative 8, 7), (0, 1.5), (4, negative 1), and (9, negative 4.5). The region above the line is shaded in gray. The second (solid) line passes through the points, (negative 6, 9), (0, 3), (3, 0), and (9, negative 6). The region below the line is shaded in dark blue. The two lines intersect at (4, negative 1). The region above and to the left of the intersection point and within the lines is shaded in light blue. Note: all values are approximate.Two lines are plotted on a coordinate plane. The horizontal and vertical axes range from negative 10 to 9, in increments of 1. The first (dashed) line passes through the points, (negative 8, 7), (0, 1.5), (4, negative 1), and (9, negative 4.5). The region above the line is shaded in gray. The second (solid) line passes through the points, (negative 6, 9), (0, 3), (3, 0), and (9, negative 6). The region below the line is shaded in dark blue. The two lines intersect at (4, negative 1). The region above and to the left of the intersection point and within the lines is shaded in light blue. Note: all values are approximate.
  3. c.
    Two dashed lines are plotted on a coordinate plane. The horizontal and vertical axes range from negative 10 to 9, in increments of 1. The first line passes through the points, (negative 8, 7), (0, 1.5), (4, negative ), and (9, negative 4.5). The region above the line is shaded in dark blue. The second line passes through the points, (negative 6, negative 9), (0, negative 3), (3, 0), and (9, 6). The region above the line is shaded in light blue. The two lines intersect at (2.8, negative 0.2). The region above the intersection point and within the lines is shaded in gray. Note: all values are approximate.Two dashed lines are plotted on a coordinate plane. The horizontal and vertical axes range from negative 10 to 9, in increments of 1. The first line passes through the points, (negative 8, 7), (0, 1.5), (4, negative ), and (9, negative 4.5). The region above the line is shaded in dark blue. The second line passes through the points, (negative 6, negative 9), (0, negative 3), (3, 0), and (9, 6). The region above the line is shaded in light blue. The two lines intersect at (2.8, negative 0.2). The region above the intersection point and within the lines is shaded in gray. Note: all values are approximate.
  4. d.
    Two dashed lines are plotted on a coordinate plane. The horizontal and vertical axes range from negative 10 to 9, in increments of 1. The first line passes through the points, (negative 6, 9), (0, 3) (3, 0), and (9, negative 6). The region to the left of the line is shaded in dark blue. The second line passes through the points, (negative 8, negative 7), (0, negative 1.5), (2.5, 0), and (10, 5). The region below the line is shaded in gray. The two lines intersect at (2.8, 0.2). The region below the intersection point and within the lines is shaded in light blue. Note: all values are approximate.Two dashed lines are plotted on a coordinate plane. The horizontal and vertical axes range from negative 10 to 9, in increments of 1. The first line passes through the points, (negative 6, 9), (0, 3) (3, 0), and (9, negative 6). The region to the left of the line is shaded in dark blue. The second line passes through the points, (negative 8, negative 7), (0, negative 1.5), (2.5, 0), and (10, 5). The region below the line is shaded in gray. The two lines intersect at (2.8, 0.2). The region below the intersection point and within the lines is shaded in light blue. Note: all values are approximate.
  5. e.
    Two lines are plotted on a coordinate plane. The horizontal and vertical axes range from negative 10 to 9, in increments of 1. The first line passes through the points, (negative 9, negative 7), (0, negative 1.5), and (10, 5). The region above the line is shaded in gray. The second line passes through the points, (negative 6, negative 9), (0, negative 3), (3, 0), and (10, 7). The region below the line is shaded in dark blue. The two lines intersect at (4, 1). The region to the right of the intersection point and within the lines is shaded in light blue. Note: all values are approximate.Two lines are plotted on a coordinate plane. The horizontal and vertical axes range from negative 10 to 9, in increments of 1. The first line passes through the points, (negative 9, negative 7), (0, negative 1.5), and (10, 5). The region above the line is shaded in gray. The second line passes through the points, (negative 6, negative 9), (0, negative 3), (3, 0), and (10, 7). The region below the line is shaded in dark blue. The two lines intersect at (4, 1). The region to the right of the intersection point and within the lines is shaded in light blue. Note: all values are approximate.

Answer

C. Two dashed lines are plotted on a coordinate plane. The horizontal and vertical axes range from negative 10 to 9, in increments of 1. The first line passes through the points, (negative 8, 7), (0, 1.5), (4, negative ), and (9, negative 4.5). The region above the line is shaded in dark blue. The second line passes through the points, (negative 6, negative 9), (0, negative 3), (3, 0), and (9, 6). The region above the line is shaded in light blue. The two lines intersect at (2.8, negative 0.2). The region above the intersection point and within the lines is shaded in gray. Note: all values are approximate.Two dashed lines are plotted on a coordinate plane. The horizontal and vertical axes range from negative 10 to 9, in increments of 1. The first line passes through the points, (negative 8, 7), (0, 1.5), (4, negative ), and (9, negative 4.5). The region above the line is shaded in dark blue. The second line passes through the points, (negative 6, negative 9), (0, negative 3), (3, 0), and (9, 6). The region above the line is shaded in light blue. The two lines intersect at (2.8, negative 0.2). The region above the intersection point and within the lines is shaded in gray. Note: all values are approximate.

Check Your Understanding 5.10.76 §5.10 source ↗

Match the correct graph to its system of inequalities.

{ 2 x − 3 y ≤ 5 x − y ≥ 3
  1. a.
    Two lines are plotted on a coordinate plane. The horizontal and vertical axes range from negative 10 to 9, in increments of 1. The first line passes through the points, (negative 9, 7.5), (0, 1.5), and (9, negative 4.5). The region below the line is shaded in dark blue. The second line passes through the points, (negative 6, 9), (0, 3), (3, 0), and (9, negative 6). The region above the line is shaded in grey. The two lines intersect at (4, negative 1). The region below the intersection point and within the lines is shaded in light blue.Two lines are plotted on a coordinate plane. The horizontal and vertical axes range from negative 10 to 9, in increments of 1. The first line passes through the points, (negative 9, 7.5), (0, 1.5), and (9, negative 4.5). The region below the line is shaded in dark blue. The second line passes through the points, (negative 6, 9), (0, 3), (3, 0), and (9, negative 6). The region above the line is shaded in grey. The two lines intersect at (4, negative 1). The region below the intersection point and within the lines is shaded in light blue.
  2. b.
    Two lines are plotted on a coordinate plane. The horizontal and vertical axes range from negative 10 to 9, in increments of 1. The first (dashed) line passes through the points, (negative 8, 7), (0, 1.5), (4, negative 1), and (9, negative 4.5). The region above the line is shaded in gray. The second (solid) line passes through the points, (negative 6, 9), (0, 3), (3, 0), and (9, negative 6). The region below the line is shaded in dark blue. The two lines intersect at (4, negative 1). The region above and to the left of the intersection point and within the lines is shaded in light blue. Note: all values are approximate.Two lines are plotted on a coordinate plane. The horizontal and vertical axes range from negative 10 to 9, in increments of 1. The first (dashed) line passes through the points, (negative 8, 7), (0, 1.5), (4, negative 1), and (9, negative 4.5). The region above the line is shaded in gray. The second (solid) line passes through the points, (negative 6, 9), (0, 3), (3, 0), and (9, negative 6). The region below the line is shaded in dark blue. The two lines intersect at (4, negative 1). The region above and to the left of the intersection point and within the lines is shaded in light blue. Note: all values are approximate.
  3. c.
    Two dashed lines are plotted on a coordinate plane. The horizontal and vertical axes range from negative 10 to 9, in increments of 1. The first line passes through the points, (negative 8, 7), (0, 1.5), (4, negative ), and (9, negative 4.5). The region above the line is shaded in dark blue. The second line passes through the points, (negative 6, negative 9), (0, negative 3), (3, 0), and (9, 6). The region above the line is shaded in light blue. The two lines intersect at (2.8, negative 0.2). The region above the intersection point and within the lines is shaded in gray. Note: all values are approximate.Two dashed lines are plotted on a coordinate plane. The horizontal and vertical axes range from negative 10 to 9, in increments of 1. The first line passes through the points, (negative 8, 7), (0, 1.5), (4, negative ), and (9, negative 4.5). The region above the line is shaded in dark blue. The second line passes through the points, (negative 6, negative 9), (0, negative 3), (3, 0), and (9, 6). The region above the line is shaded in light blue. The two lines intersect at (2.8, negative 0.2). The region above the intersection point and within the lines is shaded in gray. Note: all values are approximate.
  4. d.
    Two dashed lines are plotted on a coordinate plane. The horizontal and vertical axes range from negative 10 to 9, in increments of 1. The first line passes through the points, (negative 6, 9), (0, 3) (3, 0), and (9, negative 6). The region to the left of the line is shaded in dark blue. The second line passes through the points, (negative 8, negative 7), (0, negative 1.5), (2.5, 0), and (10, 5). The region below the line is shaded in gray. The two lines intersect at (2.8, 0.2). The region below the intersection point and within the lines is shaded in light blue. Note: all values are approximate.Two dashed lines are plotted on a coordinate plane. The horizontal and vertical axes range from negative 10 to 9, in increments of 1. The first line passes through the points, (negative 6, 9), (0, 3) (3, 0), and (9, negative 6). The region to the left of the line is shaded in dark blue. The second line passes through the points, (negative 8, negative 7), (0, negative 1.5), (2.5, 0), and (10, 5). The region below the line is shaded in gray. The two lines intersect at (2.8, 0.2). The region below the intersection point and within the lines is shaded in light blue. Note: all values are approximate.
  5. e.
    Two lines are plotted on a coordinate plane. The horizontal and vertical axes range from negative 10 to 9, in increments of 1. The first line passes through the points, (negative 9, negative 7), (0, negative 1.5), and (10, 5). The region above the line is shaded in gray. The second line passes through the points, (negative 6, negative 9), (0, negative 3), (3, 0), and (10, 7). The region below the line is shaded in dark blue. The two lines intersect at (4, 1). The region to the right of the intersection point and within the lines is shaded in light blue. Note: all values are approximate.Two lines are plotted on a coordinate plane. The horizontal and vertical axes range from negative 10 to 9, in increments of 1. The first line passes through the points, (negative 9, negative 7), (0, negative 1.5), and (10, 5). The region above the line is shaded in gray. The second line passes through the points, (negative 6, negative 9), (0, negative 3), (3, 0), and (10, 7). The region below the line is shaded in dark blue. The two lines intersect at (4, 1). The region to the right of the intersection point and within the lines is shaded in light blue. Note: all values are approximate.

Answer

E. Two lines are plotted on a coordinate plane. The horizontal and vertical axes range from negative 10 to 9, in increments of 1. The first line passes through the points, (negative 9, negative 7), (0, negative 1.5), and (10, 5). The region above the line is shaded in gray. The second line passes through the points, (negative 6, negative 9), (0, negative 3), (3, 0), and (10, 7). The region below the line is shaded in dark blue. The two lines intersect at (4, 1). The region to the right of the intersection point and within the lines is shaded in light blue. Note: all values are approximate.Two lines are plotted on a coordinate plane. The horizontal and vertical axes range from negative 10 to 9, in increments of 1. The first line passes through the points, (negative 9, negative 7), (0, negative 1.5), and (10, 5). The region above the line is shaded in gray. The second line passes through the points, (negative 6, negative 9), (0, negative 3), (3, 0), and (10, 7). The region below the line is shaded in dark blue. The two lines intersect at (4, 1). The region to the right of the intersection point and within the lines is shaded in light blue. Note: all values are approximate.
e

Graph the system, then identify which graph matches what you drew.

2 x − 3 y ≤ 5 Graph the first line as a solid line using the intercepts ( 5 2 , 0 ) and ( 0 , − 5 3 ) .

Test (0, 0).

2 ( 0 ) + 3 ( 0 ) ≤ 5

0 ≤ 5 This is true. Shade lightly the side where (0, 0) is located.

Second line: x − y ≥ 3 .

Graph the second line as a solid line using the intercepts ( 3 , 0 ) and ( 0 , − 3 ) .

Test (0, 0).

0 − 0 ≥ 3 This is false. Shade lightly the side where (0, 0) is not located.

The solution is the region shaded by both graphs.

Check Your Understanding 5.10.77 §5.10 source ↗

Match the correct graph to its system of inequalities.

{ 2 x − 3 y > 5 x + y < 3
  1. a.
    Two lines are plotted on a coordinate plane. The horizontal and vertical axes range from negative 10 to 9, in increments of 1. The first line passes through the points, (negative 9, 7.5), (0, 1.5), and (9, negative 4.5). The region below the line is shaded in dark blue. The second line passes through the points, (negative 6, 9), (0, 3), (3, 0), and (9, negative 6). The region above the line is shaded in grey. The two lines intersect at (4, negative 1). The region below the intersection point and within the lines is shaded in light blue.Two lines are plotted on a coordinate plane. The horizontal and vertical axes range from negative 10 to 9, in increments of 1. The first line passes through the points, (negative 9, 7.5), (0, 1.5), and (9, negative 4.5). The region below the line is shaded in dark blue. The second line passes through the points, (negative 6, 9), (0, 3), (3, 0), and (9, negative 6). The region above the line is shaded in grey. The two lines intersect at (4, negative 1). The region below the intersection point and within the lines is shaded in light blue.
  2. b.
    Two lines are plotted on a coordinate plane. The horizontal and vertical axes range from negative 10 to 9, in increments of 1. The first (dashed) line passes through the points, (negative 8, 7), (0, 1.5), (4, negative 1), and (9, negative 4.5). The region above the line is shaded in gray. The second (solid) line passes through the points, (negative 6, 9), (0, 3), (3, 0), and (9, negative 6). The region below the line is shaded in dark blue. The two lines intersect at (4, negative 1). The region above and to the left of the intersection point and within the lines is shaded in light blue. Note: all values are approximate.Two lines are plotted on a coordinate plane. The horizontal and vertical axes range from negative 10 to 9, in increments of 1. The first (dashed) line passes through the points, (negative 8, 7), (0, 1.5), (4, negative 1), and (9, negative 4.5). The region above the line is shaded in gray. The second (solid) line passes through the points, (negative 6, 9), (0, 3), (3, 0), and (9, negative 6). The region below the line is shaded in dark blue. The two lines intersect at (4, negative 1). The region above and to the left of the intersection point and within the lines is shaded in light blue. Note: all values are approximate.
  3. c.
    Two dashed lines are plotted on a coordinate plane. The horizontal and vertical axes range from negative 10 to 9, in increments of 1. The first line passes through the points, (negative 8, 7), (0, 1.5), (4, negative ), and (9, negative 4.5). The region above the line is shaded in dark blue. The second line passes through the points, (negative 6, negative 9), (0, negative 3), (3, 0), and (9, 6). The region above the line is shaded in light blue. The two lines intersect at (2.8, negative 0.2). The region above the intersection point and within the lines is shaded in gray. Note: all values are approximate.Two dashed lines are plotted on a coordinate plane. The horizontal and vertical axes range from negative 10 to 9, in increments of 1. The first line passes through the points, (negative 8, 7), (0, 1.5), (4, negative ), and (9, negative 4.5). The region above the line is shaded in dark blue. The second line passes through the points, (negative 6, negative 9), (0, negative 3), (3, 0), and (9, 6). The region above the line is shaded in light blue. The two lines intersect at (2.8, negative 0.2). The region above the intersection point and within the lines is shaded in gray. Note: all values are approximate.
  4. d.
    Two dashed lines are plotted on a coordinate plane. The horizontal and vertical axes range from negative 10 to 9, in increments of 1. The first line passes through the points, (negative 6, 9), (0, 3) (3, 0), and (9, negative 6). The region to the left of the line is shaded in dark blue. The second line passes through the points, (negative 8, negative 7), (0, negative 1.5), (2.5, 0), and (10, 5). The region below the line is shaded in gray. The two lines intersect at (2.8, 0.2). The region below the intersection point and within the lines is shaded in light blue. Note: all values are approximate.Two dashed lines are plotted on a coordinate plane. The horizontal and vertical axes range from negative 10 to 9, in increments of 1. The first line passes through the points, (negative 6, 9), (0, 3) (3, 0), and (9, negative 6). The region to the left of the line is shaded in dark blue. The second line passes through the points, (negative 8, negative 7), (0, negative 1.5), (2.5, 0), and (10, 5). The region below the line is shaded in gray. The two lines intersect at (2.8, 0.2). The region below the intersection point and within the lines is shaded in light blue. Note: all values are approximate.
  5. e.
    Two lines are plotted on a coordinate plane. The horizontal and vertical axes range from negative 10 to 9, in increments of 1. The first line passes through the points, (negative 9, negative 7), (0, negative 1.5), and (10, 5). The region above the line is shaded in gray. The second line passes through the points, (negative 6, negative 9), (0, negative 3), (3, 0), and (10, 7). The region below the line is shaded in dark blue. The two lines intersect at (4, 1). The region to the right of the intersection point and within the lines is shaded in light blue. Note: all values are approximate.Two lines are plotted on a coordinate plane. The horizontal and vertical axes range from negative 10 to 9, in increments of 1. The first line passes through the points, (negative 9, negative 7), (0, negative 1.5), and (10, 5). The region above the line is shaded in gray. The second line passes through the points, (negative 6, negative 9), (0, negative 3), (3, 0), and (10, 7). The region below the line is shaded in dark blue. The two lines intersect at (4, 1). The region to the right of the intersection point and within the lines is shaded in light blue. Note: all values are approximate.

Answer

D. Two dashed lines are plotted on a coordinate plane. The horizontal and vertical axes range from negative 10 to 9, in increments of 1. The first line passes through the points, (negative 6, 9), (0, 3) (3, 0), and (9, negative 6). The region to the left of the line is shaded in dark blue. The second line passes through the points, (negative 8, negative 7), (0, negative 1.5), (2.5, 0), and (10, 5). The region below the line is shaded in gray. The two lines intersect at (2.8, 0.2). The region below the intersection point and within the lines is shaded in light blue. Note: all values are approximate.Two dashed lines are plotted on a coordinate plane. The horizontal and vertical axes range from negative 10 to 9, in increments of 1. The first line passes through the points, (negative 6, 9), (0, 3) (3, 0), and (9, negative 6). The region to the left of the line is shaded in dark blue. The second line passes through the points, (negative 8, negative 7), (0, negative 1.5), (2.5, 0), and (10, 5). The region below the line is shaded in gray. The two lines intersect at (2.8, 0.2). The region below the intersection point and within the lines is shaded in light blue. Note: all values are approximate.
d

Graph the system, then identify which graph matches what you drew.

2 x − 3 y > 5 Graph the first line as a dotted line using the intercepts ( 5 2 , 0 ) and ( 0 , − 5 3 ) .

Test (0, 0).

2 ( 0 ) − 3 ( 0 ) > 5

0 > 5 This is false. Shade lightly the opposite side of where (0, 0) is located.

Second line: x + y < 3 .

Graph the second line as a dotted line using the intercepts ( 3 , 0 ) and ( 0 , 3 ) .

Test (0, 0).

0 − 0 < 3 This is true. Shade lightly the side where (0, 0) is located.

The solution is the region shaded by both graphs.

Check Your Understanding 5.10.78 §5.10 source ↗

Match the correct graph to its system of inequalities.

{ 2 x + 3 y > 5 x + y ≤ 3
  1. a.
    Two lines are plotted on a coordinate plane. The horizontal and vertical axes range from negative 10 to 9, in increments of 1. The first line passes through the points, (negative 9, 7.5), (0, 1.5), and (9, negative 4.5). The region below the line is shaded in dark blue. The second line passes through the points, (negative 6, 9), (0, 3), (3, 0), and (9, negative 6). The region above the line is shaded in grey. The two lines intersect at (4, negative 1). The region below the intersection point and within the lines is shaded in light blue.Two lines are plotted on a coordinate plane. The horizontal and vertical axes range from negative 10 to 9, in increments of 1. The first line passes through the points, (negative 9, 7.5), (0, 1.5), and (9, negative 4.5). The region below the line is shaded in dark blue. The second line passes through the points, (negative 6, 9), (0, 3), (3, 0), and (9, negative 6). The region above the line is shaded in grey. The two lines intersect at (4, negative 1). The region below the intersection point and within the lines is shaded in light blue.
  2. b.
    Two lines are plotted on a coordinate plane. The horizontal and vertical axes range from negative 10 to 9, in increments of 1. The first (dashed) line passes through the points, (negative 8, 7), (0, 1.5), (4, negative 1), and (9, negative 4.5). The region above the line is shaded in gray. The second (solid) line passes through the points, (negative 6, 9), (0, 3), (3, 0), and (9, negative 6). The region below the line is shaded in dark blue. The two lines intersect at (4, negative 1). The region above and to the left of the intersection point and within the lines is shaded in light blue. Note: all values are approximate.Two lines are plotted on a coordinate plane. The horizontal and vertical axes range from negative 10 to 9, in increments of 1. The first (dashed) line passes through the points, (negative 8, 7), (0, 1.5), (4, negative 1), and (9, negative 4.5). The region above the line is shaded in gray. The second (solid) line passes through the points, (negative 6, 9), (0, 3), (3, 0), and (9, negative 6). The region below the line is shaded in dark blue. The two lines intersect at (4, negative 1). The region above and to the left of the intersection point and within the lines is shaded in light blue. Note: all values are approximate.
  3. c.
    Two dashed lines are plotted on a coordinate plane. The horizontal and vertical axes range from negative 10 to 9, in increments of 1. The first line passes through the points, (negative 8, 7), (0, 1.5), (4, negative ), and (9, negative 4.5). The region above the line is shaded in dark blue. The second line passes through the points, (negative 6, negative 9), (0, negative 3), (3, 0), and (9, 6). The region above the line is shaded in light blue. The two lines intersect at (2.8, negative 0.2). The region above the intersection point and within the lines is shaded in gray. Note: all values are approximate.Two dashed lines are plotted on a coordinate plane. The horizontal and vertical axes range from negative 10 to 9, in increments of 1. The first line passes through the points, (negative 8, 7), (0, 1.5), (4, negative ), and (9, negative 4.5). The region above the line is shaded in dark blue. The second line passes through the points, (negative 6, negative 9), (0, negative 3), (3, 0), and (9, 6). The region above the line is shaded in light blue. The two lines intersect at (2.8, negative 0.2). The region above the intersection point and within the lines is shaded in gray. Note: all values are approximate.
  4. d.
    Two dashed lines are plotted on a coordinate plane. The horizontal and vertical axes range from negative 10 to 9, in increments of 1. The first line passes through the points, (negative 6, 9), (0, 3) (3, 0), and (9, negative 6). The region to the left of the line is shaded in dark blue. The second line passes through the points, (negative 8, negative 7), (0, negative 1.5), (2.5, 0), and (10, 5). The region below the line is shaded in gray. The two lines intersect at (2.8, 0.2). The region below the intersection point and within the lines is shaded in light blue. Note: all values are approximate.Two dashed lines are plotted on a coordinate plane. The horizontal and vertical axes range from negative 10 to 9, in increments of 1. The first line passes through the points, (negative 6, 9), (0, 3) (3, 0), and (9, negative 6). The region to the left of the line is shaded in dark blue. The second line passes through the points, (negative 8, negative 7), (0, negative 1.5), (2.5, 0), and (10, 5). The region below the line is shaded in gray. The two lines intersect at (2.8, 0.2). The region below the intersection point and within the lines is shaded in light blue. Note: all values are approximate.
  5. e.
    Two lines are plotted on a coordinate plane. The horizontal and vertical axes range from negative 10 to 9, in increments of 1. The first line passes through the points, (negative 9, negative 7), (0, negative 1.5), and (10, 5). The region above the line is shaded in gray. The second line passes through the points, (negative 6, negative 9), (0, negative 3), (3, 0), and (10, 7). The region below the line is shaded in dark blue. The two lines intersect at (4, 1). The region to the right of the intersection point and within the lines is shaded in light blue. Note: all values are approximate.Two lines are plotted on a coordinate plane. The horizontal and vertical axes range from negative 10 to 9, in increments of 1. The first line passes through the points, (negative 9, negative 7), (0, negative 1.5), and (10, 5). The region above the line is shaded in gray. The second line passes through the points, (negative 6, negative 9), (0, negative 3), (3, 0), and (10, 7). The region below the line is shaded in dark blue. The two lines intersect at (4, 1). The region to the right of the intersection point and within the lines is shaded in light blue. Note: all values are approximate.

Answer

B. Two lines are plotted on a coordinate plane. The horizontal and vertical axes range from negative 10 to 9, in increments of 1. The first (dashed) line passes through the points, (negative 8, 7), (0, 1.5), (4, negative 1), and (9, negative 4.5). The region above the line is shaded in gray. The second (solid) line passes through the points, (negative 6, 9), (0, 3), (3, 0), and (9, negative 6). The region below the line is shaded in dark blue. The two lines intersect at (4, negative 1). The region above and to the left of the intersection point and within the lines is shaded in light blue. Note: all values are approximate.Two lines are plotted on a coordinate plane. The horizontal and vertical axes range from negative 10 to 9, in increments of 1. The first (dashed) line passes through the points, (negative 8, 7), (0, 1.5), (4, negative 1), and (9, negative 4.5). The region above the line is shaded in gray. The second (solid) line passes through the points, (negative 6, 9), (0, 3), (3, 0), and (9, negative 6). The region below the line is shaded in dark blue. The two lines intersect at (4, negative 1). The region above and to the left of the intersection point and within the lines is shaded in light blue. Note: all values are approximate.
b

Graph the system, then identify which graph matches what you drew.

2 x + 3 y > 5 Graph the first line as a dotted line using the intercepts ( 5 2 , 0 ) and ( 0 , 5 3 ) .

Test (0, 0).

2 ( 0 ) + 3 ( 0 ) > 5

0 > 5 This is false. Shade lightly the opposite side of where (0, 0) is located.

Second line: x + y ≤ 3 .

Graph the second line as a solid line using the intercepts ( 3 , 0 ) and ( 0 , 3 ) .

Test (0, 0).

0 − 0 ≤ 3 This is true. Shade lightly the side where (0, 0) is located.

The solution is the region shaded by both graphs.

Check Your Understanding 5.10.79 §5.10 source ↗

Match the correct graph to its system of inequalities.

{ 2 x + 3 y ≤ 5 x + y ≥ 3
  1. a.
    Two lines are plotted on a coordinate plane. The horizontal and vertical axes range from negative 10 to 9, in increments of 1. The first line passes through the points, (negative 9, 7.5), (0, 1.5), and (9, negative 4.5). The region below the line is shaded in dark blue. The second line passes through the points, (negative 6, 9), (0, 3), (3, 0), and (9, negative 6). The region above the line is shaded in grey. The two lines intersect at (4, negative 1). The region below the intersection point and within the lines is shaded in light blue.Two lines are plotted on a coordinate plane. The horizontal and vertical axes range from negative 10 to 9, in increments of 1. The first line passes through the points, (negative 9, 7.5), (0, 1.5), and (9, negative 4.5). The region below the line is shaded in dark blue. The second line passes through the points, (negative 6, 9), (0, 3), (3, 0), and (9, negative 6). The region above the line is shaded in grey. The two lines intersect at (4, negative 1). The region below the intersection point and within the lines is shaded in light blue.
  2. b.
    Two lines are plotted on a coordinate plane. The horizontal and vertical axes range from negative 10 to 9, in increments of 1. The first (dashed) line passes through the points, (negative 8, 7), (0, 1.5), (4, negative 1), and (9, negative 4.5). The region above the line is shaded in gray. The second (solid) line passes through the points, (negative 6, 9), (0, 3), (3, 0), and (9, negative 6). The region below the line is shaded in dark blue. The two lines intersect at (4, negative 1). The region above and to the left of the intersection point and within the lines is shaded in light blue. Note: all values are approximate.Two lines are plotted on a coordinate plane. The horizontal and vertical axes range from negative 10 to 9, in increments of 1. The first (dashed) line passes through the points, (negative 8, 7), (0, 1.5), (4, negative 1), and (9, negative 4.5). The region above the line is shaded in gray. The second (solid) line passes through the points, (negative 6, 9), (0, 3), (3, 0), and (9, negative 6). The region below the line is shaded in dark blue. The two lines intersect at (4, negative 1). The region above and to the left of the intersection point and within the lines is shaded in light blue. Note: all values are approximate.
  3. c.
    Two dashed lines are plotted on a coordinate plane. The horizontal and vertical axes range from negative 10 to 9, in increments of 1. The first line passes through the points, (negative 8, 7), (0, 1.5), (4, negative ), and (9, negative 4.5). The region above the line is shaded in dark blue. The second line passes through the points, (negative 6, negative 9), (0, negative 3), (3, 0), and (9, 6). The region above the line is shaded in light blue. The two lines intersect at (2.8, negative 0.2). The region above the intersection point and within the lines is shaded in gray. Note: all values are approximate.Two dashed lines are plotted on a coordinate plane. The horizontal and vertical axes range from negative 10 to 9, in increments of 1. The first line passes through the points, (negative 8, 7), (0, 1.5), (4, negative ), and (9, negative 4.5). The region above the line is shaded in dark blue. The second line passes through the points, (negative 6, negative 9), (0, negative 3), (3, 0), and (9, 6). The region above the line is shaded in light blue. The two lines intersect at (2.8, negative 0.2). The region above the intersection point and within the lines is shaded in gray. Note: all values are approximate.
  4. d.
    Two dashed lines are plotted on a coordinate plane. The horizontal and vertical axes range from negative 10 to 9, in increments of 1. The first line passes through the points, (negative 6, 9), (0, 3) (3, 0), and (9, negative 6). The region to the left of the line is shaded in dark blue. The second line passes through the points, (negative 8, negative 7), (0, negative 1.5), (2.5, 0), and (10, 5). The region below the line is shaded in gray. The two lines intersect at (2.8, 0.2). The region below the intersection point and within the lines is shaded in light blue. Note: all values are approximate.Two dashed lines are plotted on a coordinate plane. The horizontal and vertical axes range from negative 10 to 9, in increments of 1. The first line passes through the points, (negative 6, 9), (0, 3) (3, 0), and (9, negative 6). The region to the left of the line is shaded in dark blue. The second line passes through the points, (negative 8, negative 7), (0, negative 1.5), (2.5, 0), and (10, 5). The region below the line is shaded in gray. The two lines intersect at (2.8, 0.2). The region below the intersection point and within the lines is shaded in light blue. Note: all values are approximate.
  5. e.
    Two lines are plotted on a coordinate plane. The horizontal and vertical axes range from negative 10 to 9, in increments of 1. The first line passes through the points, (negative 9, negative 7), (0, negative 1.5), and (10, 5). The region above the line is shaded in gray. The second line passes through the points, (negative 6, negative 9), (0, negative 3), (3, 0), and (10, 7). The region below the line is shaded in dark blue. The two lines intersect at (4, 1). The region to the right of the intersection point and within the lines is shaded in light blue. Note: all values are approximate.Two lines are plotted on a coordinate plane. The horizontal and vertical axes range from negative 10 to 9, in increments of 1. The first line passes through the points, (negative 9, negative 7), (0, negative 1.5), and (10, 5). The region above the line is shaded in gray. The second line passes through the points, (negative 6, negative 9), (0, negative 3), (3, 0), and (10, 7). The region below the line is shaded in dark blue. The two lines intersect at (4, 1). The region to the right of the intersection point and within the lines is shaded in light blue. Note: all values are approximate.

Answer

A. Two lines are plotted on a coordinate plane. The horizontal and vertical axes range from negative 10 to 9, in increments of 1. The first line passes through the points, (negative 9, 7.5), (0, 1.5), and (9, negative 4.5). The region below the line is shaded in dark blue. The second line passes through the points, (negative 6, 9), (0, 3), (3, 0), and (9, negative 6). The region above the line is shaded in grey. The two lines intersect at (4, negative 1). The region below the intersection point and within the lines is shaded in light blue.Two lines are plotted on a coordinate plane. The horizontal and vertical axes range from negative 10 to 9, in increments of 1. The first line passes through the points, (negative 9, 7.5), (0, 1.5), and (9, negative 4.5). The region below the line is shaded in dark blue. The second line passes through the points, (negative 6, 9), (0, 3), (3, 0), and (9, negative 6). The region above the line is shaded in grey. The two lines intersect at (4, negative 1). The region below the intersection point and within the lines is shaded in light blue.
a

Graph the system, then identify which graph matches what you drew.

2 x + 3 y ≤ 5 Graph the first line as a solid line using the intercepts ( 5 2 , 0 ) and ( 0 , 5 3 ) .

Test (0, 0).

2 ( 0 ) + 3 ( 0 ) ≤ 5

0 ≤ 5 This is true. Shade lightly the side where (0, 0) is located.

Second line: x + y ≥ 3 .

Graph the second line as a solid line using the intercepts ( 3 , 0 ) and ( 0 , 3 ) .

Test (0, 0).

0 + 0 ≥ 3 This is false. Shade lightly the side where (0, 0) is not located.

The solution is the region shaded by both graphs.

Your Turn 5.96 §5.11 source ↗

For a fundraiser at school, the Robotics Club is selling bags of apples and bunches of bananas during lunch. They will make a profit of $4 per bag of apples and $6 per bunch of bananas. Write an objective function that describes the profit the Robotics Club will make.

Answer

Let a = the number of bags of apples.

Let b = the number of bunches of bananas.

The profit on apples is $4 per bag and the profit on bananas is $6 per bunch.

Break the words into components.

The total profit is $4 times the number of bags of apples plus $6 times the number of bunches of bananas.
P = 4a + 6b

P = 4 a + 6 b

With a = the number of bags of apples sold, and b = the number of bunches of bananas sold, the objective function is P = 4 a + 6 b .

Your Turn 5.97 §5.11 source ↗

Suppose William has a second factory that can make widgets in 20 minutes and wadgets in 28 minutes. Write an objective function that describes the time it takes to make the products.

Answer

Let x = the number of widgets.

Let y = the number of wadgets

It takes 20 minutes to make a widget and 28 minutes to make a wadget.

Break the words into components.

The total time is the time to make widgets plus the time to make wadgets
T = 20x + 28y

T = 20 x + 28 y

T = 20 x + 28 y

Your Turn 5.98 §5.11 source ↗

For a fundraiser at school, the Robotics Club is selling bags of apples and bunches of bananas during lunch. They will make a profit of $4 per bag of apples and $6 per bunch of bananas. Due to school health regulations, the club is allowed to have only 20 bags and bunches of fruit on school grounds each day to sell. Another regulation: the container where the Robotics Club keeps the fruit has a maximum weight capacity of 70 pounds. Each bag of apples weighs 3 pounds, while each bunch of bananas weighs 5 pounds. Write the inequalities that represent these constraints. Then summarize the equations that represent this system.

Answer

Let a = the number of bags of apples.

Let b = the number of bunches of bananas.

The profit on apples is $4 per bag and the profit on bananas is $6 per bunch.

Constraints:

• No more than a total of 20 bags and bunches on school grounds each day.

• The maximum weight capacity of the fruit is 70 pounds.
A bag of apples weighs 3 pounds.
A bunch of bananas weighs 5 pounds.

Break the words into components.

The total profit is $4 times the number of bags of apples plus $6 times the number of bunches of bananas.
P = 4a + 6b

P = 4 a + 6 b

The number of bags of apples plus The number of bunches of bananas can be no more than 20
a + b ≤ 20

a + b ≤ 20

The number of bags of apples times 3 pounds plus The number of bunches of bananas times 5 pounds can be no more than 70 pounds
3a + 5b ≤ 70

3 a + 5 b ≤ 70

The summary of this system:

Objective function: P = 4 a + 6 b

Constraints:

a + b ≤ 20

3 a + 5 b ≤ 70

The constraints are a + b ≤ 20 and 3 a + 5 b ≤ 70 . The summary is: P = 4 a + 6 b , a + b ≤ 20 , and 3 a + 5 b ≤ 70 .

Your Turn 5.99 §5.11 source ↗

Suppose a second factory can make widgets in 20 minutes and wadgets in 28 minutes. Research for this factory indicates that long-term demand for products from this second factory will result in average sales of 15 widgets per day and 13 wadgets per day. Because of limitations on storage at his factory, no more than 22 widgets or 19 wadgets can be made each day. Write the inequalities that represent the constraints. Then summarize what has been described thus far by writing the objective function for time and the two constraints.

Answer

The constraints are:
15 ≤ x ≤ 22
13 ≤ y ≤ 19
So the system is:
T = 20 x + 28 y
15 ≤ x ≤ 22
13 ≤ y ≤ 19

Your Turn 5.100 §5.11 source ↗

For a fundraiser at school, the Robotics Club is selling bags of apples and bunches of bananas during lunch. They will make a profit of $4 per bag of apples and $6 per bunch of bananas. Due to school health regulations, the club is allowed to have only 20 bags and bunches of fruit on school grounds each day to sell. Another regulation: the container where the Robotics Club keeps the fruit has a maximum weight capacity of 70 pounds. Each bag of apples weighs 3 pounds, while each bunch of bananas weighs 5 pounds. Determine the number of bags of apples and the number of bags of bananas the Robotics Club should sell each day to maximize their profit.

Answer

The maximum value for the profit P occurs when x = 15 and y = 5 . This means that to maximize their profit, the Robotics Club should sell 15 bags of apples and 5 bunches of bananas every day.

Let a = the number of bags of apples.

Let b = the number of bunches of bananas.

The profit on apples is $4 per bag and the profit on bananas is $6 per bunch.

Constraints:

• No more than a total of 20 bags and bunches on school grounds each day.

• The maximum weight capacity of the fruit is 70 pounds.
A bag of apples weighs 3 pounds.
A bunch of bananas weighs 5 pounds.

Break the words into components.

The total profit is $4 times the number of bags of apples plus $6 times the number of bunches of bananas.
P = 4a + 6b

P = 4 a + 6 b

The number of bags of apples plus The number of bunches of bananas can be no more than 20
a + b ≤ 20

a + b ≤ 20

The number of bags of apples times 3 pounds plus The number of bunches of bananas times 5 pounds can be no more than 70 pounds
3a + 5b ≤ 70
3 a + 5 b ≤ 70

The summary of this system:

P = 4 a + 6 b

a + b ≤ 20

3 a + 5 b ≤ 70

Solve the system.

P = 4 a + 6 b

Assume the normal x-axis is the a-axis and the y-axis is the b-axis.

The maximum occurs at one of the corner points.

Graph the system.

a + b ≤ 20

The boundary of this graph intersects the axes at ( 20 , 0 ) and ( 0 , 20 ) .

Test (0,0).

0 + 0 ≤ 20 This is in the solution, so shade under the boundary in quadrant I.

Graph 3 a + 5 b ≤ 70 .

The boundary of this graph intersects the axes at ( 23. 3 ¯ , 0 ) and ( 0 , 14 ) .

Test (0,0).

0 + 0 ≤ 70 This is in the solution, so shade under the boundary in quadrant I.

The solution is the area shaded by both graphs. The corners of the shaded area are the intersection of the two boundary lines and the points ( 0 , 14 ) , and ( 20 , 0 ) . The maximum and minimum will occur at one of the corner points. You do not need to test (0,0) because you know the profit is 0 there.

Where do the boundaries of these inequalities cross?

a + b ≤ 20

3 a + 5 b ≤ 70

Solve a + b = 20 for a.

a = 20 − b

Substitute into the second boundary equations and solve for b.

3 ( 20 − b ) + 5 b = 70

60 − 3 b + 5 b = 70

2 b = 10

b = 5

Substitute into the first equation to find b.

a + 5 = 20

a = 15

Interpret.

The corner points of the solution are the intersection of the two boundaries and the two points: ( 0 , 14 ) , and ( 20 , 0 ) .

( 0 , 14 ) What is the profit? P = 4 a + 6 b = 4 ( 0 ) + 6 ( 14 ) = $ 84

( 20 , 0 ) What is the profit? P = 4 a + 6 b = 4 ( 20 ) + 6 ( 0 ) = $ 80

( 5 , 15 ) What is the profit? P = 4 a + 6 b = 4 ( 15 ) + 6 ( 5 ) = 60 + 30 = $ 90

The maximum profit is made when selling 15 bags of apples and 5 bunches of bananas each day.

Check Your Understanding 5.11.80 §5.11 source ↗

Kellie makes tables and chairs. Kellie profits $20 from a table ( t ), and $10 from a chair ( c ). The objective function for profit in this situation is:
  1. a.
    P = 20 t − 10 c
  2. b.
    P = 20 c + 10 t
  3. c.
    P = 20 t + 10 c
  4. d.
    P = 20 c − 10 t

Answer

C. P = 20 t + 10 c
c

Let t = the number of tables sold.

Let c = the number of chairs sold.

Let P = the profit.

The profit on a table is $20 and the profit on a chair is $10.

Break the words into components.

The total profit is $20 times the number of tables sold plus $10 times the number of chairs sold
P = 20t + 10c

P = 20 t + 10 c

Check Your Understanding 5.11.81 §5.11 source ↗

Dave grows wheat ( w ) and barley ( b ) on a farm. Dave expects to profit $150 per acre for wheat and $180 per acre for barley. The objective function for profit in this situation is:
  1. a.
    P = 150 w + 180 b
  2. b.
    P = 150 b + 180 w
  3. c.
    P = 180 w + 150 b
  4. d.
    P = 150 w − 180 b

Answer

A. P = 150 w + 180 b
a

Let w = the number of acres of wheat.

Let c = the number of acres of barley.

Let P = the profit.

The profit on an acre of wheat is $150 and the profit on an acre of barley is $180.

Break the words into components.

The total profit is $150 times the number of acres of wheat plus $180 times the number of acres of barley
P = 150w + 180b

P = 150 w + 180 b

Check Your Understanding 5.11.82 §5.11 source ↗

An antique music store sells two types of vinyl records; 45 rpm records ( f ) and 33 rpm records ( t ). It makes a profit of $2.50 for each 45 rpm record and $6.75 for each 33 rpm record. The objective function for profit in this situation is:
  1. a.
    P = 2.50 f + 6.75 c
  2. b.
    P = 2.50 f + 6.75 t
  3. c.
    P = 2.50 t + 6.75 f
  4. d.
    None of these

Answer

B. P = 2.50 f + 6.75 t
b

Let f = the number of 45 rpm records.

Let t = the number of 33 rpm records.

Let P = the profit.

The profit on a 45-rpm record is $2.50.

The profit on a 33-rpm record is $6.75.

Break the words into components.

The total profit is $2.50 times the number of 45-rpm records sold plus $6.75 times the number of 33-rpm records sold
P = 2.50f + 6.75t

P = 2.50 f + 6.75 t

Check Your Understanding 5.11.83 §5.11 source ↗

Kellie makes tables and chairs. Kellie profits $20 from a table ( t ), and $10 from a chair ( c ). A table requires 15 board feet of wood, while a chair requires 4 board feet of wood. Kellie has 70 board feet available. What is the constraint inequality in this situation?
  1. a.
    20 t + 10 c ≤ 70
  2. b.
    t + c ≤ 70
  3. c.
    15 t + 4 c ≥ 70
  4. d.
    15 t + 4 c ≤ 70

Answer

D. 15 t + 4 c ≤ 70
d

Let t = the number of tables sold.

Let c = the number of chairs sold.

Let P = the profit.

The profit on a table is $20 and the profit on a chair is $10.

A table requires 15 board feet of wood.

A chair requires 4 board feet of wood.

Kellie has 70 board feet available.

Constraint:

Break the words into components.

15 board feet times the number of tables plus 4 board feet times the number of chairs must be no more than 70 board feet
15t + 4c ≤ 70

15 t + 4 c ≤ 70

Check Your Understanding 5.11.84 §5.11 source ↗

Kellie makes tables and chairs. Kellie profits $20 from a table ( t ), and $10 from a chair ( c ). The maximum number of tables and chairs Kellie can make in any one day is 12. What is the constraint inequality in this situation?
  1. a.
    t + c ≤ 12
  2. b.
    20 t + 10 c ≤ 12
  3. c.
    20 t + 10 c ≥ 12
  4. d.
    20 t + 10 c ≤ 70

Answer

A. t + c ≤ 12
a

Let t = the number of tables sold.

Let c = the number of chairs sold.

Let P = the profit.

The maximum number of tables and chairs made in a day is 12.

Break the words into components.

The number of tables plus the number of chairs is no more than 12
t + c ≤ 12

t + c ≤ 12

Check Your Understanding 5.11.85 §5.11 source ↗

Dave grows wheat ( w ) and barley ( b ) on a farm. Dave expects to profit $150 per acre for wheat and $180 per acre for barley. The cost of seed is $10 per acre for wheat and $15 per acre for barley. Dave can only afford to spend $945 on seed. What is the constraint inequality in this situation?
  1. a.
    w + b ≤ 945
  2. b.
    10 w + 15 b ≥ 945
  3. c.
    10 w + 15 b ≤ 945
  4. d.
    150 w + 180 w ≤ 945

Answer

C. 10 w + 15 b ≤ 945
c

Let w = the number of acres of wheat.

Let b = the number of acres of barley.

The cost of seed is $10 per acre for wheat.

The cost of seed is $15 per acre for barley.

Dave can spend only $945 on seed.

Constraint:

Break the words into components.

Cost of wheat seed times number of acres plus Cost of barley seed times number of acres is no more than $945
10w + 15b ≤ 945

10 w + 15 b ≤ 945

Check Your Understanding 5.11.86 §5.11 source ↗

Dave grows wheat ( w ) and barley ( b ) on a farm. Dave expects to profit $150 per acre for wheat and $180 per acre for barley. The cost of raising each crop is $30 per acre for wheat and $25 per acre for barley. Dave budgets $1,635 for the raising of both crops. What is the constraint inequality in this situation?
  1. a.
    150 w + 180 b ≤ 1,635
  2. b.
    25 w + 30 b ≤ 1,635
  3. c.
    w + b ≤ 1,635
  4. d.
    30 w + 25 b ≤ 1,635

Answer

D. 30 w + 25 b ≤ 1,635
d

Let w = the number of acres of wheat.

Let b = the number of acres of barley.

The profit on an acre of wheat is $150 while the cost is $30 per acre.

The profit on an acre of barley is $180 while the cost is $25 per acre.

Dave budgets $1,635 for raising both crops.

Constraint:

Break the words into components.

Cost of wheat crop times number of acres plus Cost of barley crop times number of acres is no more than $1,635
30w + 25b ≤ 1,635

30 w + 25 b ≤ 1 , 635

Check Your Understanding 5.11.87 §5.11 source ↗
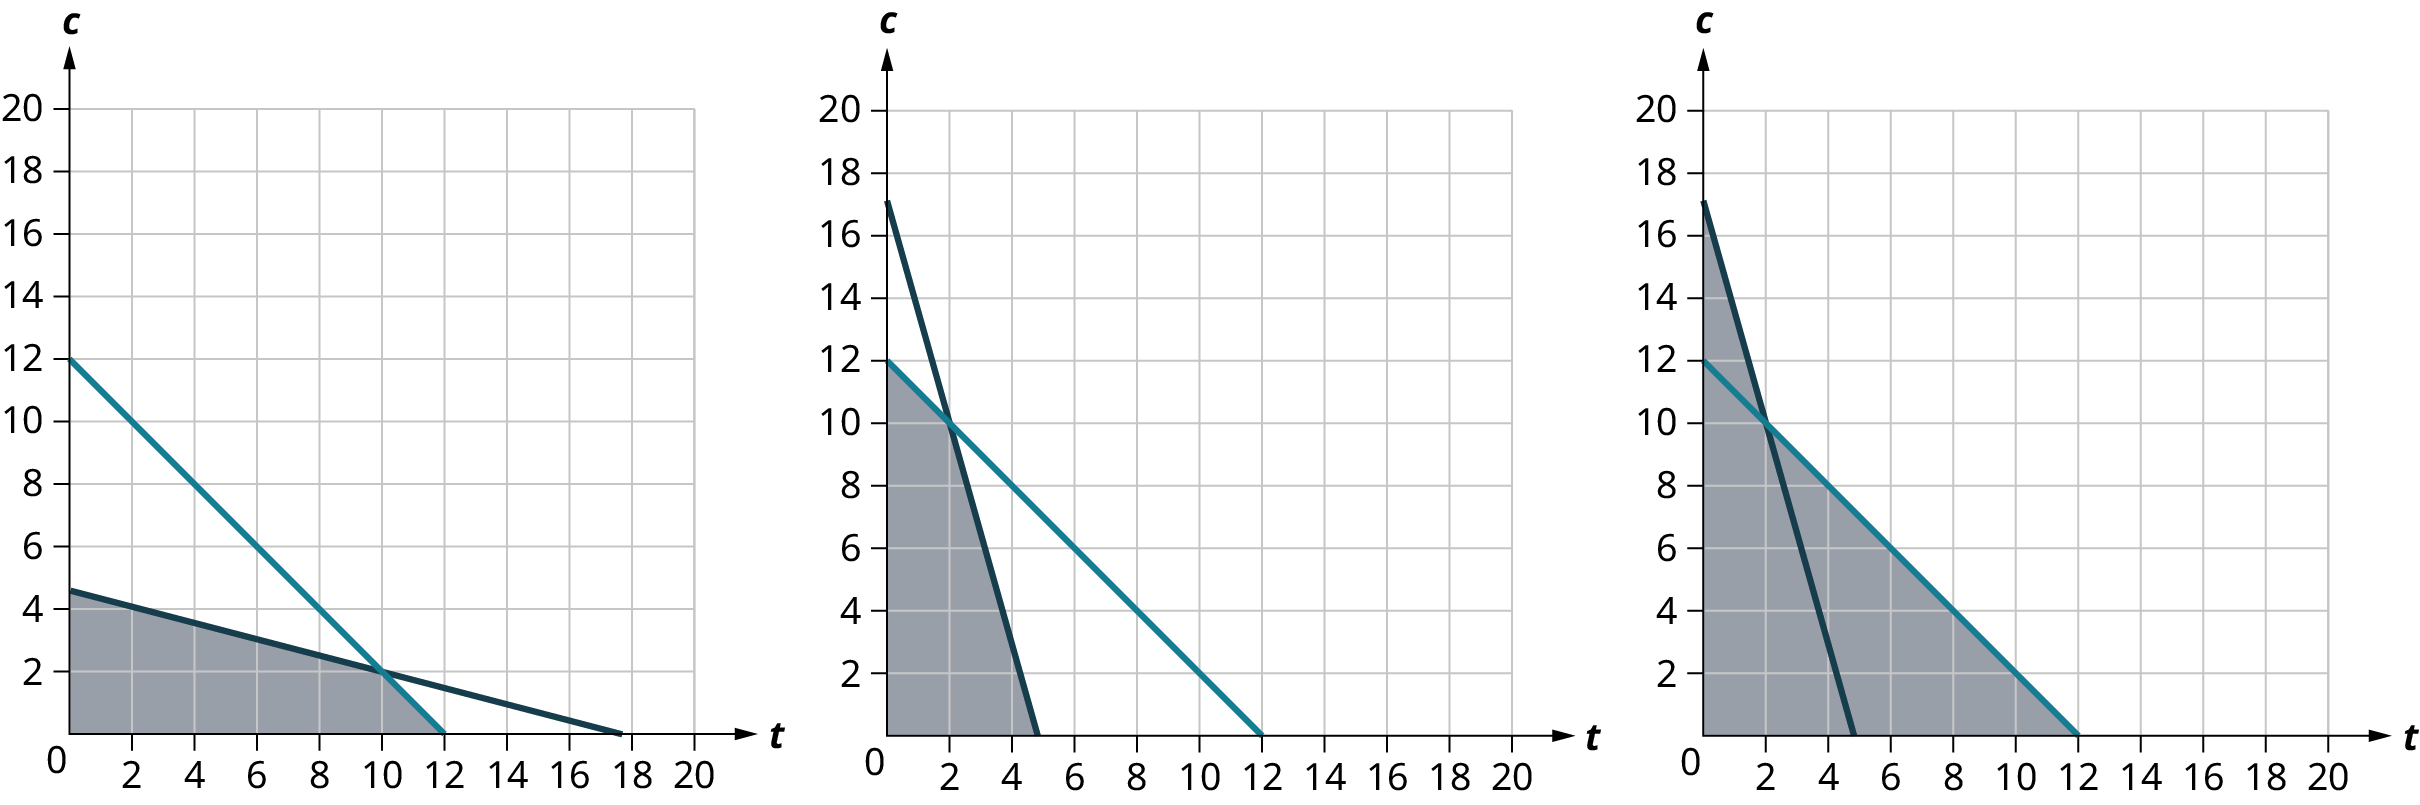
Kellie makes tables and chairs. Kellie profits $20 from a table ( t ), and $10 from a chair ( c ). A table requires 15 board feet of wood, while a chair requires 4 board feet of wood. Kellie has 70 board feet available. The maximum number of tables and chairs Kellie can make in any one day is 12. The graph of the system of inequalities representing the constraints is:
Three coordinate planes. Two lines are plotted on each coordinate plane. The horizontal and vertical axes range from 0 to 20, in increments of 2. On the first coordinate plane, the first line passes through the points, (0, 12), (6, 6), and (12, 0). The second line passes through the points, (0, 4.5), (6, 3), and (17.5, 0). The two lines intersect at (10, 2). The region below the intersection point and within the lines is shaded. On the second coordinate plane, the first line passes through the points, (0, 17), (3, 6), and (5, 0). The second line passes through the points, (0, 12), (6, 6), and (12, 0). The two lines intersect at (2, 10). The region below the intersection point and within the lines is shaded. On the third coordinate plane, the first line passes through the points, (0, 17), (3, 6), and (5, 0). The second line passes through the points, (0, 12), (6, 6), and (12, 0). The two lines intersect at (2, 10). The region below each line is shaded. Note: all values are approximate.

Answer

Let t = the number of tables sold.

Let c = the number of chairs sold.

Let P = the profit.

The profit on a table is $20 and the profit on a chair is $10.

A table requires 15 board feet of wood.

A chair requires 4 board feet of wood.

Kellie has 70 board feet available.

The maximum number of tables and chairs made in a day is 12.

Constraint:

Break the words into components.

15 board feet times the number of tables plus 4 board feet times the number of chairs must be no more than 70 board feet
15t + 4c ≤ 70

15 t + 4 c ≤ 70

The number of tables plus the number of chairs must be no more than 12
t + c ≤ 12

t + c ≤ 12

Consider t to be the “x-axis” variable and c to be the “y-axis” variable.

15 t + 4 c ≤ 70

Graph the boundary with a solid line using the intercepts ( 12 , 0 ) and ( 0 , 12 ) .

Test (0,0).

0 + 0 ≤ 12 This is true, so shade below the boundary line in quadrant I.

Graph 15 t + 4 c ≤ 70 .

Graph the boundary with a solid line using the intercepts ( 4. 6 ¯ , 0 ) and ( 0 , 17.5 ) .

Test (0,0).

0 + 0 ≤ 70 This is true, so shade below the boundary line in quadrant I.

The solution is the area shaded by both graphs.
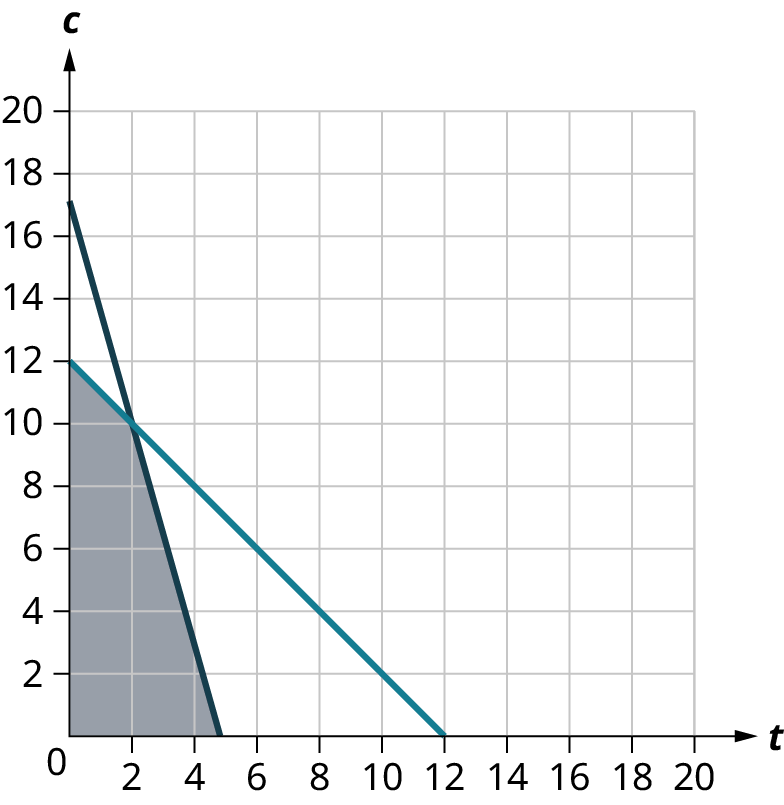
Two lines are plotted on a coordinate plane. The horizontal and vertical axes range from 0 to 20, in increments of 2. The first line passes through the points, (0, 17), (4, 3), and (5, 0). The second line passes through the points, (0, 12), (6, 6), and (12, 0). The two lines intersect at (2, 10). The region within the lines and below the intersection point is shaded. Note: all values are approximate.

Check Your Understanding 5.11.88 §5.11 source ↗

Kellie makes tables and chairs. Kellie profits $20 from a table ( t ), and $10 from a chair ( c ). A table requires 15 board feet of wood, while a chair requires 4 board feet of wood. Kellie has 70 board feet available. The maximum number of tables and chairs Kellie can make in any one day is 12. The four corner points of the system are:
  1. a.
    ( 0 , 0 ) , ( 0 , 12 ) , ( 10 , 2 ) , ( 12 , 0 )
  2. b.
    ( 0 , 0 ) , ( 0 , 12 ) , ( 2 , 10 ) , ( 4 2 3 , 0 )
  3. c.
    ( 0 , 0 ) , ( 17.5 , 0 ) , ( 2 , 10 ) , ( 12 , 0 )

Answer

B. ( 0 , 0 ) , ( 0 , 12 ) , ( 2 , 10 ) , ( 4 2 3 , 0 )
b

Where do the boundaries of these inequalities cross?

t + c ≤ 12

15 t + 4 c ≤ 70

Solve t + c = 12 for t.

t = 12 − c

Substitute into the second boundary equations and solve for b.

15 ( 12 − c ) + 4 c = 70

180 − 15 c + 4 c = 70

− 11 c = − 110

c = 10

Substitute into the first equation to find b.

t = 12 − 10

t = 2

The corners of the shaded area are

• the intersection of the two boundary lines: (2, 10)

• the points where two of the boundary lines intersect the axes: ( 0 , 12 ) , and ( 4. 2 3 , 0 )

• (0, 0).

Check Your Understanding 5.11.89 §5.11 source ↗

Kellie makes tables and chairs. Kellie profits $20 from a table ( t ), and $10 from a chair ( c ). A table requires 15 board feet of wood, while a chair requires 4 board feet of wood. Kellie has 70 board feet available. The maximum number of tables and chairs Kellie can make in any one day is 12. The maximum profit Kellie can make in one day is:
$ 220 $ 120 $ 140 $ 24

Answer

Let P = the profit.

The profit on a table is $20 and the profit on a chair is $10 .

P = 20 t + 10 c

The maximum and minimum will occur at one of the corner points. You do not need to test (0,0) because you know the profit is 0 there, even though technically it is also a corner point.

Interpret.

The corner points of the solution are the intersection of the two boundaries, (2, 10), and the two points: ( 0 , 12 ) , and ( 4. 2 3 , 0 ) .

( 0 , 12 ) What is the profit? P = 20 ( 0 ) + 10 ( 12 ) = $ 120 .

( 4. 2 3 , 0 ) What is the profit? P = 20 ( 14 3 ) + 10 ( 0 ) ≈ $ 93.33 .

( 2 , 10 ) What is the profit? P = 20 ( 2 ) + 10 ( 10 ) = $ 140 .

The maximum profit is made when making 2 tables and 10 chairs. Kellie will make a profit of $140 .

$ 140

Loading chapter 6…

Problems and answers are adapted from Contemporary Mathematics by Donna Kirk, OpenStax, and are used under the CC BY-NC-SA 4.0 licence. Access for free at https://openstax.org/books/contemporary-mathematics/pages/1-introduction. Illustrations: Copyright Rice University, OpenStax, under CC BY-NC-SA 4.0 license. This adaptation is released under the same licence, is non-commercial, and is neither affiliated with nor endorsed by OpenStax or Rice University.